Carbon Cycle, Fire, Emissions, Climate 🌎🔥 @NERCscience Research Fellow. @ueaenv @TyndallCentre, @gcarbonproject.
Bluesky: https://t.co/RKTD5QAeuX
 @ScientificData We provide estimates of the #warming caused by historical #emissions of #CO2, #CH4 and #N2O by 226 countries, for every year since 1850.
 It's a story of persistent high global #CO2 emissions, but with some hints (and some hope!) that *total* human #emissions are levelling off.
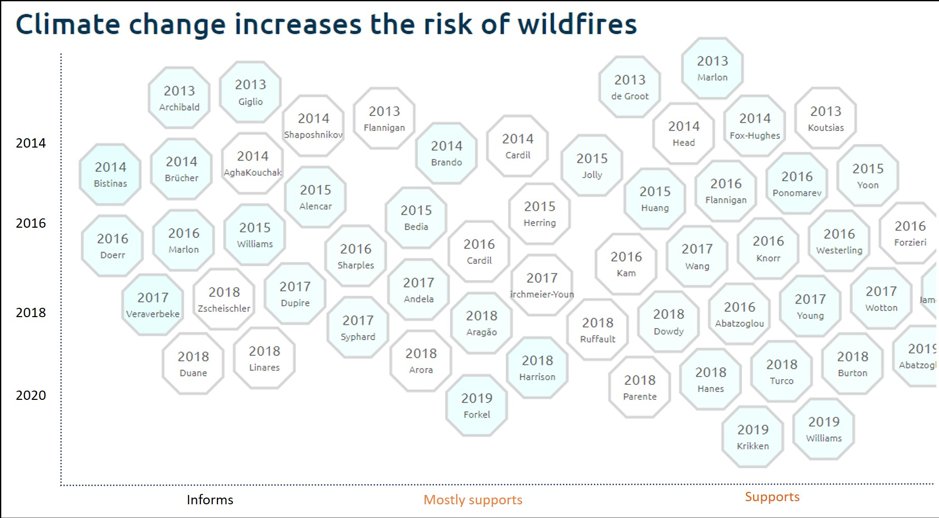
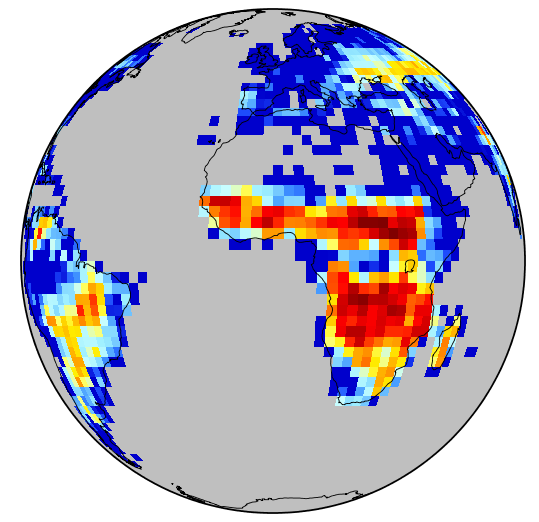 It's tough to distill all these complexities into general statements, so here's a thread to showcase what 🛰 observations can reveal about 🔥 trends at various regional scales.
 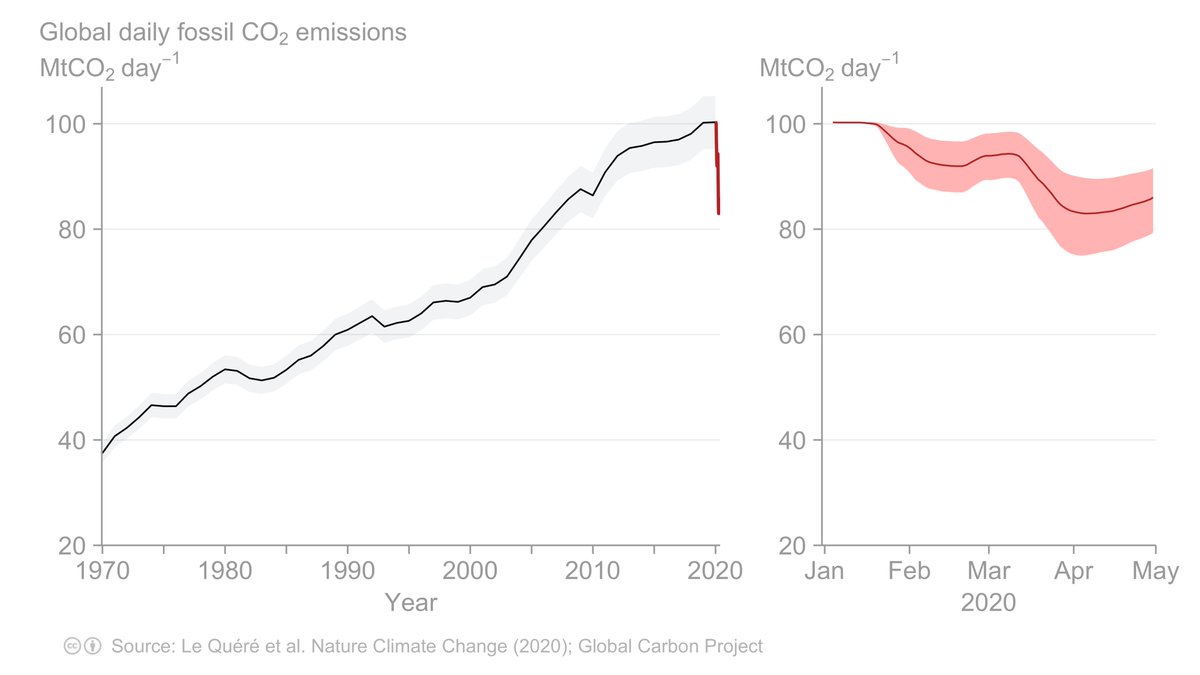 2/
2/