Analysis: #NASDAQ $ALT
Case 456 #Altimmune Inc.
DISCLAIMER: The analysis is strictly for educational purposes and should not be construed as an invitation to trade.
#ALT 1/4
Case 456 #Altimmune Inc.
DISCLAIMER: The analysis is strictly for educational purposes and should not be construed as an invitation to trade.
#ALT 1/4
Chart 1
Weekly Chart: Conditions are very negative with falling #momentum and now expecting a break below the #Fib. 0.618 at 14.95. Farther down the #SMA 20 at 14.33 then May 2020 #trendline and synthetic crossing over at 12.68 with synthetic .....
ALT 2/4
Weekly Chart: Conditions are very negative with falling #momentum and now expecting a break below the #Fib. 0.618 at 14.95. Farther down the #SMA 20 at 14.33 then May 2020 #trendline and synthetic crossing over at 12.68 with synthetic .....
ALT 2/4
..... slope at 12.22. Major #support is seen between 9.48- 6.05. To the upside #resistance at 22.65- 25.63 but only a close/hold above 33.92 will see this gain traction.
ALT 3/4
ALT 3/4
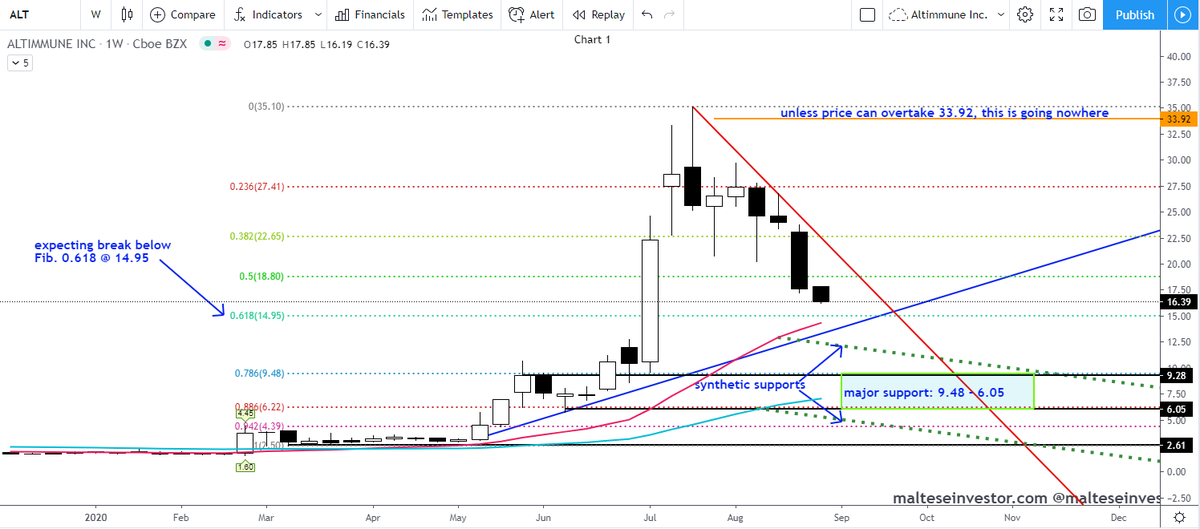
Chart 2
Daily Chart: Price has broken below the SMA 50 at 20.77. The SMA 200 at 7.81 is sandwiched in the major support zone.
The #Strategy is printed on the image.
$ALT 4/4
Daily Chart: Price has broken below the SMA 50 at 20.77. The SMA 200 at 7.81 is sandwiched in the major support zone.
The #Strategy is printed on the image.
$ALT 4/4