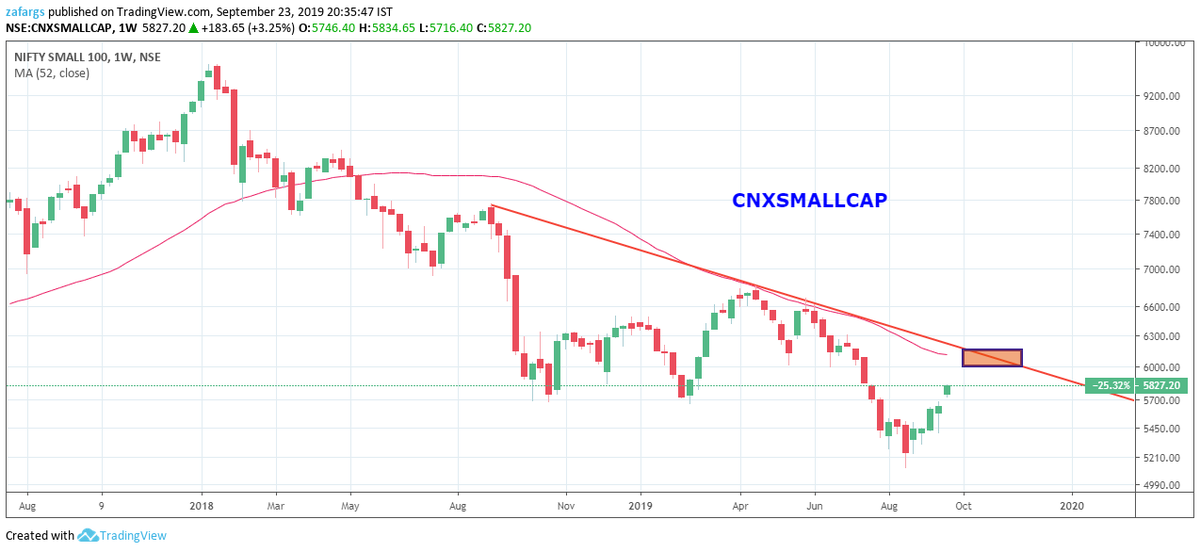
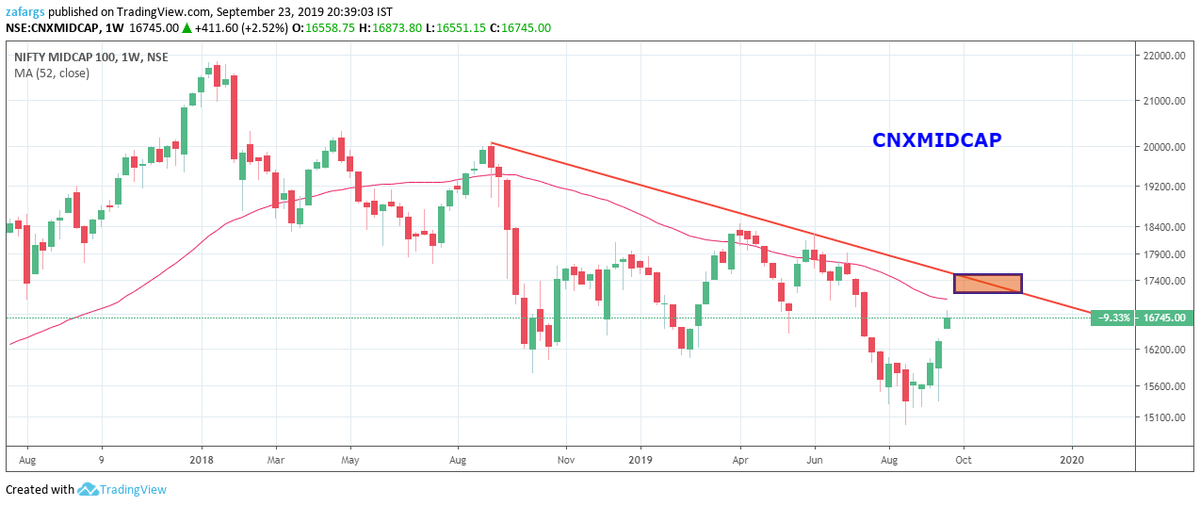
#AVWAP For Multibaggers
Rather Than Revealing All Small Secrets, Posting Some Weekly Charts In This Thread
Some Multibaggers, Some Duds, Some Great Companies But In Downtrend Currently
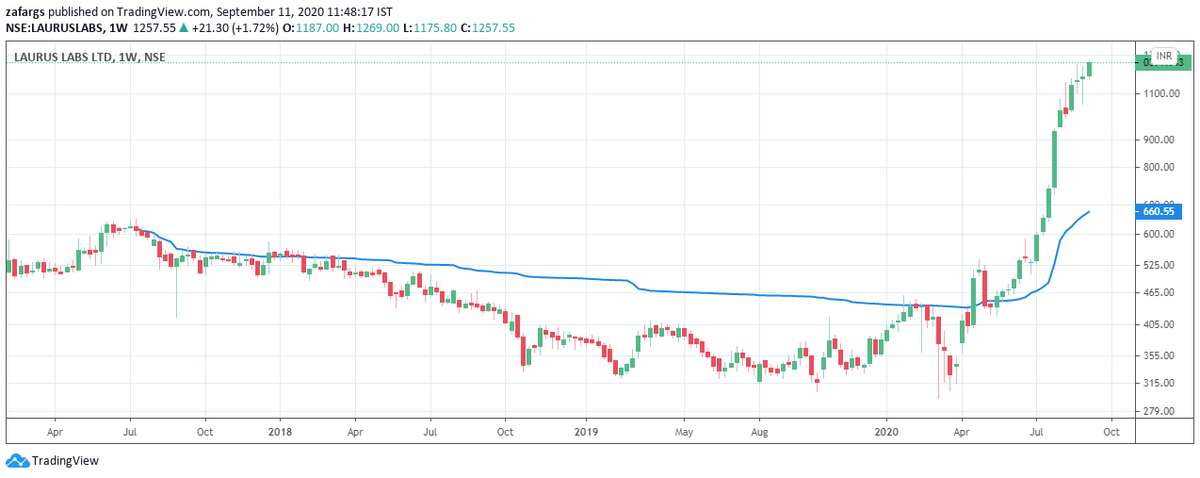
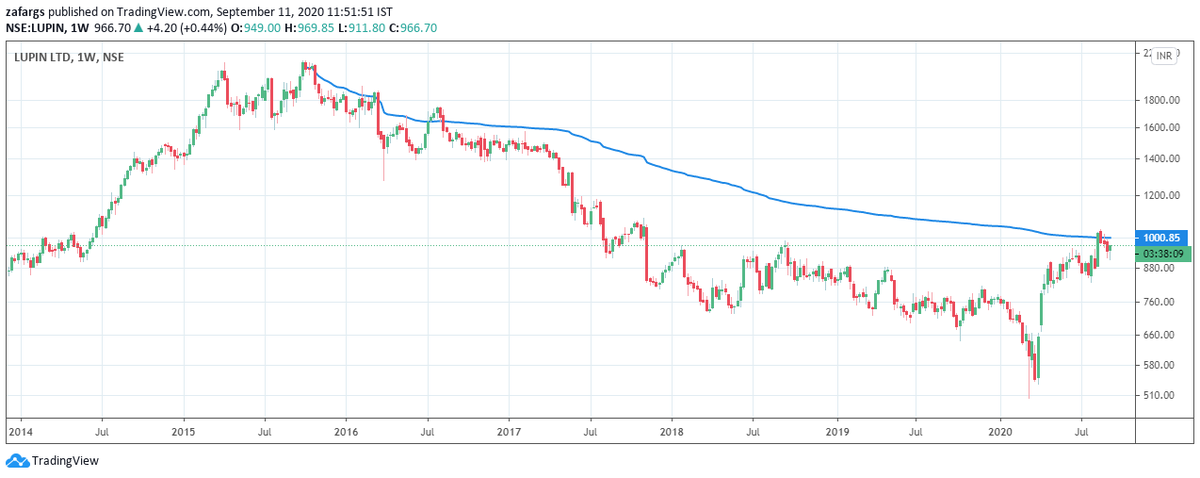
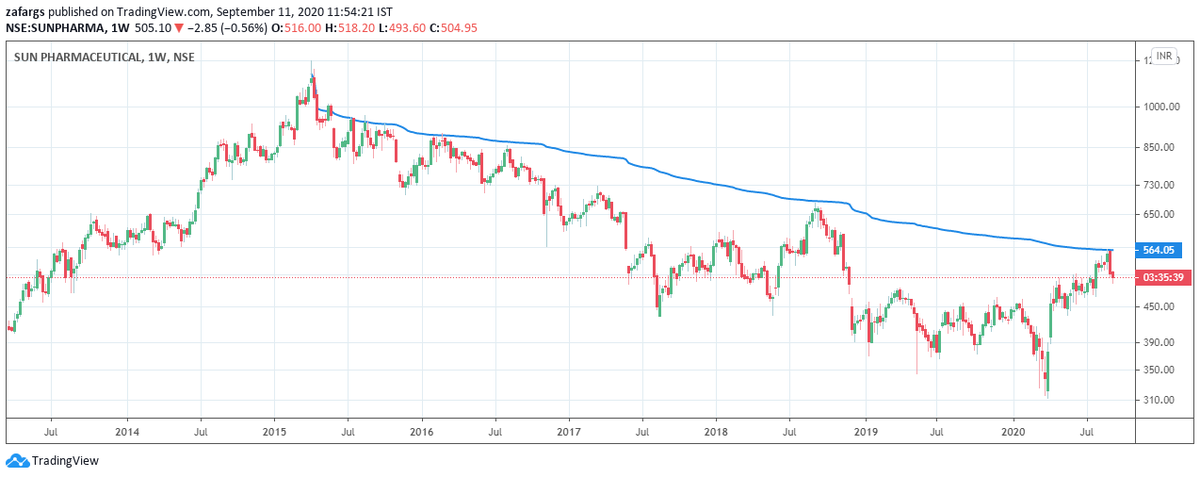
Common Theme - AVWAP Plotted From Last x Yrs High Candle
Many Will Figure It Out
Rather Than Revealing All Small Secrets, Posting Some Weekly Charts In This Thread
Some Multibaggers, Some Duds, Some Great Companies But In Downtrend Currently
Common Theme - AVWAP Plotted From Last x Yrs High Candle
Many Will Figure It Out
https://twitter.com/InvesysCapital/status/1304294380719620101


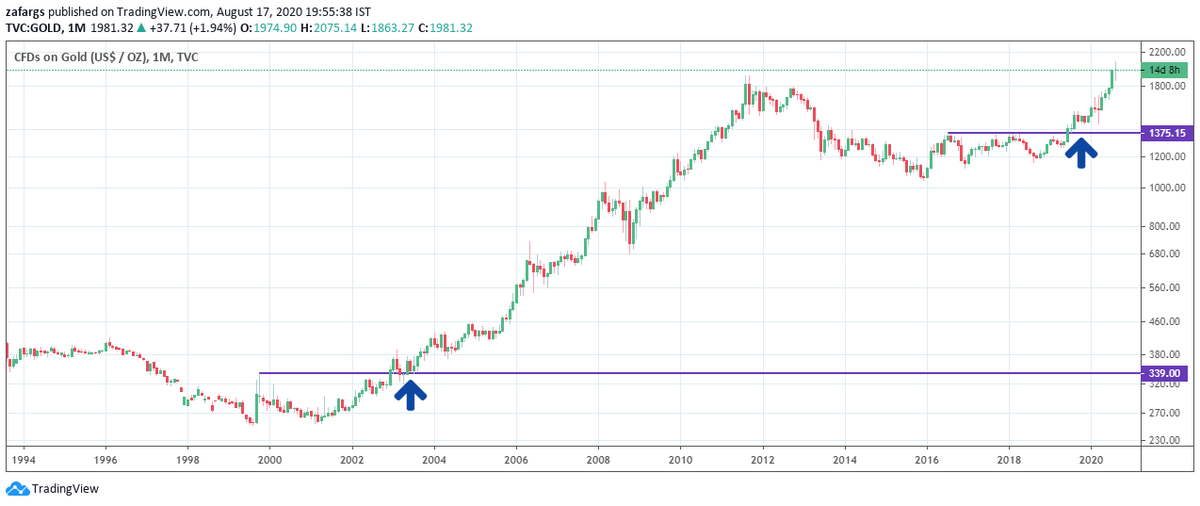
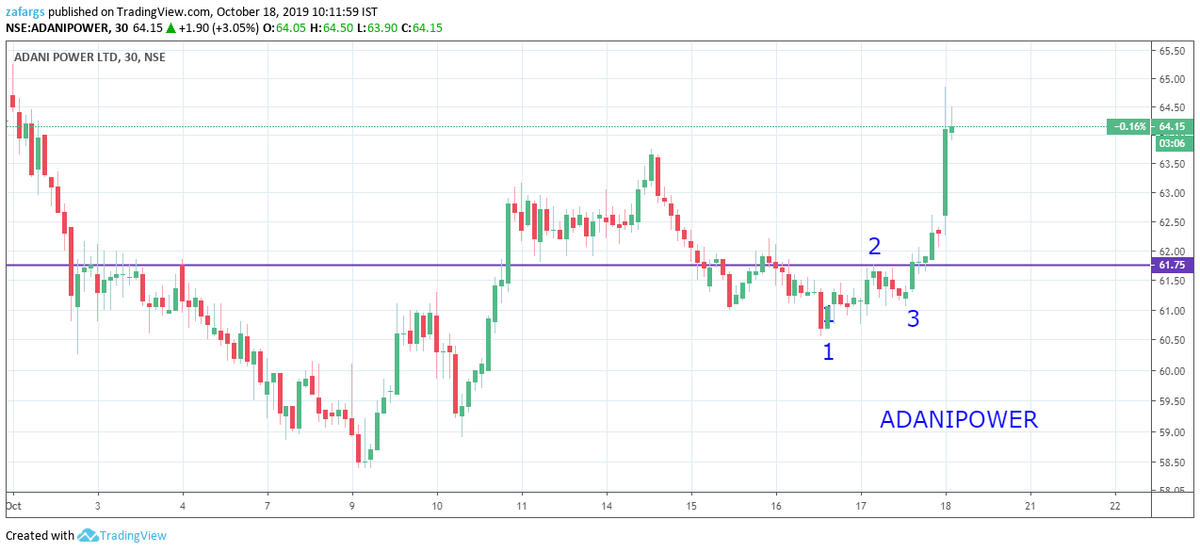
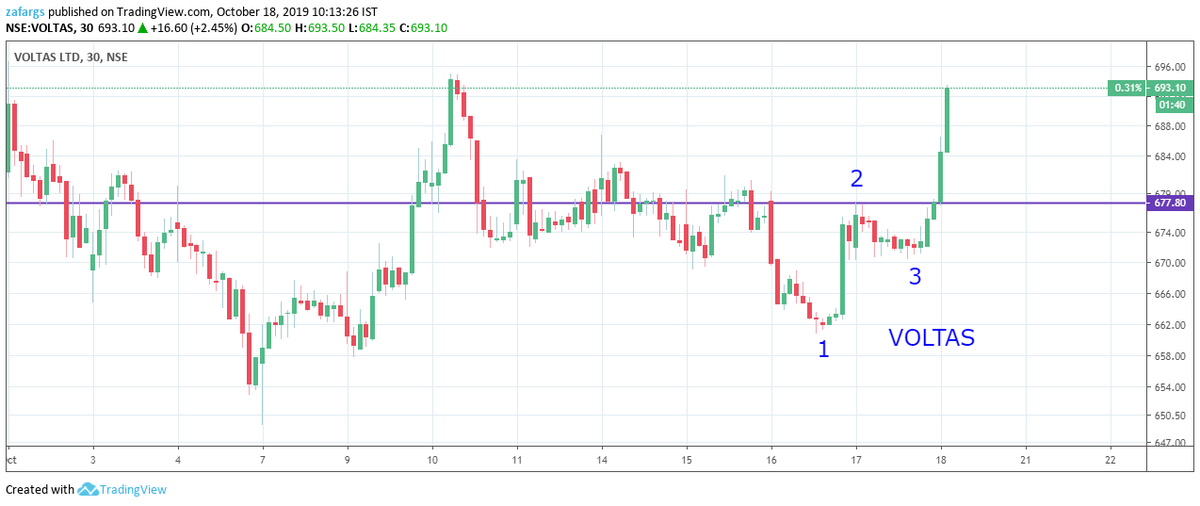
Simple Concept
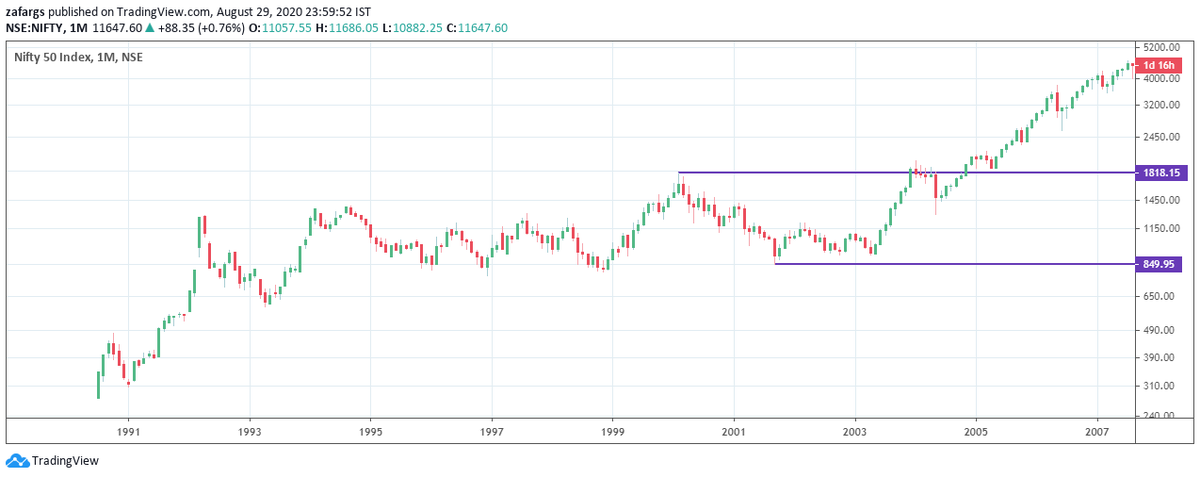
1. Demand Higher Than Supply
2. Buyers Able To Absorb All Supply
3. After Absorbing Supply, There Should Be Follow-up Demand
4. More Ppl Should be Sitting In Profit Than In Losses For Stock To Keep Rising Higher
If You Got The Points, Great & Best Luck👍
1. Demand Higher Than Supply
2. Buyers Able To Absorb All Supply
3. After Absorbing Supply, There Should Be Follow-up Demand
4. More Ppl Should be Sitting In Profit Than In Losses For Stock To Keep Rising Higher
If You Got The Points, Great & Best Luck👍
• • •
Missing some Tweet in this thread? You can try to
force a refresh