Zafar Shaikh Profile picture
Finance l Trader l Investor Stocks I Options I Quant l Multibaggers I Technofunda I Priceaction I Momentum I
Sep 11, 2020 11 tweets 5 min read
#AVWAP For Multibaggers

Rather Than Revealing All Small Secrets, Posting Some Weekly Charts In This Thread

Some Multibaggers, Some Duds, Some Great Companies But In Downtrend Currently

Common Theme - AVWAP Plotted From Last x Yrs High Candle

Many Will Figure It Out #Lauraslabs
Aug 29, 2020 5 tweets 3 min read
How #Fibonacci Extensions On Log-Scale Can Give Long Term Targets For #Index BullRun?

1.618 & 2.618 are most popular extension applied on Previous Major Corrections

Problem of taking #Linear projections on Long Term Chart is that they give very Small Target 
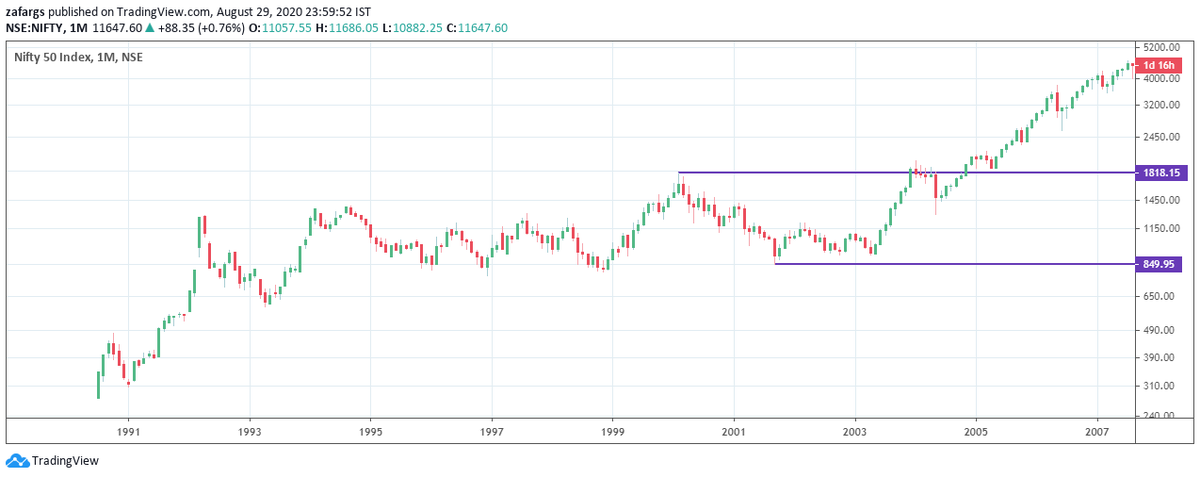
Example- Nifty Major Correction in 2000-2003 bear Market Happened from 1818 to 850

if One takes the difference on linear scale & apply 1.618,2.618 extensions, it gives targets of 2416 & 3384, way too small than what Nifty achieved in next Bull Run
Aug 22, 2020 10 tweets 3 min read
#BollingerBand Squeeze Breakout

Sharing An Entry Set-up For Cash Market Since Cash Market Is Running Hot Currently

Bollinger Bands Are Volatility Bands with Centre line, Upper & Lower Band

Centre Line Is Simple Moving Average

Default Is 20 Period Simple Moving Average 
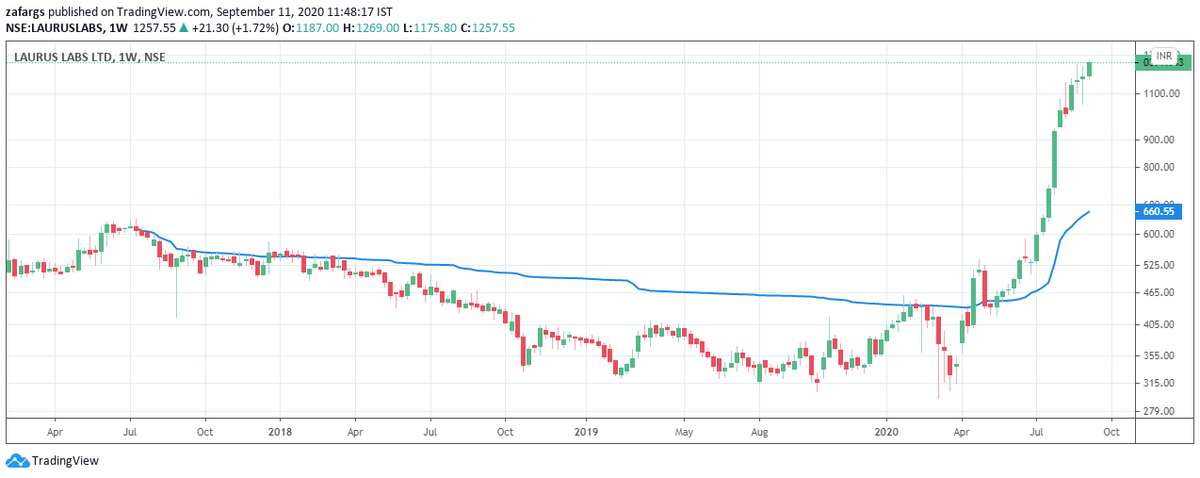
Upper & Lower Bands are constructed by Adding / Subtracting Standard Deviation Values from SMA

Default is 2 Standard Deviation Away from 20 SMA for Upper & Lower Band

During Trending Phase, Bollinger Bands generally expand as Standard Deviation Expands in Trending Phase
Aug 17, 2020 6 tweets 3 min read
Perfect #Storm

What Happened In 2002-04 & What Is Happening in 2020? Is There Any Hint For #Equities?

1. Dollar Index #DXY

In Dec 2002, DXY Broke Multiyear Support Line & Went Into Longterm Downtrend, Shifting Flows to Emerging Markets over next 5-10 yrs 2. India 10 Yr Yields

Hitting multiyear lows in 2020 - Like in 2003/2009

Beneficial for interest rate sensitive industry demand

Autos/Realestate/ConsumerDurables
Oct 25, 2019 7 tweets 4 min read
#Samvat2076

It Is An Auspicious Time For Investment, But Last Two Diwali's have Not been very Good for Many Portfolio's

How Are We Poised To Fare Between Current & Next Diwali?

A Short Thread On Our Expectations- #Nifty & #BankNifty in Overbought Zone With Potential Of Price Or Time Correction Till Q1-2020

We Had tweeted Abt How BNF Corrections Run Five Qtr & Expected till Jun20

These Indices Are Not Budging & Sell Signal here Doesn't Mean Price Correction, Can Be time Correction
Oct 18, 2019 9 tweets 5 min read
Just Amused With Queries On Such #Simple 1-2-3 Pattern, So Giving Few Current Examples In #Thread To Make It Even More Clear! Stocks Which We Traded & Tracking

In This Pattern #StockSelection & #TimeBalance Is The Key!

Buy Strongest Stock, Sell Weakest

Scroll For Examples👇 #ADANIPOWER on 30M

Stock Is In Daily Uptrend, Corrected For 3-4 Days, Then Made 1-2-3 Pattern with Entry at 61.75

In Few Hours 5% Movement, Thats 60k Per Lot , Traded This 🙂
Sep 23, 2019 5 tweets 3 min read
#BiggerPicture

After #BlockBuster Move, What Next? How Far Indices Will Travel in Next 2-3 Months? When to Expect Next Major Resistance?

Looking At All Different MarketCap Indices Provides Clues.

Lets Start With #CNXSMALLCAP Weekly Image 
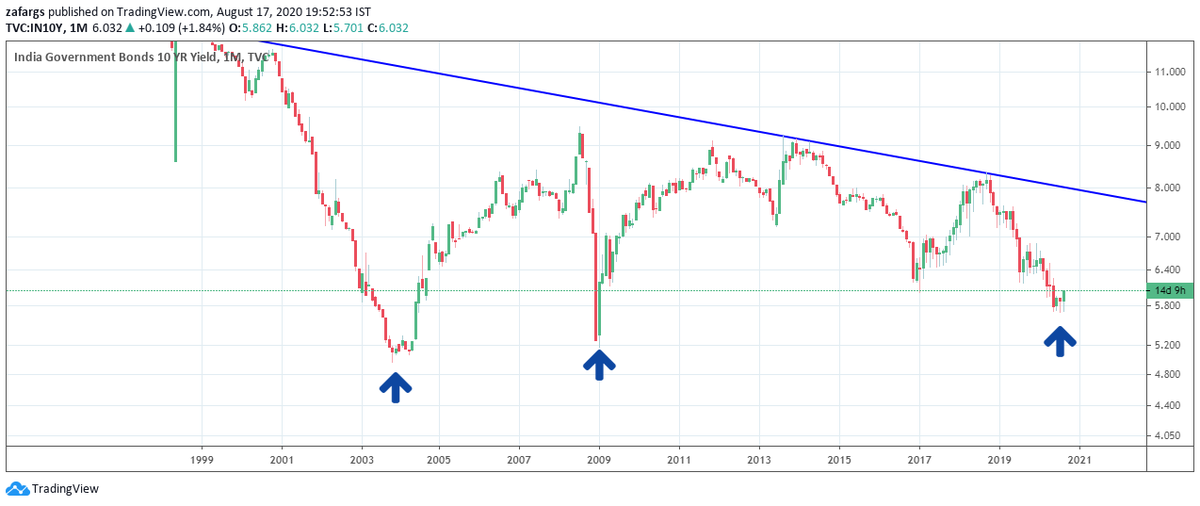
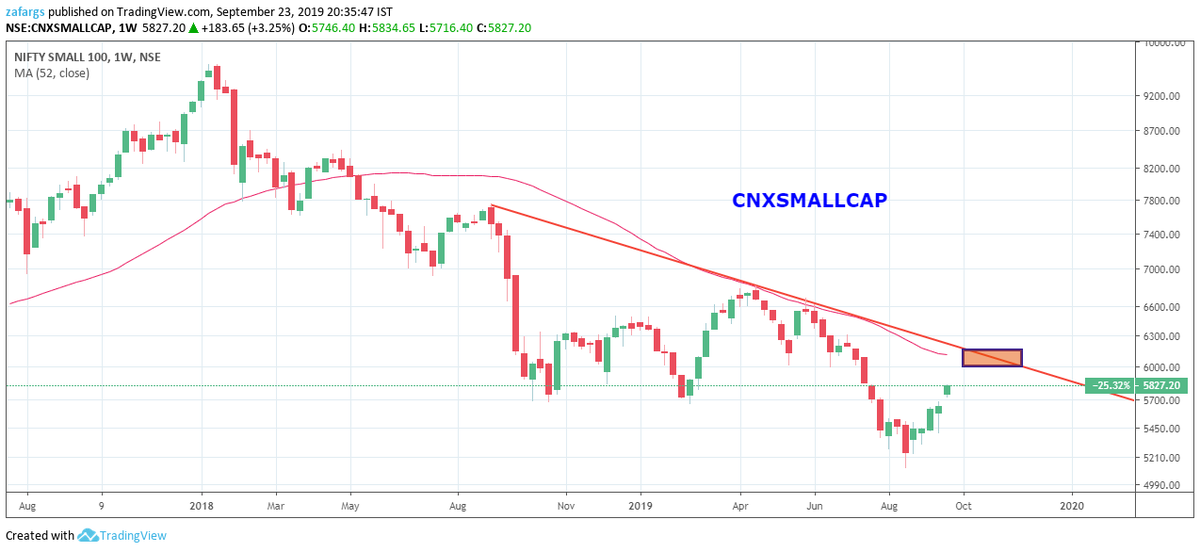
SmallCap Index Showing Major Signs Of Bottoming Out But Will Face Hurdle at 52WMA & Trendline Placed at 6100-6200 Zone

CMP 5827

Upside Of 4-6% Before Facing Hurdle Image
Oct 21, 2018 13 tweets 3 min read
#INVESTING

I Had Always Been Mostly #Trader With Dash Of #Investing Thrown In Between When Started Out In World Of Stocks. Last 5 Years Have Been Revelation on Investing Front. I Have Formed My Own Investing Philosophy & it Has Been Hugely Rewarding In Terms Of Strategy ..(1/n) And The Potential it Holds Out For Future! The Basic Premise For My PhiloSophy is CAGR (Compounded Annual Growth Rate). RJ is RJ Because of Phenomenal 40%+ CAGR Since 80's. So Basically, Achieving High CAGR Over Long Period Of Time is All That Is To Wealth Creation (2/n)
Oct 5, 2018 7 tweets 3 min read
Pulling Out Two Slides At #DECMA Presentation In March This Year Detailing #Cycles Of Stock Market and Where We Are At Current Juncture! The #BennerFibonacci Time Cycles Point That Major Stock Market Cycles Happen With 8-10 Year Difference Between Consecutive Tops & Bottom (1/n) 
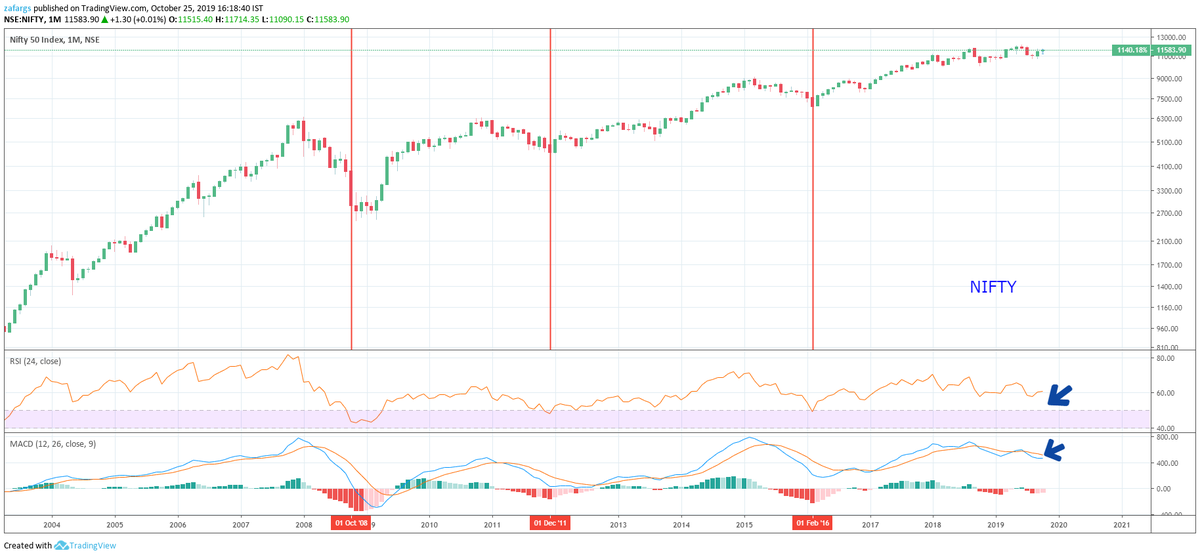
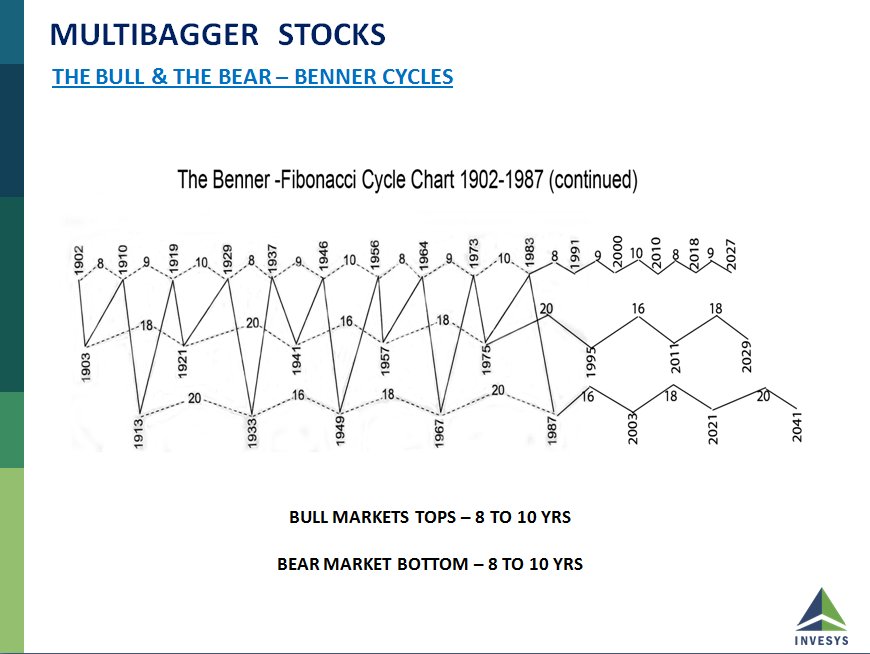
We Had Major Market Tops In SENSEX at 1992, Followed By 2000 (8Yr), Followed By 2008(8Yr).. Now We are in 2018 (10 yrs). There Are Intermediate Corrections Also In-Between. The Difference -Correction After Benner Time Cycle is Complete Are Severe With Index Dropping 40-50% (2/n)
Sep 22, 2018 12 tweets 3 min read
#New Traders, Understand #Mathematics Of #Profit In Market Before You Put Hard #Earned Money On Risk.

Expectancy = Success Rate x Reward Risk Ratio

Lets Talk About Expectancy Of Short Term Directional Trading System.

Read On (1/n) Success Rate = No Of Profitable Tades/ No Of Loss Making Trades

Reward Risk Ratio = Average Profit Per Trade / Average Loss Per Trade

If Success Rate is 0.5 and Reward Risk 2, Then

Expectancy = 2 x 0.5 =1

For Making Profit, Expectancy Should Be Positive Number (2/n)