I thought I would share with you the PHE work on where cases are on the watchlist.
For each:
A map showing how cases per 100,000 last week and this week.
A chart showing positivity. High positivity = not enough testing.
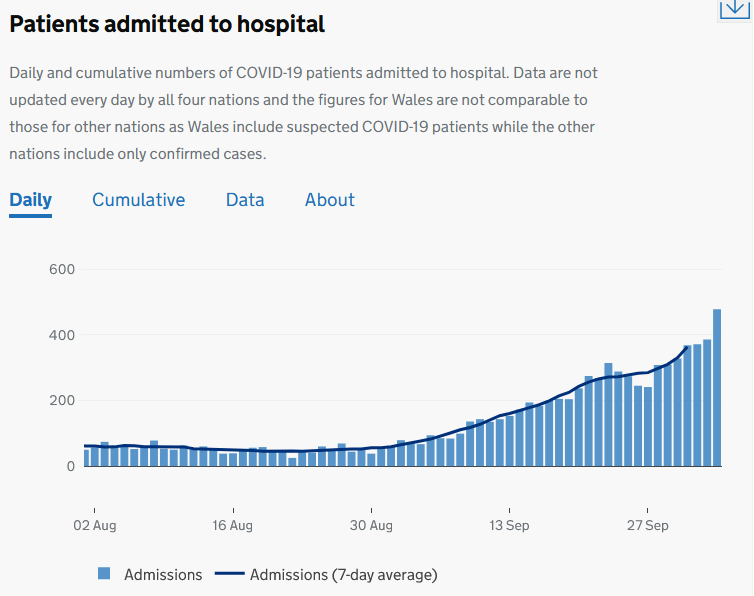
Here's the national picture.
For each:
A map showing how cases per 100,000 last week and this week.
A chart showing positivity. High positivity = not enough testing.
Here's the national picture.

For context, New York closing schools at 3%. However, positivity in New York may be measured slightly differently.
Here is a case study - Liverpool vs New York
duncanrobertson.com/2020/10/04/we-…
Here is a case study - Liverpool vs New York
duncanrobertson.com/2020/10/04/we-…
There are more local authorities on the watch list, but hopefully this gives you some idea of what is going on.
• • •
Missing some Tweet in this thread? You can try to
force a refresh


