Wk 20 Test and Trace - 08/10/20 to 15/10/20
-For the first time, >100,000 cases in a week
-Percentage of cases being reached is still high, but high numbers mean 18k still not contacted.
-Plus it's taking longer.
Summary in pics, detail in thread
gov.uk/government/pub…
-For the first time, >100,000 cases in a week
-Percentage of cases being reached is still high, but high numbers mean 18k still not contacted.
-Plus it's taking longer.
Summary in pics, detail in thread
gov.uk/government/pub…


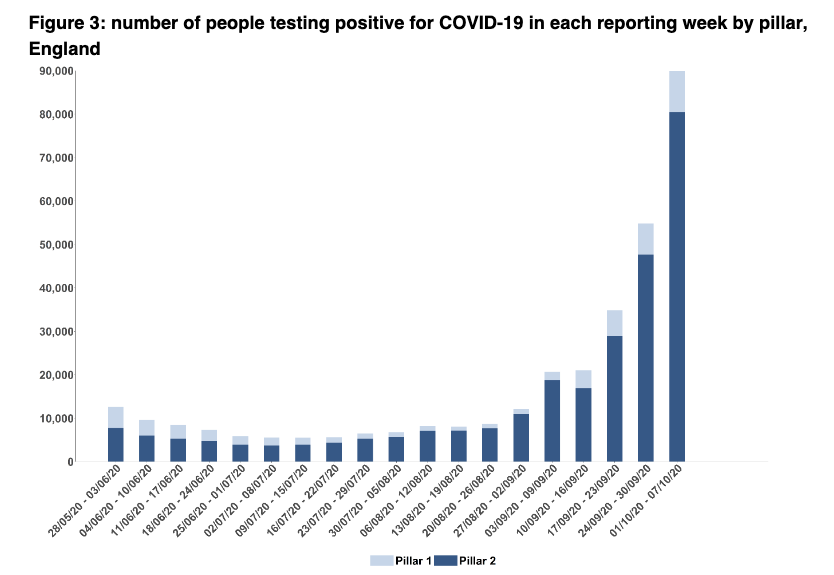
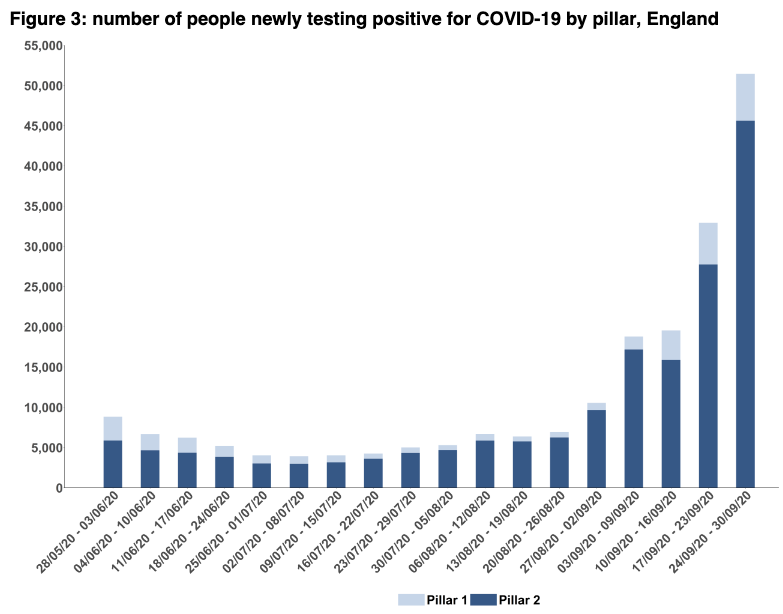
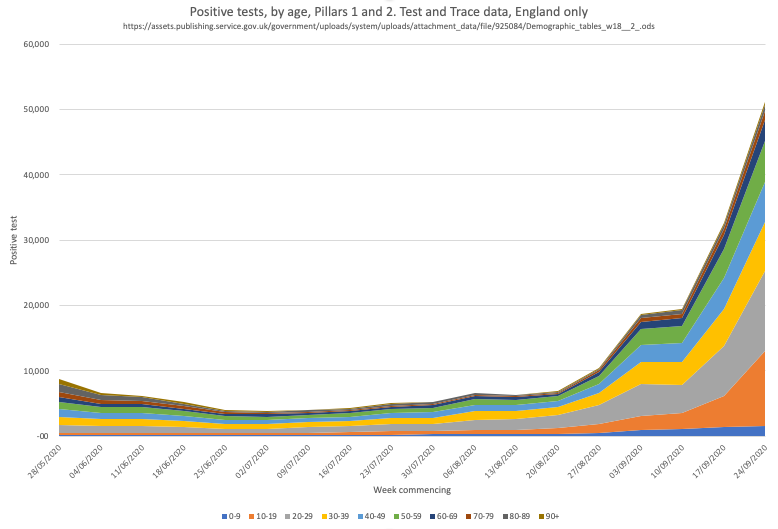
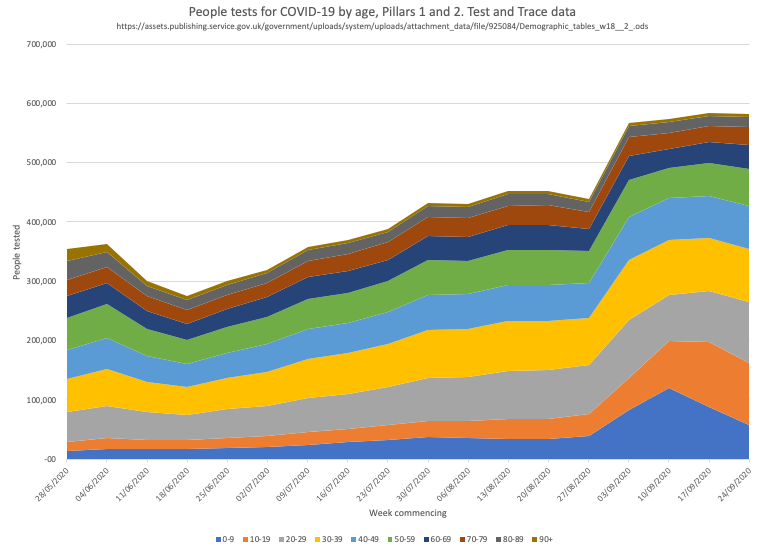
Whilst the number tested in the last week was same as wk before, the total cases⬆️12% to 101,494.
12,323 are pillar 1 (up 26% on last week), & 89,171 are pillar 2 (up 11% on last week.
Pillar 1 positivity now 3.3% (hospitals/outbreaks)
Pillar 2 positivity now 8.5% (community)
12,323 are pillar 1 (up 26% on last week), & 89,171 are pillar 2 (up 11% on last week.
Pillar 1 positivity now 3.3% (hospitals/outbreaks)
Pillar 2 positivity now 8.5% (community)


By age, 10-29 yr olds still account for the majority of cases, but as today's PHE surveillance report (data to 28th Oct) shows, more and more older people are becoming infected, and infection rates among 10-29 may be leveling off.
https://twitter.com/ADMBriggs/status/1319297001398308872?s=20


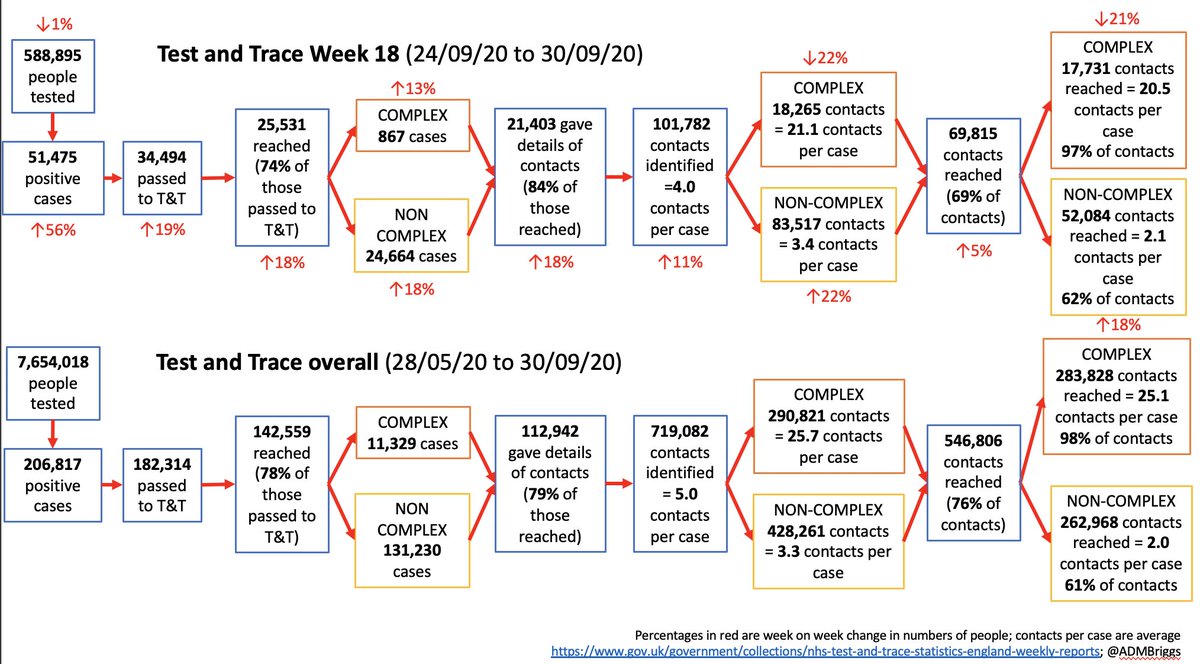
When it comes to contact tracing - the number of people transferred was up 13% to 96,521.
The increase was in non-complex (community) cases - up 14% to 76,096.
Complex cases (high risk setting/outbreak) were down 15% to 1,796.
The increase was in non-complex (community) cases - up 14% to 76,096.
Complex cases (high risk setting/outbreak) were down 15% to 1,796.
Fewer complex cases is a good thing. But they still generally only make up a v small percentage of total cases.
This week, 81% of cases were reached which is also generally pretty good for TT (80% last week).
But note, that's still 36,000 cases not reached in the past 2 wks.
This week, 81% of cases were reached which is also generally pretty good for TT (80% last week).
But note, that's still 36,000 cases not reached in the past 2 wks.

And the percentage of case providing details of contacts remains high at 85%.
This is really great to see, particularly as these data are now two weeks after fines were introduced for non-compliance which may have reduced people's willingness to engage.
This is really great to see, particularly as these data are now two weeks after fines were introduced for non-compliance which may have reduced people's willingness to engage.

The number of contacts is also growing wk on wk.
Up 15% this week to 251,613, of which 238,093 are non-complex.
This is a huge number of people potentially being asked to isolate.
Up 15% this week to 251,613, of which 238,093 are non-complex.
This is a huge number of people potentially being asked to isolate.

The increase is all due to non-complex cases, where case numbers were up 14%, and average number of contacts per case increase from 2.8 to 3.1.
Interestingly, the number of contacts per complex case has fallen over the past three weeks from 29 in w/c 17/09 to just 7.5 this week
Interestingly, the number of contacts per complex case has fallen over the past three weeks from 29 in w/c 17/09 to just 7.5 this week
I'm unsure why this is - it may be because of social restrictions, better social distancing, better use of PPE in high risk settings.
PHE data doesn't suggest there are fewer outbreaks (if anything, more)
Or it may be a data anomaly but the trend is definitely down.
PHE data doesn't suggest there are fewer outbreaks (if anything, more)
Or it may be a data anomaly but the trend is definitely down.

In terms of percentage of contacts reached - this is now 60% compared to 63% the wk before.
But this is driven by having a greater proportion of non-complex cases compared to complex cases.
The percentage of non-complex contacts reached has stayed the same at 58%.
But this is driven by having a greater proportion of non-complex cases compared to complex cases.
The percentage of non-complex contacts reached has stayed the same at 58%.

The percentage of non-complex contacts that in the same household continues to rise suggesting reduced inter-household mixing.

TT manages to reach a lower % of HH contacts compared to non-HH contacts.
This is likely to be partly due to HH contacts being told by their HH to isolate & therefore don't want to speak with TT
If you treated them as reached, the % reached for non-complex contacts would be 90%
This is likely to be partly due to HH contacts being told by their HH to isolate & therefore don't want to speak with TT
If you treated them as reached, the % reached for non-complex contacts would be 90%

But now we come to where TT is really struggling.
Pillar 1 testing time is staying relatively consistent, but for in person pillar 2 tests, the median time to result has jumped from about 28hrs to over 40 hours.
Pillar 1 testing time is staying relatively consistent, but for in person pillar 2 tests, the median time to result has jumped from about 28hrs to over 40 hours.


And once in the system, the percentage of cases contacted within 24 hours has fallen yet again, and now stands at 54% (with sig implications for local contact tracing systems, as mentioned last week)

And the percentage of non-complex contacts being reached with 24 hrs of the case being transferred to TT has fallen to just 32%

So in summary
-TT is reaching a high proportion of cases, but given the sheer number of people testing positive, this means 000's are still not contacted.
-And whilst the percentage of contacts reached isn't changing much, it's still just 60% and it's taking longer.
-TT is reaching a high proportion of cases, but given the sheer number of people testing positive, this means 000's are still not contacted.
-And whilst the percentage of contacts reached isn't changing much, it's still just 60% and it's taking longer.

As as today's PHE data show, the infection is moving more and more into older age groups, and this is translating into hospitalisations and deaths.
https://twitter.com/ADMBriggs/status/1319297056549212160?s=20
And here's @Dr_D_Robertson's excellent heat map from today.
https://twitter.com/Dr_D_Robertson/status/1319292649698807813?s=20
Please be careful over half term.
Here's link today's @HealthFdn TT tracker for this week's data and images.
health.org.uk/news-and-comme…
health.org.uk/news-and-comme…
Wk 20 T&T here ☝️ @felly500 @trishgreenhalgh @deb_cohen @martinmckee @carolecadwalla @mgtmccartney @ADPHUK @Jeanelleuk @fascinatorfun @profchrisham @petermbenglish @HPIAndyCowper @Davewwest @HSJEditor @KateAlvanley @IndependentSage @nedwards_1 @chrischirp
@SamanthaJonesUK
@SamanthaJonesUK
• • •
Missing some Tweet in this thread? You can try to
force a refresh