This week's PHE flu and COVID surveillance. Data 19-25th Oct.
The situation continues to worsen.
Although good news that there's very little flu around at the moment.
gov.uk/government/sta…
The situation continues to worsen.
Although good news that there's very little flu around at the moment.
gov.uk/government/sta…
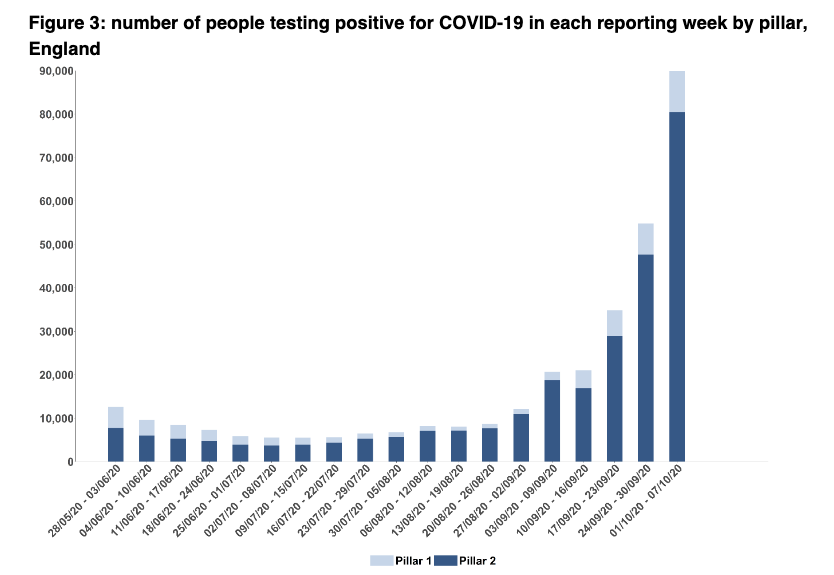
Cases and positivity rates continue to rise - 120,000 cases in the week to 25th Oct.
By comparison. Data from REACT-1 study over the same period suggest 96,000 new community cases/day in England.
By comparison. Data from REACT-1 study over the same period suggest 96,000 new community cases/day in England.

Cases continue to increase among older age groups, alongside evidence of case rates flattening off among children and young adults.


And whilst case rates remain highest in the North of the country, rates elsewhere are starting to catch up. Particularly note significant increases in West Midlands, which hasn't *yet* gone into tier 3
coventrytelegraph.net/news/coventry-…
coventrytelegraph.net/news/coventry-…


A worrying increase in confirmed/suspected COVID outbreaks for care homes in the most recent week, as well as (surprisingly) in workplaces, but not in edu settings. Would be v helpful to have a breakdown of different types of workplace.


And as is now well documented, COVID admissions to hospital and ICU continue to soar (and for flu they remain essentially non-existent).


Although admission are highest in the North and Midlands, they are now rising steeply across the country.


and given the delay between exposure, infection, and admission. Admissions among those over 65 both to hospital and ICU are going to continue to rise steeply over the coming 2-3 weeks. Even if we completely locked down now.


Which leads to - potentially avoidable - rising mortality that is now showing the excess mortality data.


With all this, it is so so important to state again that anything done to restrict viral transmission after case rates and hospital admissions rise is by definition, reactive rather than preventive.
The next four weeks of COVID hospital admissions and deaths are already beyond our reach.
But it's still within our gift to prevent the admissions and deaths of December, Christmas, and into 2021.
But it's still within our gift to prevent the admissions and deaths of December, Christmas, and into 2021.

PHE surveillance rpt, TT to follow @felly500 @deb_cohen @martinmckee @carolecadwalla @mgtmccartney @ADPHUk @Jeanelleuk
@fascinatorfun @profchrisham @petermbenglish @HPIAndyCowper @Davewwest @HSJEditor @KateAlvanley @IndependentSage @nedwards_1
@SamanthaJonesUK @ewanbirney
@fascinatorfun @profchrisham @petermbenglish @HPIAndyCowper @Davewwest @HSJEditor @KateAlvanley @IndependentSage @nedwards_1
@SamanthaJonesUK @ewanbirney
• • •
Missing some Tweet in this thread? You can try to
force a refresh