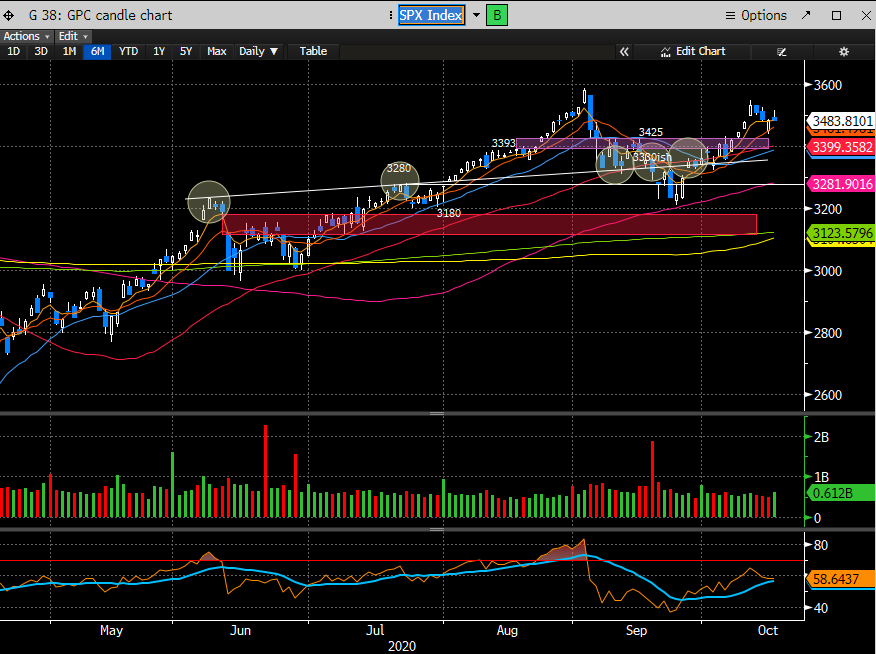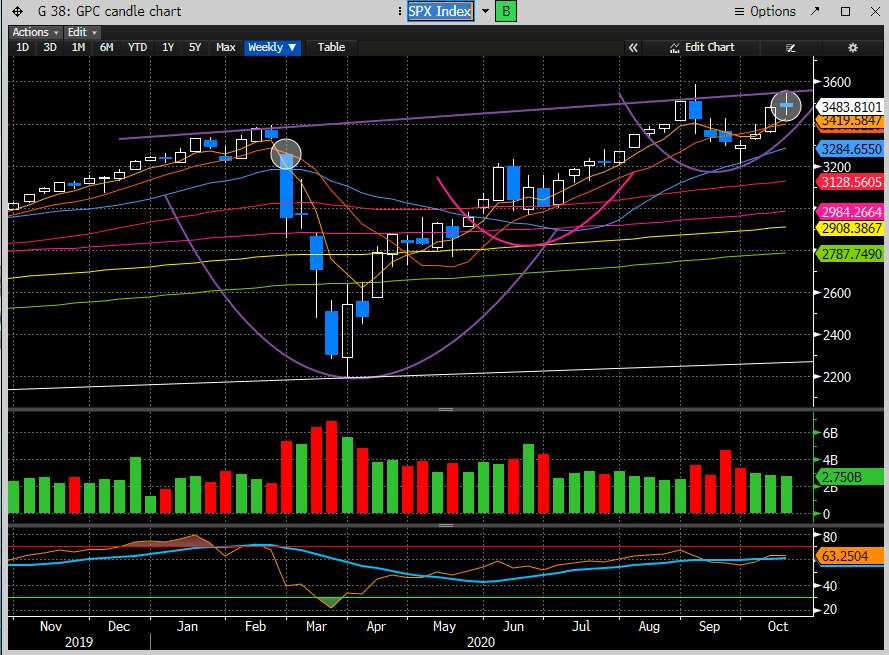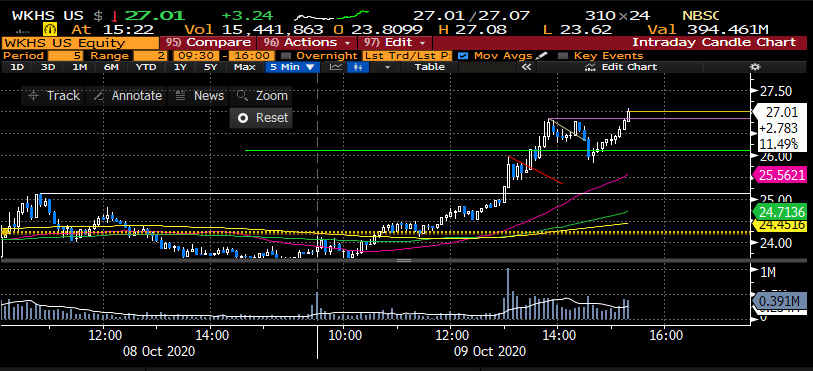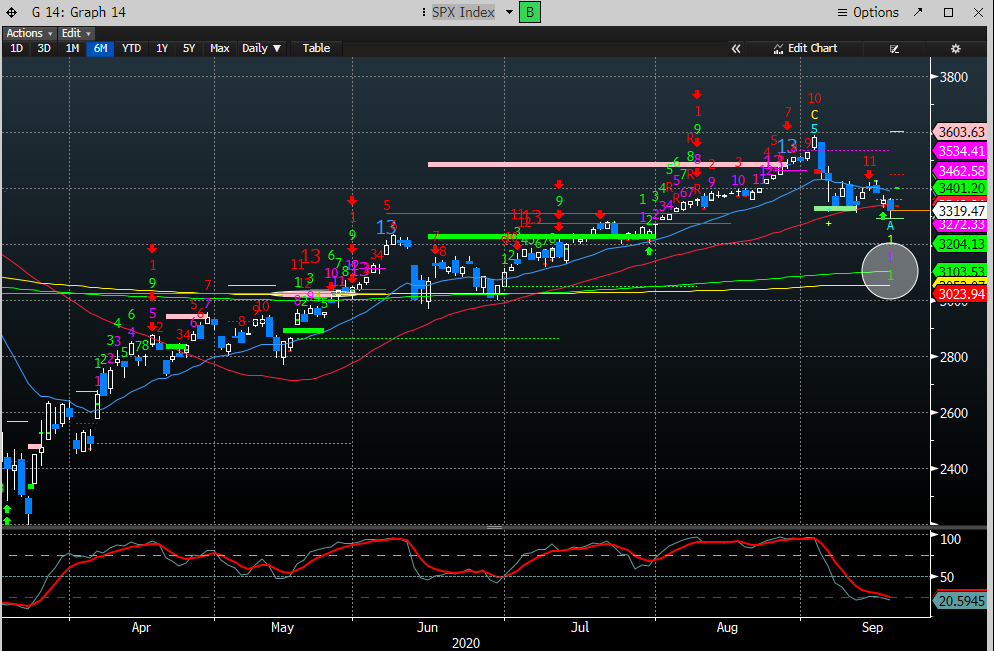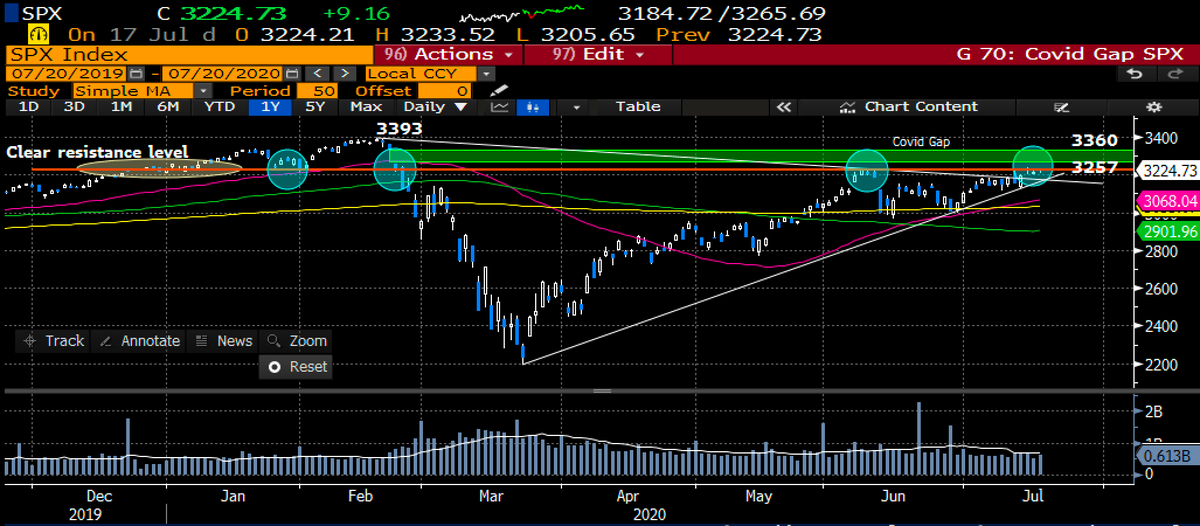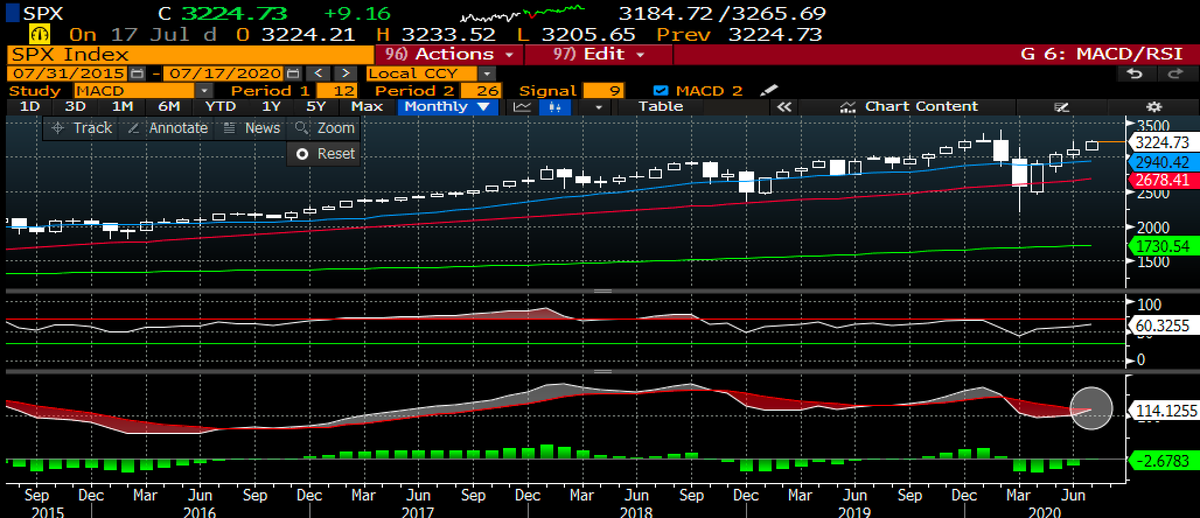
#stockmarket WE Update. Wild week as expected & I expect more fireworks, but are we close to a bottom? #SPX futures bouncing around the 1.5x Demark trendfactor lvl of 3249 (was 3250 when I started this work). day 6 of Demark buy set up.... 

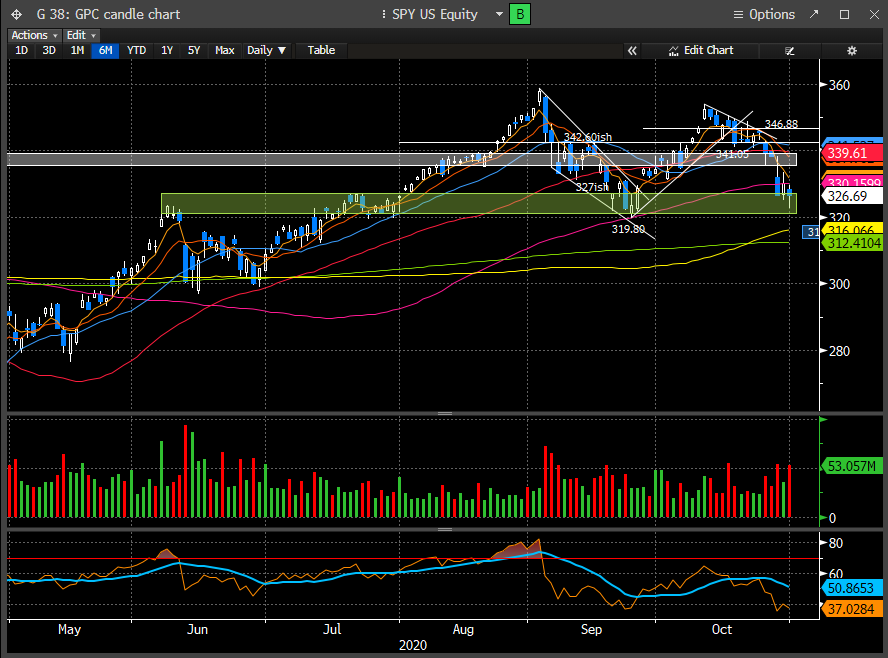
#stockmarket $SPY also bouncing around the 1.5x TF level of 324 & closed above. I said on Friday that I thought we were at a level where the mkt might bounce & it did. Day 5 of Demark buy set up. We are also into the green zone where there is price memory..... 


#stockmarket $QQQ also on count 5 of Demark buy set up & bounced near the 2x TF level around $265. QQQ also approaching the red box where price memory exists.... 


#stockmarket I also posted on Friday that volatility for the #SPX & #NASDAQ printed Demark 13 seq sells last wk. Just to give you an idea of how rare this is, only 2 in last 5 yrs for the VIX & last one was Mar 16th, 5 days before the mkt bottomed.... 


#StockMarket The #DOW is actually the first index to test the 200day but only on day 5 of a buy set up. Similar look on the Valueline index, a chart I posted last wk showing a pot'l asc triangle break but w/ combo 13 sell. Demark won that battle, also on day 5 of buy set up... 


#StockMarket Smart Money Index was a leading indicator of this decline as I pointed out many times was a problem as it kept trending lower vs higher indexes. Broke the lower end of my channel BUT now w/ a cluster of 13's & likely 9 buy this wk. Maybe this will lead us back higher 

#StockMarket McClellan Summation Index overlaid w/ Demarks, hands down the best timing tool I've found, called the turn up in Sept w/ a Demark 13 combo buy, a 9 sell 2 wks ago & now a new 9 buy, but may need to finish the CD to 13 (we'll see)- now day 7 for combo buy.... 

#StockMarket Put/call got quite elevated last wk, and now higher than Jun low. thats bullish as panic is starting to finally show up.... 

#stockmarket Ad/Decline Index printed a 13 combo sell last wk, which nailed the turn down, despite most saying was bullish. It is bullish to make new highs - until it turns down. Too much reactivity on Twitter IMO. now on Day 5 of buy set up & approaching bottom of megaphone... 

#stockmarket HI/LO index approaching trough levels and closing in on Dec 18 and March '20 levels. lots of negativity showing up and thats bullish IMO.... 

#stockmarket DMI is actually a bit worrisome w/ the ADX now crossing the lower bound of neg DMI for both the $SPY & $QQQ. Last time that happened was in Feb '20 and the mkt had a lot further to fall.... 


#stockmarket $SPY $QQQ last 2x before that was in Oct '18, where the mkt still had a long way to fall & in May '19 which proved short lived. Obviously needs to be monitored.... 


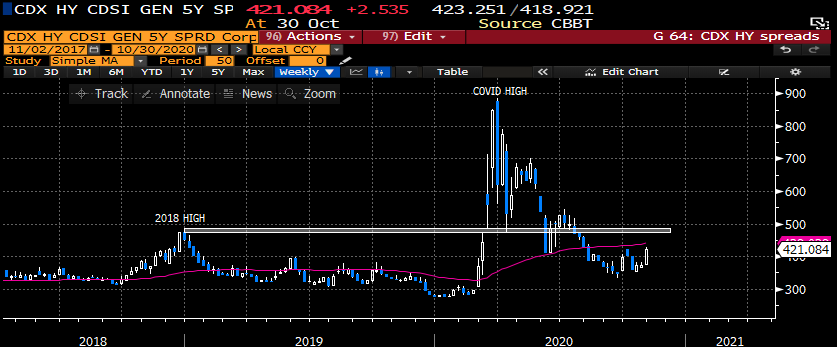
#stockmarket I also posted this chart of HY CDS on Fri to give a snap shot of mkt stress. not seeing much from this picture, still below '18 and way below Covid highs. will be keeping an eye on this for further deterioration which would be quite bearish.... 
#StockMarket $HYG also doesn't appear too stressed & actually closed up on Friday. That said, needs to stay in the white box. Longer term & similar to CDS, above '18 lows and way above Covid lows. breaking below the highlighted levels would certainly get me more bearish..... 


#stockmarket Lastly, I continue to get questions on whether tech has retrenched enough. I will revert to this $QQQ chart I posted in Aug & again in Sept, when I asked, would you buy this chart? I'll ask again, would you buy it now? 

#stockmarket concl: mkt is clearly in a DT, & as I have been preaching since Sept, stay light, stay small, take trades. That hasn't changed. I expect more volatility this wk, but as you can see in the aforementioned, things lining up to bottom very soon IMO. most likely 2h of wk.
@threadreaderapp unroll
• • •
Missing some Tweet in this thread? You can try to
force a refresh


