This is my #Missouri #COVID19 evening update 🧵 for Tuesday, 11/10. My website has been fully updated - slu-opengis.github.io/covid_daily_vi….
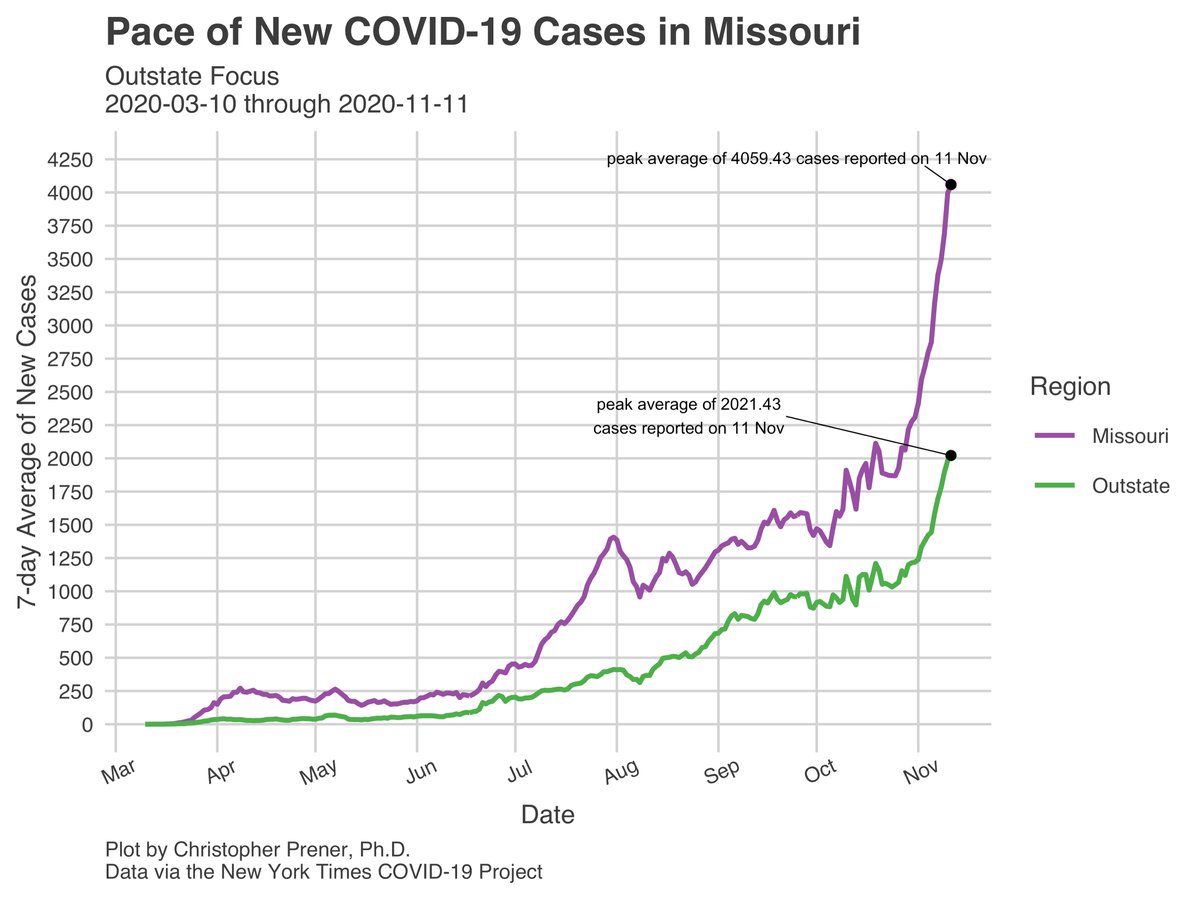
Last Thursday, I asked rhetorically how high our 7-day averages could go. The answer, so far, is we have not found a ceiling yet. 1/20


Last Thursday, I asked rhetorically how high our 7-day averages could go. The answer, so far, is we have not found a ceiling yet. 1/20


We’re adding just shy of 3700 new cases per day on average ☝️, with the highest per capita rates in the “outstate” region. Just a month ago we had never had the 7-day average pass 1700. Now we’re setting all-time highs daily statewide as well as in the “meso” regions. 2/20
At the metro level, #StLouis has surpassed 100,000 cases cumulatively. Our 7-day average was stable at 20 new cases per 100,000 per day on average for much of the fall, and now has tripled to 60 in a relatively short timeframe. Jefferson City’s is nearing 140. 3/20 


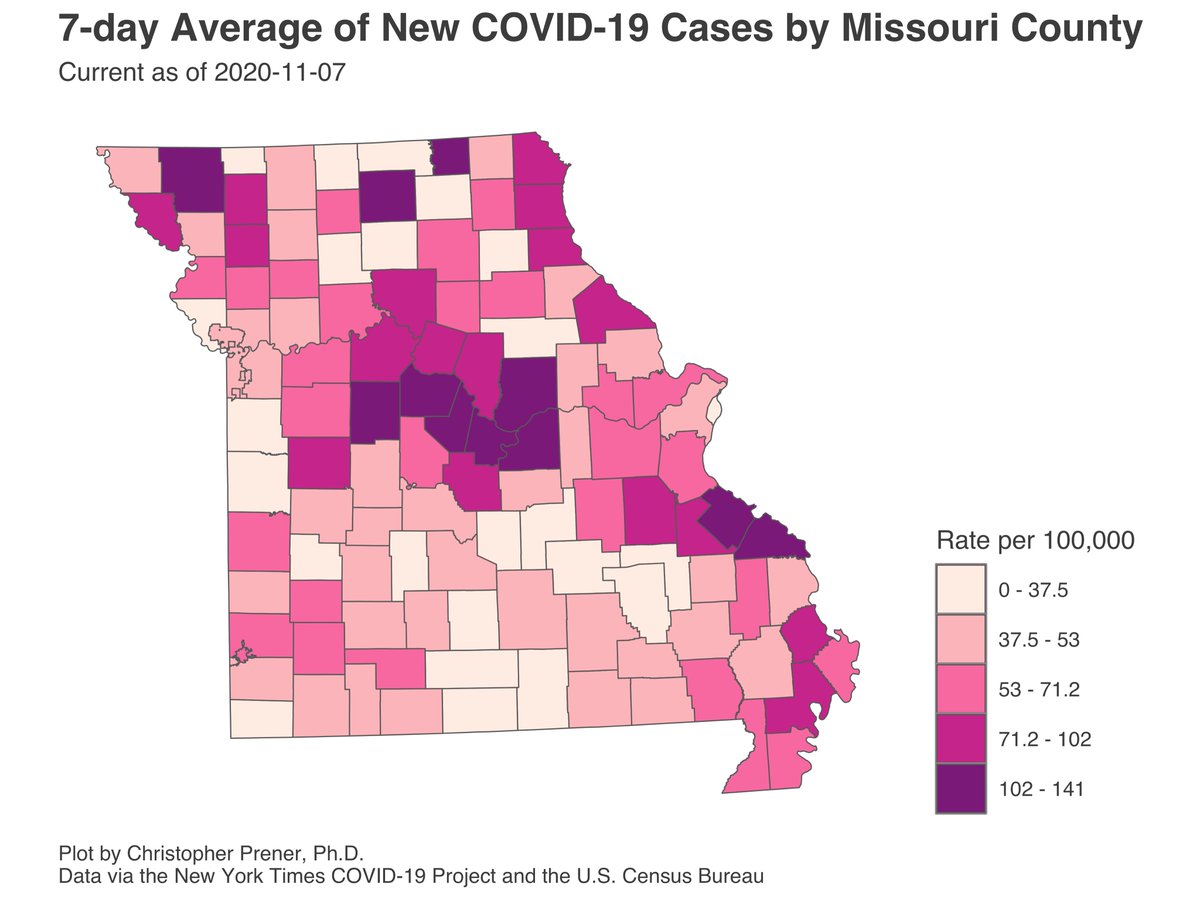
At the county level, Mid-Missouri, portions of the Cape Girardeau and Bootheel regions, and portions of northern MO are all among the most concerning in terms of 7-day averages. 4/20 

In Mid-Missouri, Boone County has seen a real resurgence in new cases. Cole, Callaway, Cooper, Moniteau, and Osage counties also have very high 7-day averages. Around Lake of the Ozarks, rates are a bit lower but have been quite sustained. 5/20 


Around both Joplin and Springfield, we’re also seeing spikes in a wide swath of counties. Greene County is approach its all-time high, and a number of others have either surpassed or are near theirs. 6/20 


In southeast MO, Bollinger and Stoddard counties are the least concerns, largely because they are the only counties not seeing a real spike in their per capita new case rates right now. Otherwise, all-time highs abound. 7/20 


Likewise, in Northern MO, all-time highs in 7-day averages abound. Nodaway, Gentry, DeKalb, Marion, Pike, and Sullivan are all adding cases at a rate near 100 new cases per 100,000 per day on average. 8/20 


In #KansasCity, we’re seeing a continuation of higher rates of new cases in Johnson (KS) and Jackson counties as well as Kansas City itself. Caldwell, Clay, and Lafayette counties are also experiencing high 7-day averages right now. 9/20 


Clinton County’s mortality spike continues to closely track earlier patterns we saw at the beginning of the outbreak in Johnson (KS) and Wyandotte counties. They’ve now had over 30 deaths - we’ll see if they’re still at 0 nursing home deaths after those data update Thurs. 10/20 


In #StLouis, every single county I track closely is seeing their 7-day averages go up, in some cases incredibly quickly (i.e. Jersey County). The City itself continues to have the lowest rate of new cases per capita regionally, the daily new counts are over 100 now. 11/20 


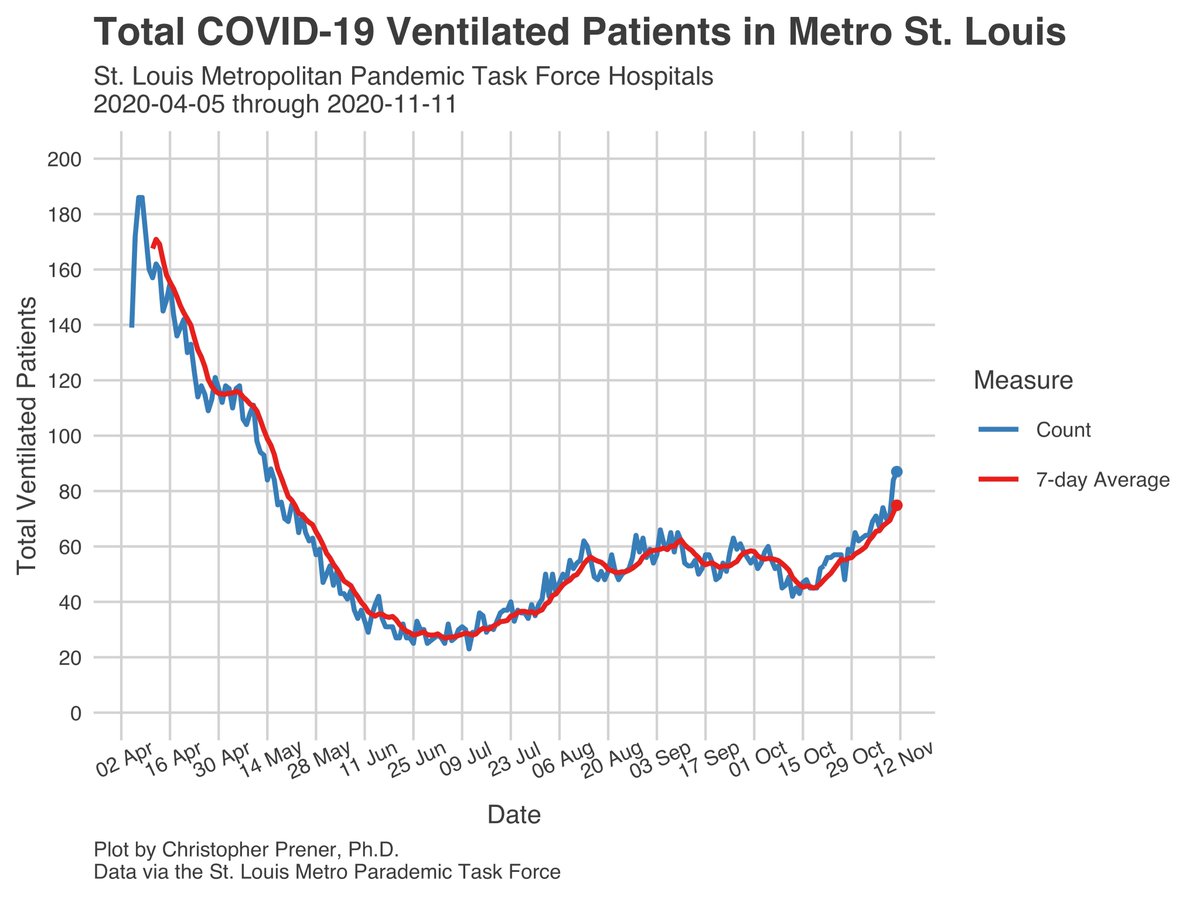
Hospitalization numbers in #StLouis are getting more troubling by the day, with all-time highs in the new and total in-patient metrics and climbing ICU numbers, too. I feel like a broken record at this point, but these numbers are not sustainable for our health care system. 12/20 


Statewide, mortality patterns are experiencing a bit of a drop off in reported deaths. This is being mirrored in all three metro areas where I track 7-day averages right now. This will change tomorrow, though, when the dump of new deaths today is reflected in my data. 13/20 


One outstanding interest of mine has been to dig into mortality data, and I’m excited to launch two new products this week. First, a comparison of reported vs. actual mortality. We know that delays in the state reporting deaths can stretch to months, and I’ve wondered… 14/20
… about just how much this distorts our patterns here. Reported deaths appear, so far, to be rough approximations of actual deaths, though that has weakened since Sept. For the statistically minded, the Pearson’s r value here is .753 - a moderately strong relationship. 15/20 

Another outstanding interest is how our COVID mortality compares to normal, something we call “excess death.” My @SLUResearch colleague @TimothyWiemken has put together two visualizations of (provisional) excess mortality, one for MO and one for the US as a whole. 16/20 


Both forecast what we would expect mortality to be this year, and then show (with the red line) where we are from March onward. Each analysis points to excess mortality above and beyond what the forecast suggests based on past mortality patterns. 17/20 slu-opengis.github.io/covid_daily_vi…
The excess mortality data, and the clear recent September/October spike in the mortality comparison plot, both point to how serious COVID is. The new case rates and hospitalizations point to how much worse these mortality trends could become. 18/20
My standard caveats about uncertainty - infections (1) are historical data that reflect infections 2-3 weeks ago, (2) are biased by testing patterns, (3) may include probable but unconfirmed cases in some counties, and (4) rates are not individual probabilities of illness. 19/20
Additional maps and plots are on my tracking site - slu-opengis.github.io/covid_daily_vi….
Next 🧵 will *likely* be Thursday, 11/12.
20/20
Next 🧵 will *likely* be Thursday, 11/12.
20/20
• • •
Missing some Tweet in this thread? You can try to
force a refresh


