This is my #Missouri #COVID19 evening update 🧵 for Thursday, 11/12. My website has been fully updated - slu-opengis.github.io/covid_daily_vi….

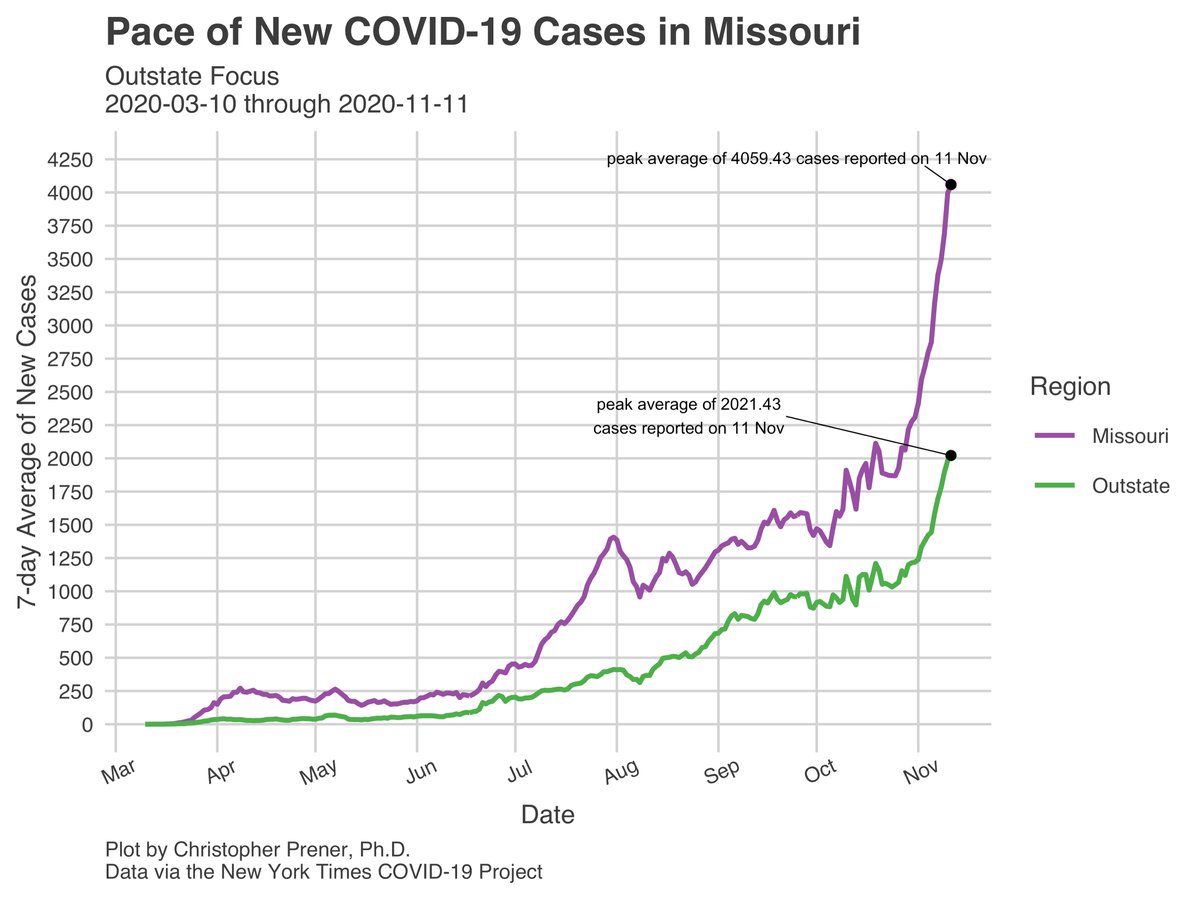
Our 7-day averages continue to climb - now 4059 new cases per day on average statewide, with all-time highs again in #KansasCity and “outstate.” 1/18
The #StLouis Metro (including IL counties) added ~1969 cases per day on average over the past week - far and away the highest volume of cases we’ve seen here. #KansasCity is also adding more than 1000 cases per day on average. 2/18
Remember, though, that these numbers don’t directly compare to the time series in March/April/May because of poor testing access. They are far more comparable to August/September, when cases were far fewer in number. 3/18
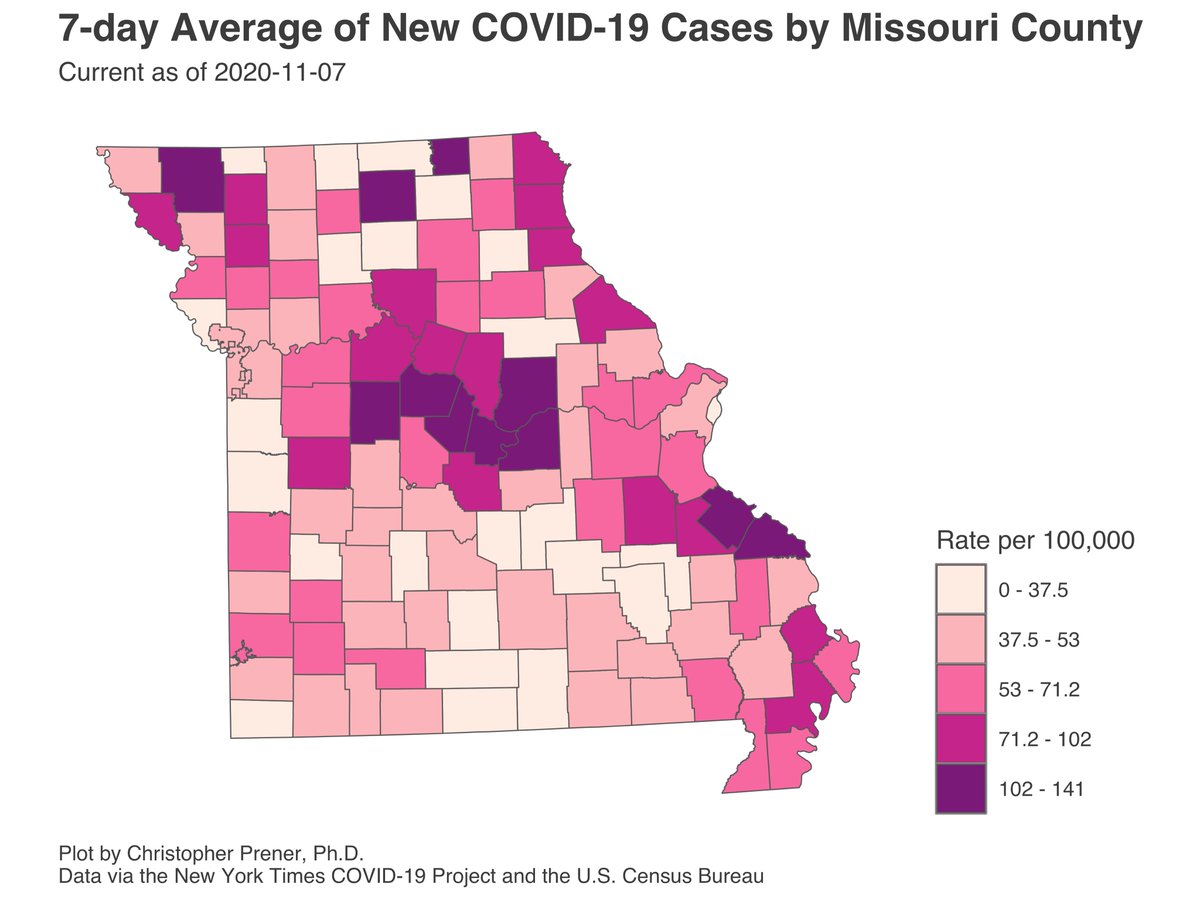
Regionally, I continue to be worried about SE MO and the Bootheel, Mid-MO, and a swath of counties across Northern MO. One caveat here - the color ranges assigned to each category change daily, and we’ve seen a huge shift upwards in many counties. 4/18
In Mid-Missouri, the counties whose 7-day averages I’m concerned by remain the same: Boone, Cole, Callaway, Cooper, Moniteau, and Osage counties. Around Lake of the Ozarks, rates of new cases are generally lower but still around 60 per 100k per day on average. 5/18
Around both Joplin and Springfield, the 7-day averages are generally lower than Mid-MO and are more similar to the rates we’re seeing around Lake of the Ozarks - 40 to 60 per 100k per day on average. 6/18
In southeast MO, Ste. Genevieve, Perry, Washington, and Cape Girardeau counties are the top concerns, with rates of new cases between 120 and 150 per 100k per day on average. Counties in the Bootheel have generally lower rates, though New Madrid stands out at 100. 7/18
Likewise, in Northern MO, all-time highs are continuing on a daily basis. Nodaway, Gentry, Marion, Monroe, Pike, and Sullivan are all adding cases at a rates of at least 100 new cases per 100k people per day on average. 8/18
In #KansasCity, a growing number of counties are adding new cases of around 60 new cases per 100k people per day on average. Juts a few weeks ago these rates were largely around 20 new cases per 100k per day. 9/18
Clinton County's mortality spike has subsided for the moment. I had been waiting for nursing home data to update today to see if there was a “hidden” nursing home outbreak driving these deaths - there is not - just 1 LTC death so far. I’m curious about what’s going on there. 10/
In #StLouis, every single county I track closely is seeing their 7-day averages continue to go up. Much like #KansasCity, the rates in the City and the County had been far lower just a few weeks ago. And check out Jersey, Clinton, and Bond counties in Metro East. 11/18
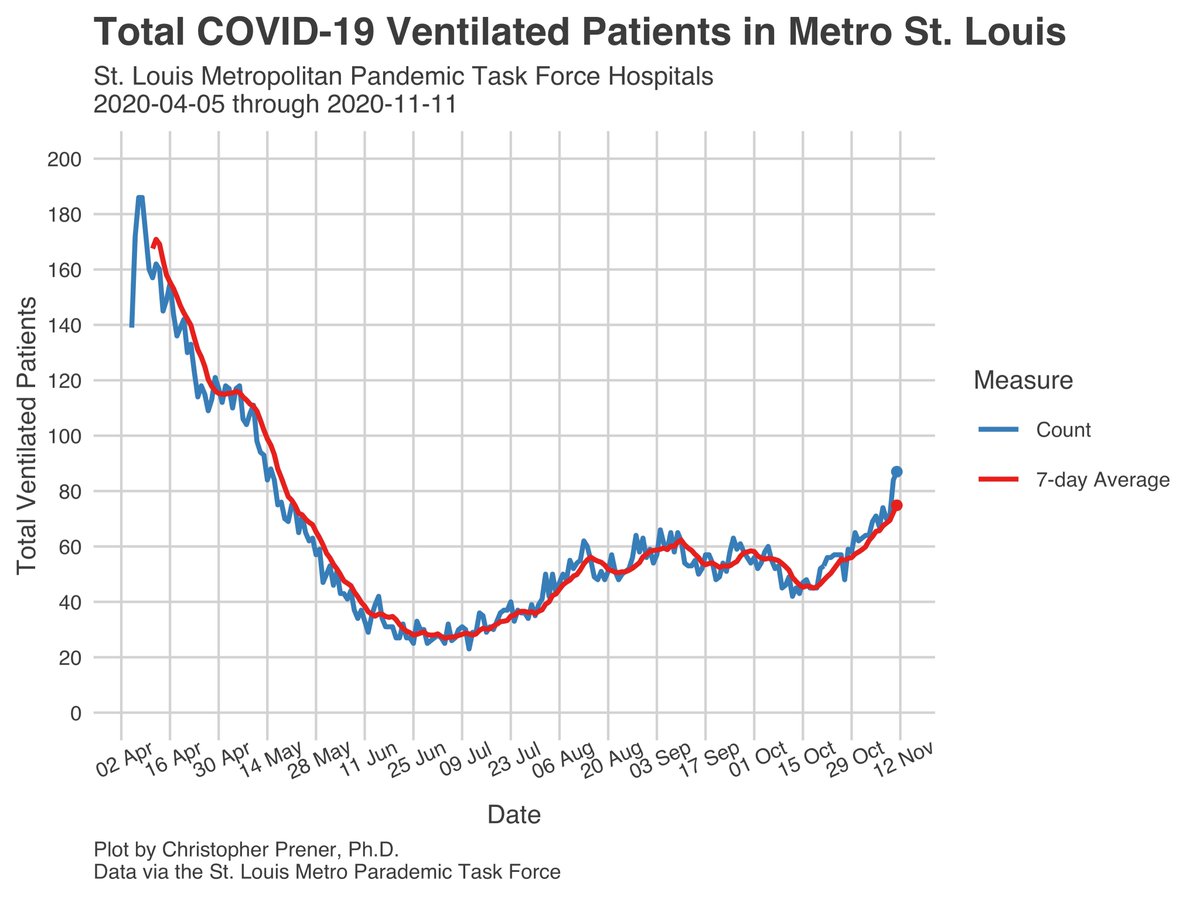
Hospitalization numbers in #StLouis are continuing to deteriorate. Now we’re seeing sustained increases to the 7-day averages in our ICU and ventilation measures. Remember that mortality increases may well lag this increase by a week or so. 12/18
ZIP maps should see 14-day averages for Metro East and Warren County tomorrow. I’m still waiting on Lincoln County to update their dashboard. Also should start updating static maps and plots again soon (perhaps next week). 13/18
Statewide, mortality patterns remain largely unchanged - hanging around 30 new deaths reported per day, with about 10 each in the #StLouis and #KansasCity metros (which include IL and KS respectively).

Also, FYI, the nursing home data have been fully updated today!

14/18
The next edition of my River City Data newsletter drops tomorrow. My interview is with @EmmaCrockerDNP about nursing, health care, and COVID-19 disparities. Sign-up to receive it here - chrisprener.substack.com/p/coming-soon 15/18
I’m also working on a special edition of River City Data with @TimothyWiemken focused on what we know about school transmission, given the Governor’s announcement today. That will be out early next week! 16/18
My standard caveats about uncertainty - infections (1) are historical data that reflect infections 2-3 weeks ago, (2) are biased by testing patterns, (3) may include probable but unconfirmed cases in some counties, and (4) rates are not individual probabilities of illness. 17/18
Additional maps and plots are on my tracking site - slu-opengis.github.io/covid_daily_vi….

Next 🧵 will be Tuesday, 11/17. 18/18
UPDATE: per @alexiszotos, these are the updated restrictions being put in place in the county (and presumably the city): 19/18

• • •

Missing some Tweet in this thread? You can try to force a refresh
 

Keep Current with Chris Prener

Chris Prener Profile picture

Stay in touch and get notified when new unrolls are available from this author!

Read all threads

This Thread may be Removed Anytime!

PDF

Twitter may remove this content at anytime! Save it as PDF for later use!

Try unrolling a thread yourself!

how to unroll video
  1. Follow @ThreadReaderApp to mention us!

  2. From a Twitter thread mention us with a keyword "unroll"
@threadreaderapp unroll

Practice here first or read more on our help page!

More from @chrisprener

12 Nov
Lots of speculation about the Governor’s announcement this morning. I’ve been lamenting with @TimothyWiemken this AM about (a) how predictable pressures on schools were in May, yet we didn’t plan, and (b) the lack of different policies for elementary vs high school to this point.
And @hrenoID is totally on point with her observation about evidence based policy 👇.
For example, some of what we're getting today may be driven by this letter from a group of superintendents calling themselves the "Rural Activists of Northwest Missouri," who are asking for quarantines to be dropped to 5-7 days. (h/t @blythebernhard) kq2.com/content/news/N…
Read 4 tweets
12 Nov
My #Missouri #COVID19 tracking site has been fully updated for Wednesday, 11/11 - slu-opengis.github.io/covid_daily_vi….

On Monday, we were averaging 3500 new cases statewide. Tonight, that metric is just under 4000. It has doubled in just a few weeks, and hit all-time highs again today. 1/4 ImageImageImageImage
I want to highlight the increasing hospitalization trends in #StLouis today as well. The rate at which the 7-day average trends for new in-patients and total in-patients are growing is deeply, deeply worrying. 2/4 ImageImageImageImage
Tonight's @StLouisCovid memorial is a bit different - given that it is Veterans Day, I want to take tonight to acknowledge the St. Louis area veterans who served, some in war zones, only to die from COVID-19 here at home. 3/4 stlouiscovidmemorial.com/covid-19-veter…
Read 4 tweets
11 Nov
This is my #Missouri #COVID19 evening update 🧵 for Tuesday, 11/10. My website has been fully updated - slu-opengis.github.io/covid_daily_vi….

Last Thursday, I asked rhetorically how high our 7-day averages could go. The answer, so far, is we have not found a ceiling yet. 1/20 ImageImageImageImage
We’re adding just shy of 3700 new cases per day on average ☝️, with the highest per capita rates in the “outstate” region. Just a month ago we had never had the 7-day average pass 1700. Now we’re setting all-time highs daily statewide as well as in the “meso” regions. 2/20
At the metro level, #StLouis has surpassed 100,000 cases cumulatively. Our 7-day average was stable at 20 new cases per 100,000 per day on average for much of the fall, and now has tripled to 60 in a relatively short timeframe. Jefferson City’s is nearing 140. 3/20 ImageImageImageImage
Read 20 tweets
9 Nov
Three thoughts.

First, take a look at hospitalizations right now in the #StLouis area. We're back to roughly where things stood in April in terms of total numbers of in-patients, and we're adding new patients at a faster pace than at any point prior during the pandemic. 1/6
Second, the irony here is that there are areas of MO - especially Mid-Missouri's two metros (Columbia and Jefferson City) - that have far, far higher rates of new cases. 2/6
Even within the #StLouis metro, Franklin, Jefferson, and St. Charles counties all have per capita 7-day averages of new cases that are similar or exceed what the County is experiencing right now. This is why we need *statewide* and *regional* interventions. 3/6
Read 6 tweets
8 Nov
My #Missouri #COVID19 tracking site has been fully updated for Saturday, 11/7 - slu-opengis.github.io/covid_daily_vi….

It feels like we’ve hit a tipping point now - we’re now adding over 3000 cases per day, on average, statewide. Our regional averages are each at all-time highs. 1/6 ImageImageImageImage
We don’t know how exactly how this compares to the spring ☝️, because testing limits affected our ability to identify cases. But take a look at our hospitalizations in #StLouis if you want a sense of how bad things are right now 👇. We. Must. Act. Decisively. Now. 2/6 ImageImage
I’ve made another round of updates to the ZIP code maps for #StLouis to include Lincoln County on both the case and 14-day average maps. Warren County and Metro East will be added to the 14-day avg. maps next Friday. Lincoln County will follow later. 3/6 slu-opengis.github.io/covid_daily_vi… ImageImage
Read 7 tweets
7 Nov
My #Missouri #COVID19 tracking site has been fully updated for Friday, 11/6 - slu-opengis.github.io/covid_daily_vi….

Our 7-day averages continue to climb to all-time highs statewide and in all three regions; all of our alarm bells should be ringing loudly right now. 1/5 ImageImageImageImage
I now have significantly expanded ZIP code mapping for the St. Louis area. Lincoln and Franklin counties are the only metro counties missing, but will be added soon! I should have 14-day averages for Metro East and Warren County next Friday. 2/5 slu-opengis.github.io/covid_daily_vi… Image
I’ve also published the latest edition of “River City Data” this evening. It has an update on plans for new data products, an overview of where we're at with COVID, some thoughts on political polling, and my interview with @stltoday's @michelemunz. 3/5 chrisprener.substack.com/p/weekly-covid…
Read 5 tweets

Did Thread Reader help you today?

Support us! We are indie developers!


This site is made by just two indie developers on a laptop doing marketing, support and development! Read more about the story.

Become a Premium Member ($3/month or $30/year) and get exclusive features!

Become Premium

Too expensive? Make a small donation by buying us coffee ($5) or help with server cost ($10)

Donate via Paypal Become our Patreon

Thank you for your support!

Follow Us on Twitter!