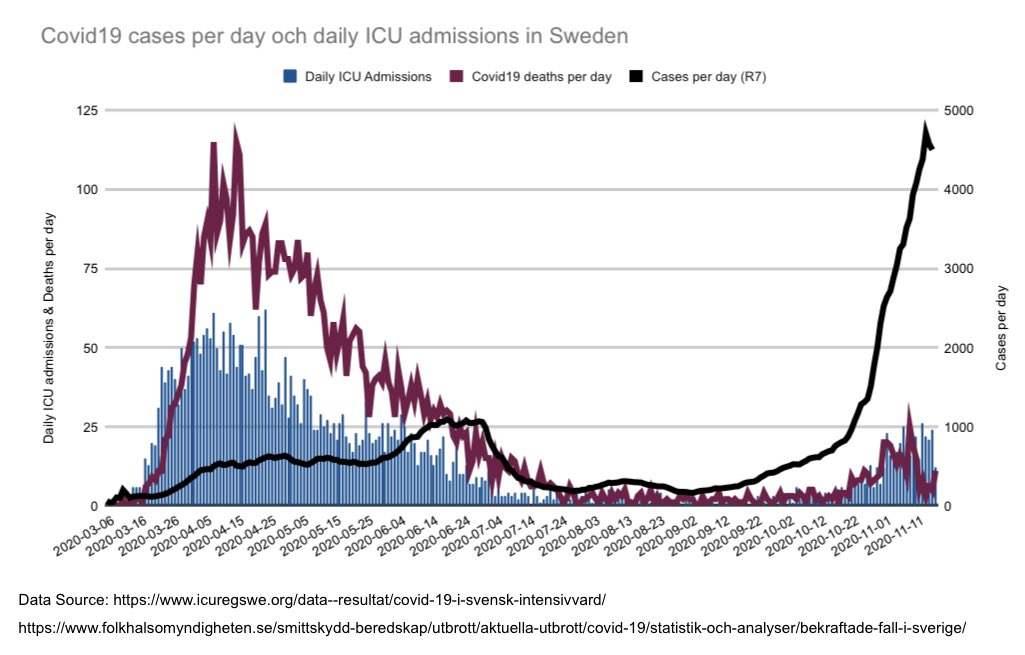
1/21 🇸🇪 I’ve been looking at cases and ICU admissions lately. In this graphaton 🧵 I’ll present the figures for each region including date of local recommendations - in titel - if there are any.
Stockholm
Stockholm

2/21 Örebro

3/21 Västernorrland

4/21 Värmland

5/21 Uppsala

6/21 Norrbotten

7/21 Kalmar

8/21 Jämtland

9/21 Gävleborg

10/21 Dalarna

11/21 Östergötland

12/21 Västmanland

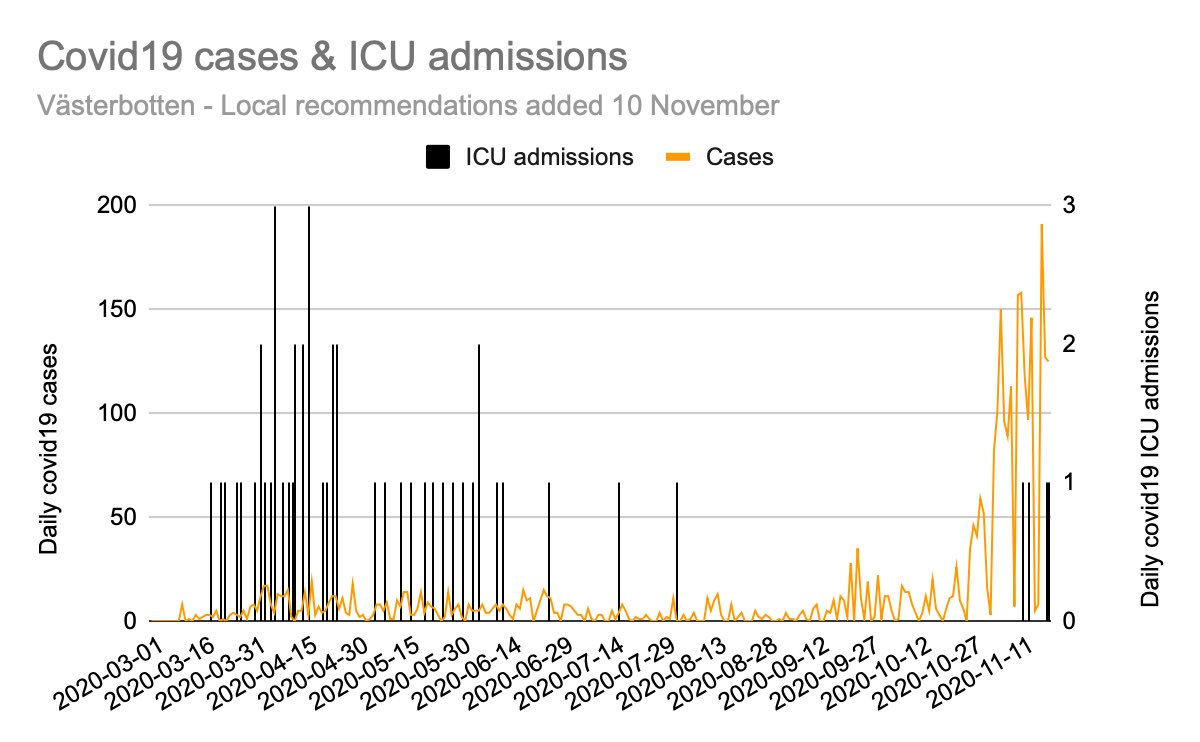
13/21 Västerbotten
14/21 Västra Götaland

15/21 Sörmland

16/21 Skåne

17/21 Kronoberg

18/21 Jönköping

19/21 Halland

20/21 Gotland

21/21 Blekinge
DM if anything looks odd or I missed something.
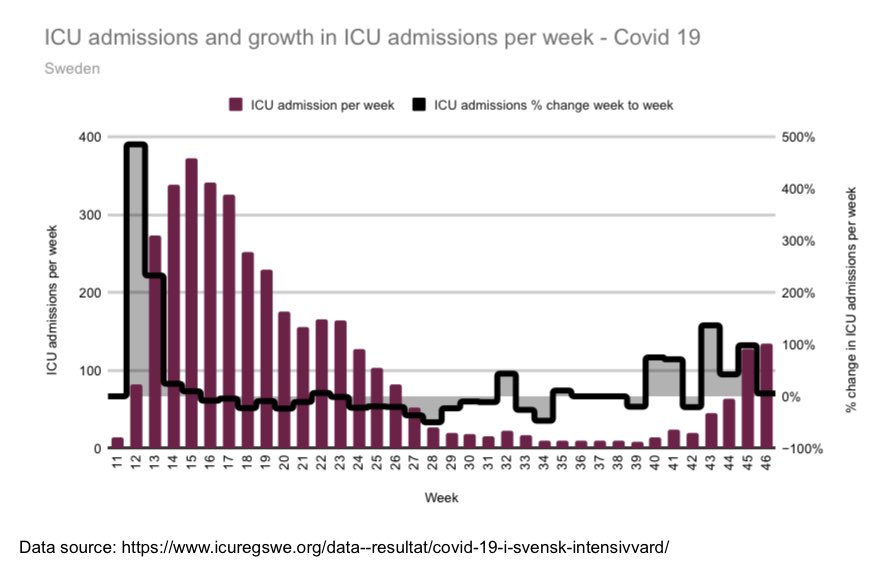
Remember, hospitalisations are high but am focusing on ICU since those are the most severe cases.
#COVID19sverige
DM if anything looks odd or I missed something.
Remember, hospitalisations are high but am focusing on ICU since those are the most severe cases.
#COVID19sverige

• • •
Missing some Tweet in this thread? You can try to
force a refresh