Memphis/Shelby County
Mid-Wk Covid Report
tl;dr
* it's bad, y'all, and getting worse
* but they say it's darkest before the sun rises
* and we have a once in a lifetime opportunity to save literally thousands of lives, just here in Memphis
* read for details
1/
Mid-Wk Covid Report
tl;dr
* it's bad, y'all, and getting worse
* but they say it's darkest before the sun rises
* and we have a once in a lifetime opportunity to save literally thousands of lives, just here in Memphis
* read for details
1/

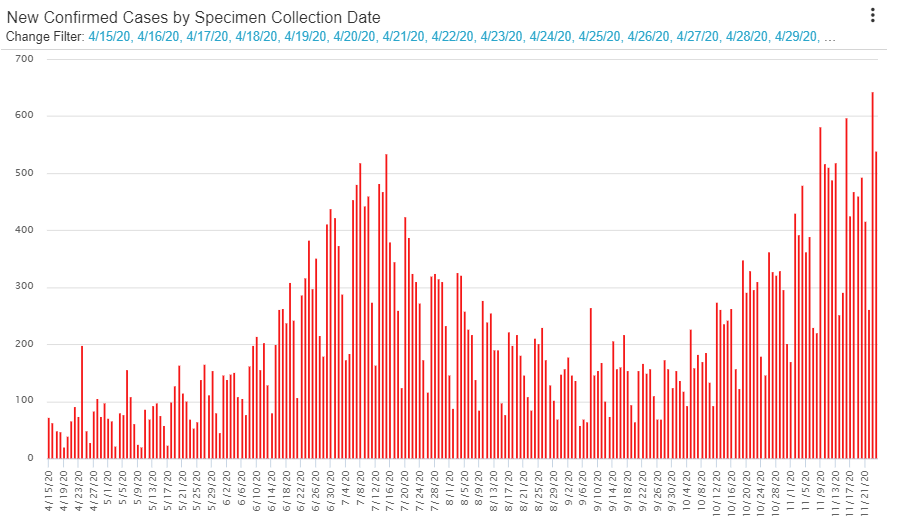
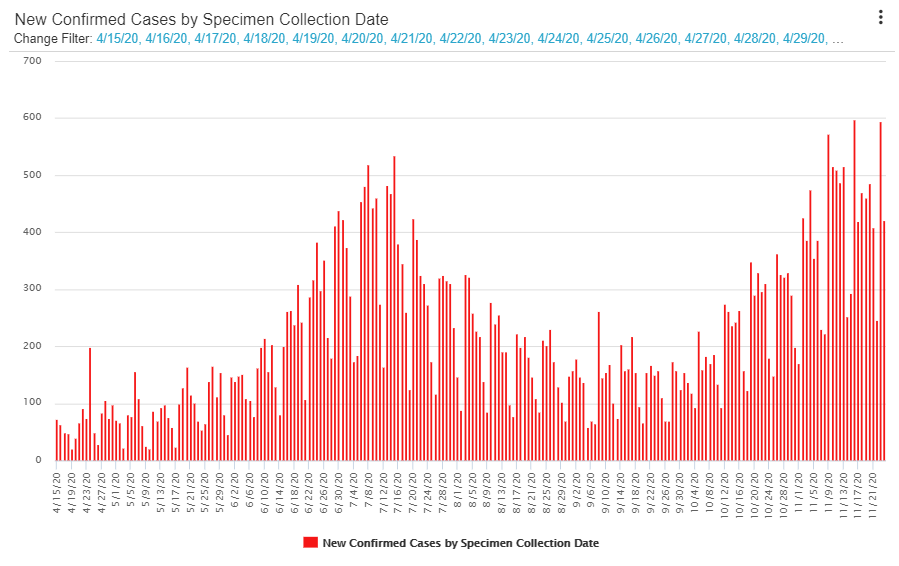
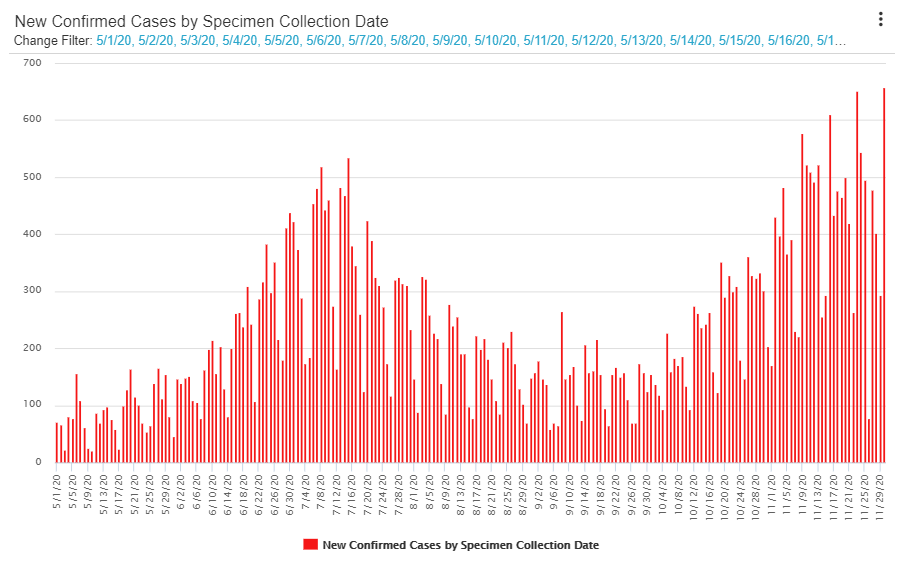
Let's start w/new cases by test date. There's a built-in lag here, so it only goes through Nov30.
But as you can see, the 4 days with the highest number of new cases were the past 4 Mondays, at 577, 610, 651, & 657. (And bc of reporting delays, that number is still rising.)
2/
But as you can see, the 4 days with the highest number of new cases were the past 4 Mondays, at 577, 610, 651, & 657. (And bc of reporting delays, that number is still rising.)
2/
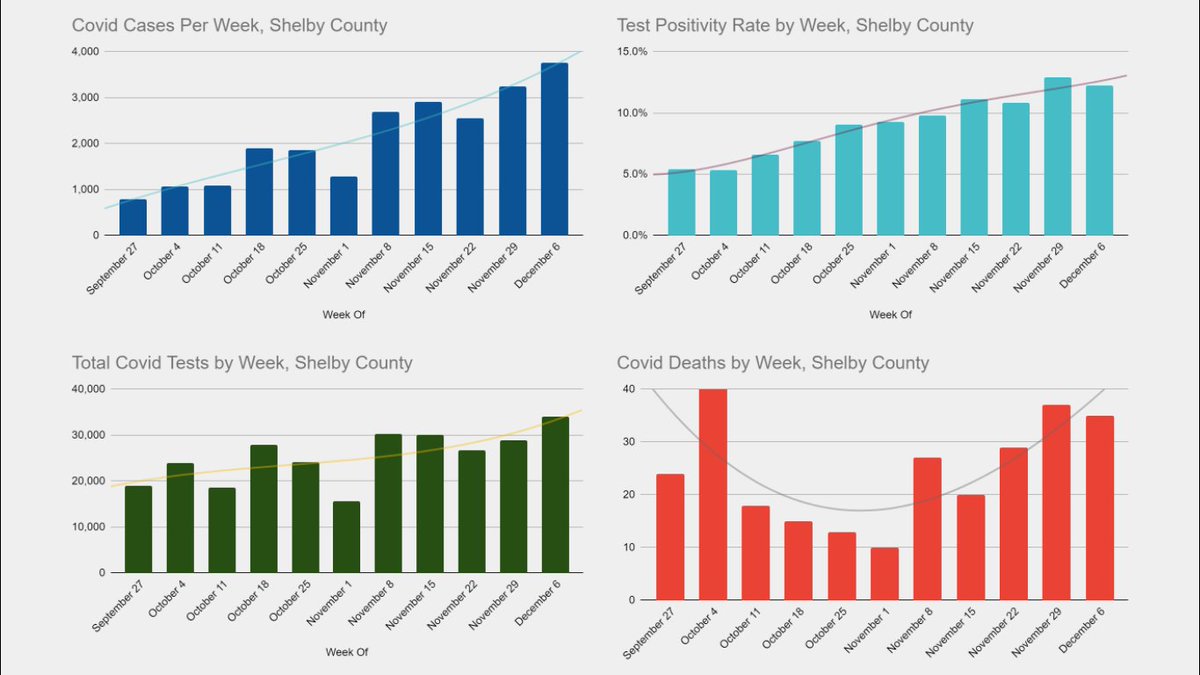
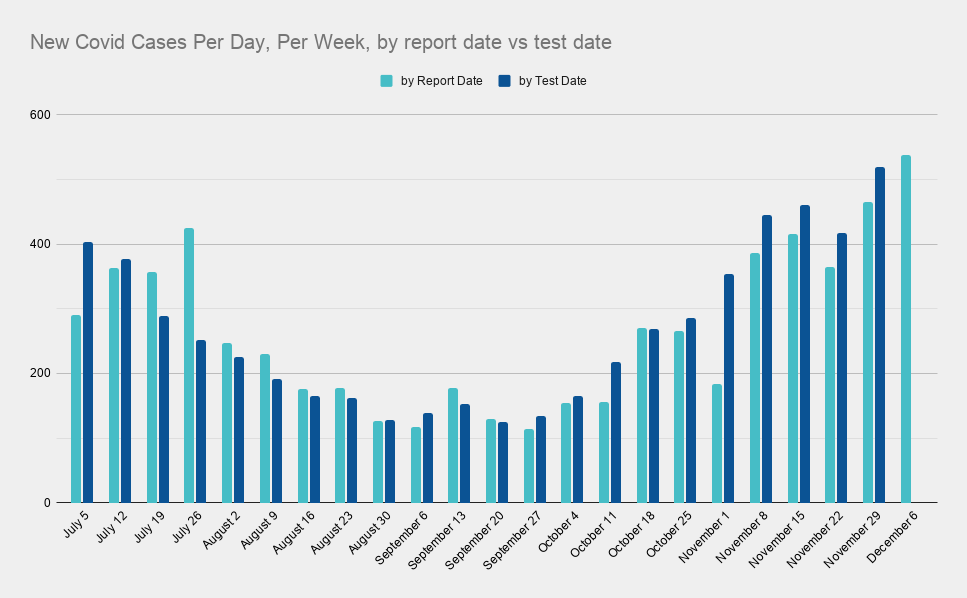
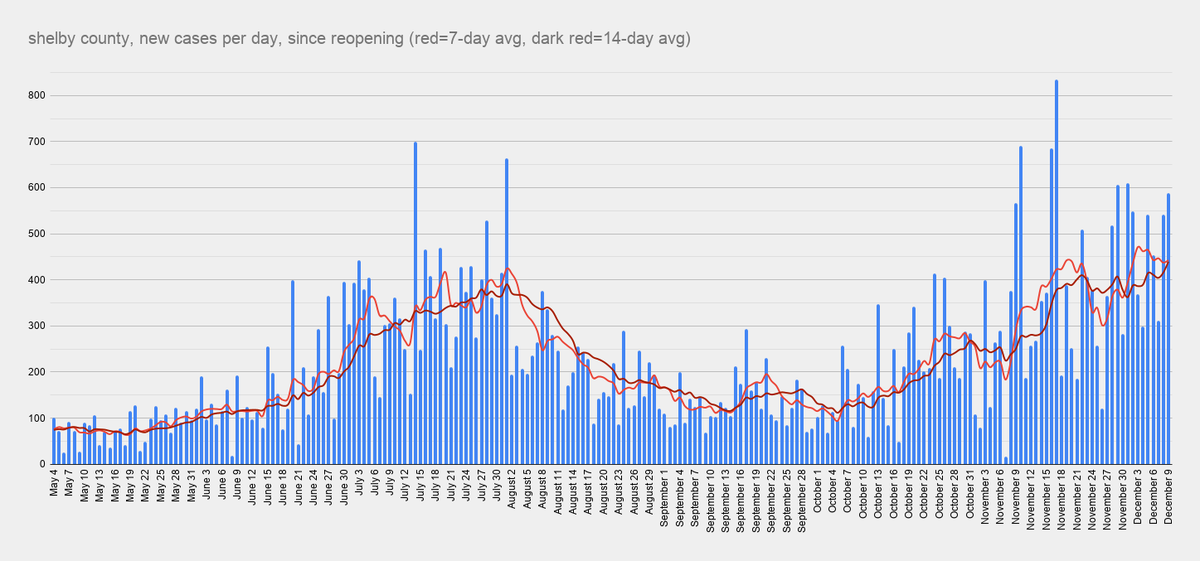
Here are cases by report date.
We've avg'd over 435 cases/day for 8 days now. That's the 1st, 2nd, 3rd, 4th, 5th, 6th, 9th, & 10th highest avg's on record. All in Dec.
The 7th, 8th, 11th, 13th, 14th, & 15th highest were all in Nov.
The 12th was in Aug, the 15th in July.
3/
We've avg'd over 435 cases/day for 8 days now. That's the 1st, 2nd, 3rd, 4th, 5th, 6th, 9th, & 10th highest avg's on record. All in Dec.
The 7th, 8th, 11th, 13th, 14th, & 15th highest were all in Nov.
The 12th was in Aug, the 15th in July.
3/
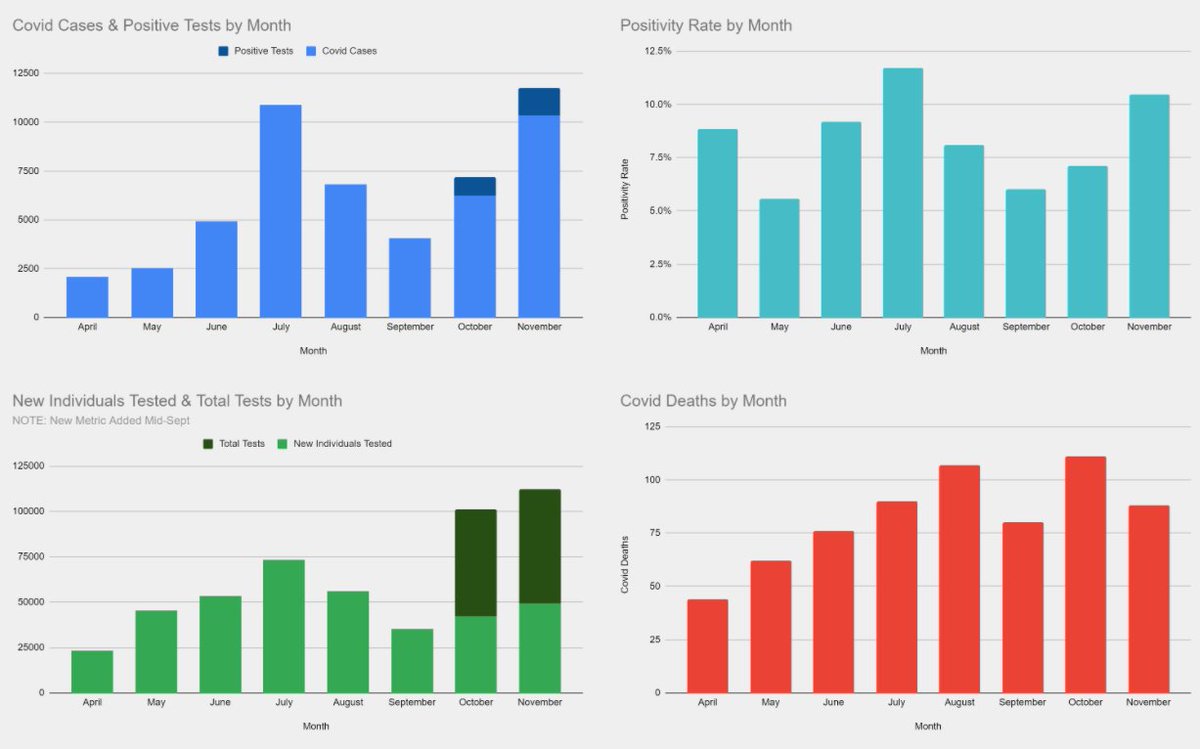
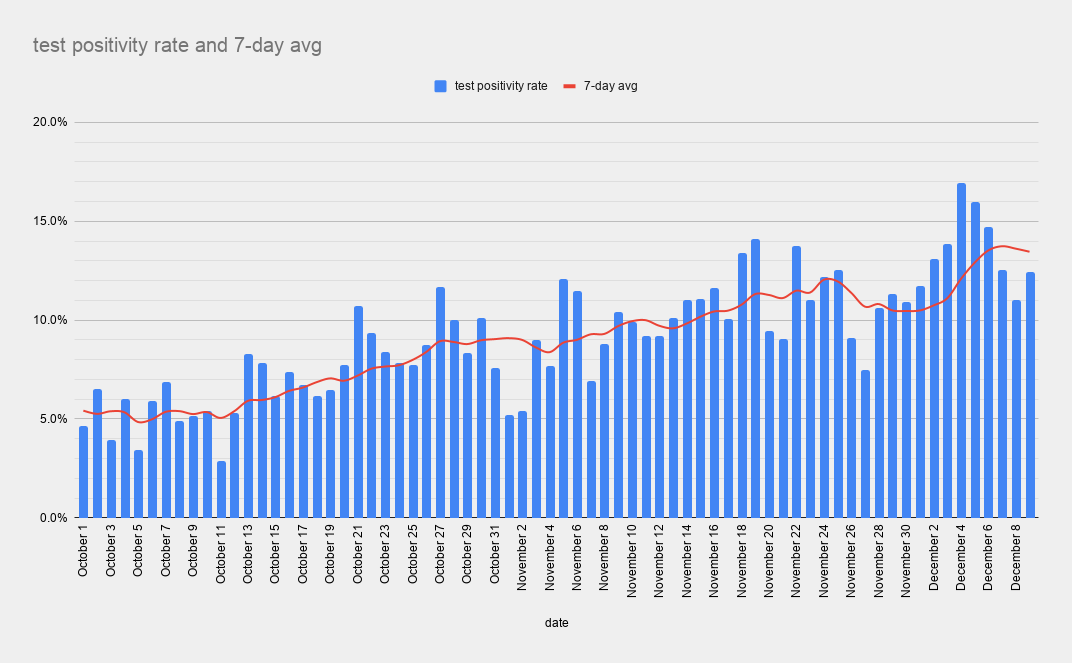
And here's the test positivity rate.
We've avg'd over 13.5%+ for 4 straight days now. Before this wk, we'd never topped 13%.
This says we're not testing enough. We're avg'ing 3,700 tests per day. We need to be doing at least 10,000. Or almost 3x more.
4/
We've avg'd over 13.5%+ for 4 straight days now. Before this wk, we'd never topped 13%.
This says we're not testing enough. We're avg'ing 3,700 tests per day. We need to be doing at least 10,000. Or almost 3x more.
4/
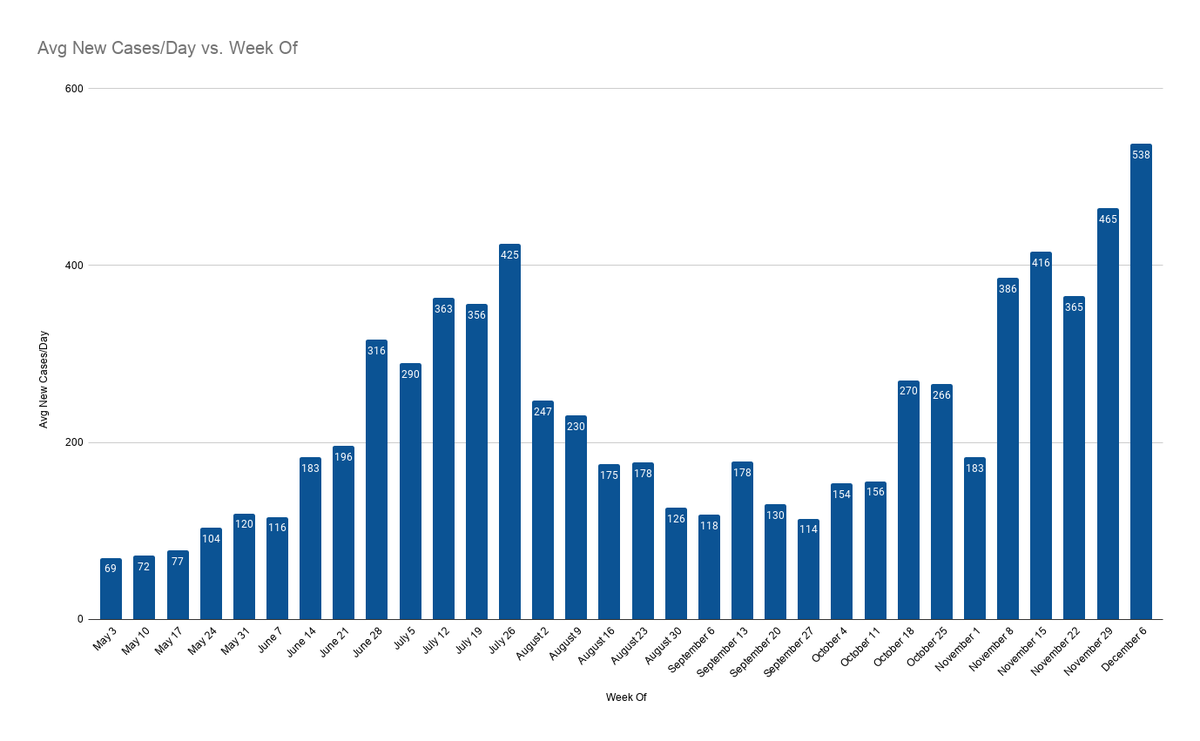
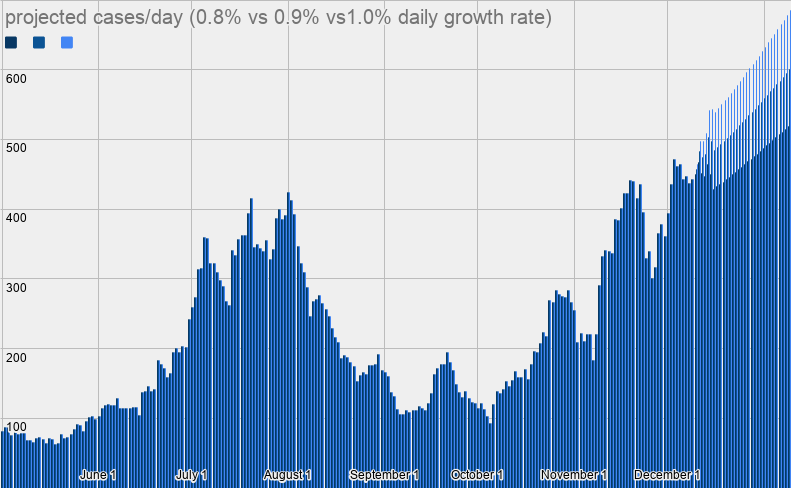
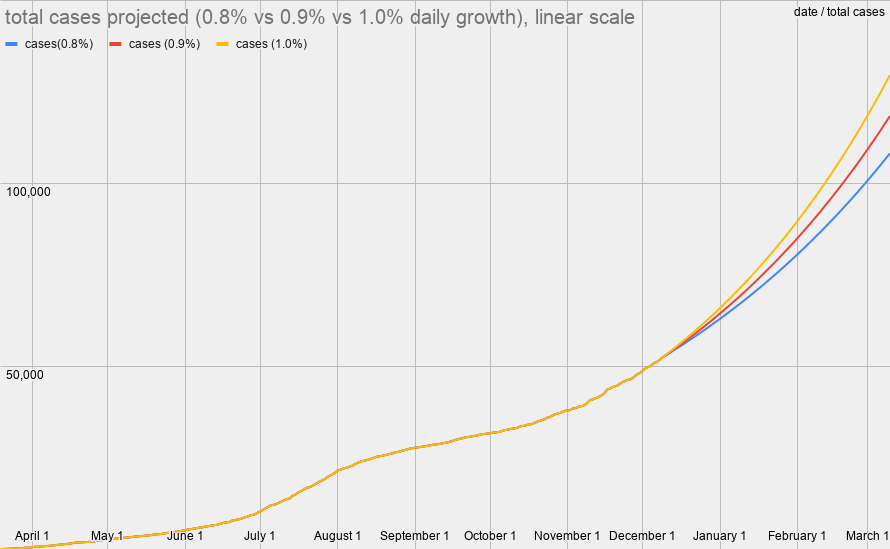
Here's where we're headed. We're currently avg'ing 1% daily growth in cases, which is the highest projection here.
That would put us at 633 new cases per day by Jan1. That would be a 43% increase over the next 3wks.
Testing is only growing by 0.6% per day, by the way.
5/
That would put us at 633 new cases per day by Jan1. That would be a 43% increase over the next 3wks.
Testing is only growing by 0.6% per day, by the way.
5/
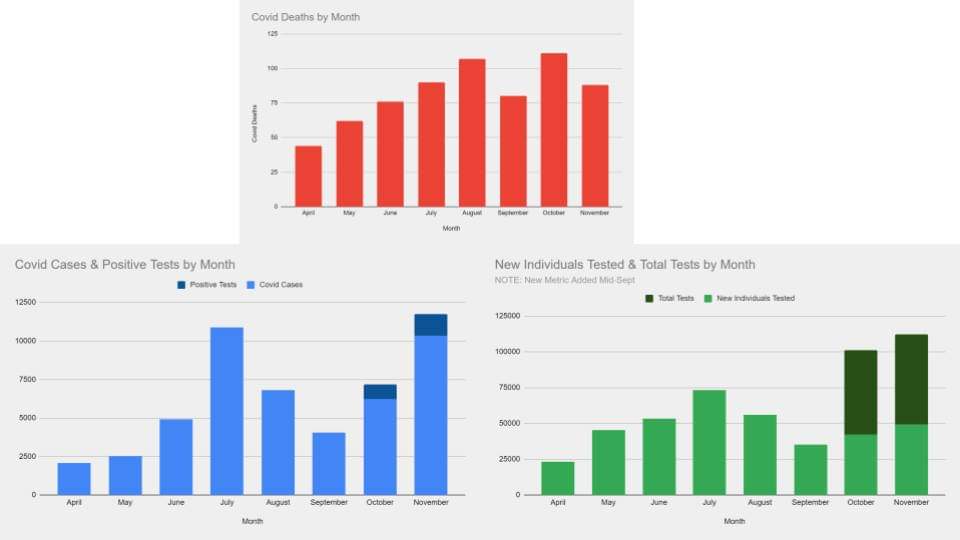
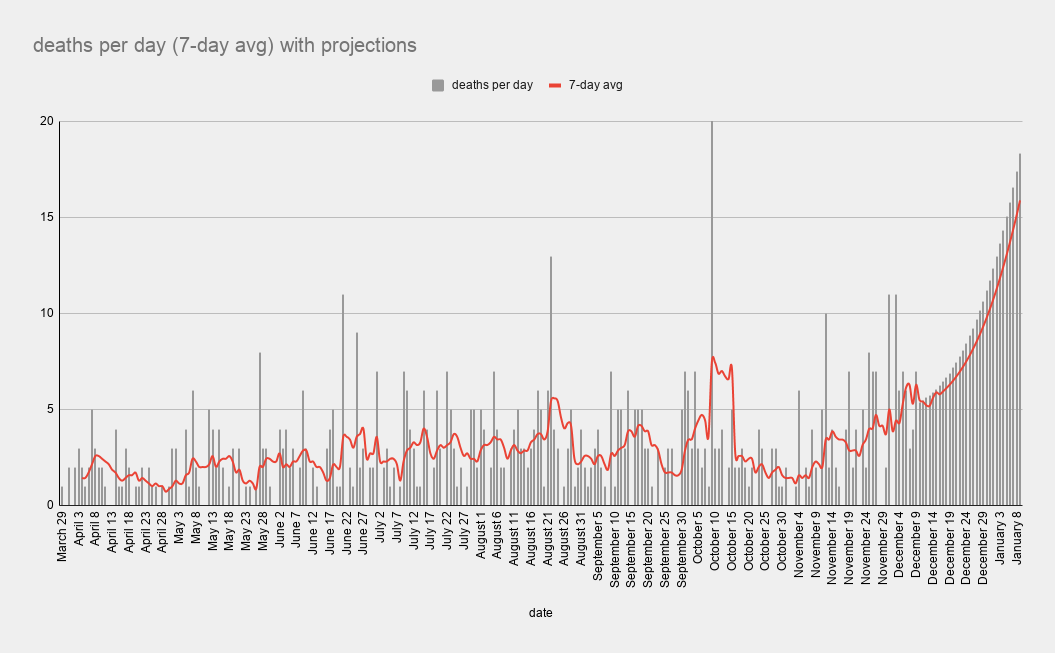
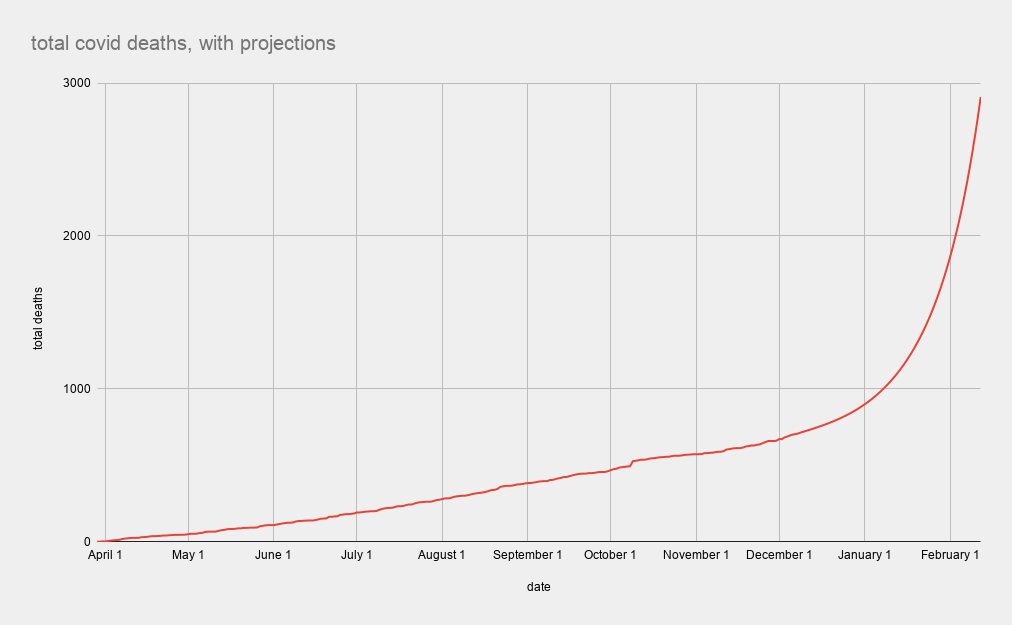
And here are covid deaths.
The only time we've avg'd more deaths per day was after a data dump of 33 deaths in one day back in Oct.
We're on pace to hit 15 deaths per day by Jan1.
At this rate, we'll be up to 50 deaths per day by Feb1.
6/
The only time we've avg'd more deaths per day was after a data dump of 33 deaths in one day back in Oct.
We're on pace to hit 15 deaths per day by Jan1.
At this rate, we'll be up to 50 deaths per day by Feb1.
6/
The first 10k cases took over 100 days.
20k, 28 days
30k, 52 days
40k, 52 days
50k, 25 days
60k will come in 18-22 days.
70k, 15-20 days after that.
80k, 14-16 days later.
90k, 12-15 days.
100k, 10-13 days.
And this is just at our current rate.
7/
20k, 28 days
30k, 52 days
40k, 52 days
50k, 25 days
60k will come in 18-22 days.
70k, 15-20 days after that.
80k, 14-16 days later.
90k, 12-15 days.
100k, 10-13 days.
And this is just at our current rate.
7/
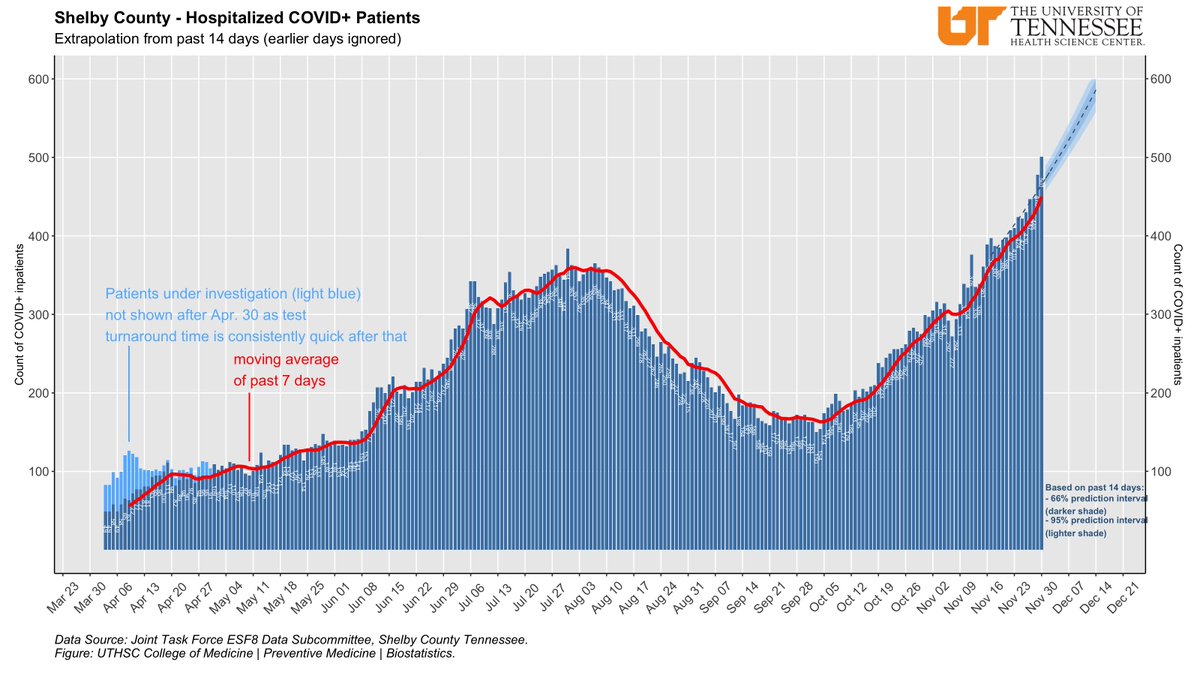
But it doesn't have to be like this.
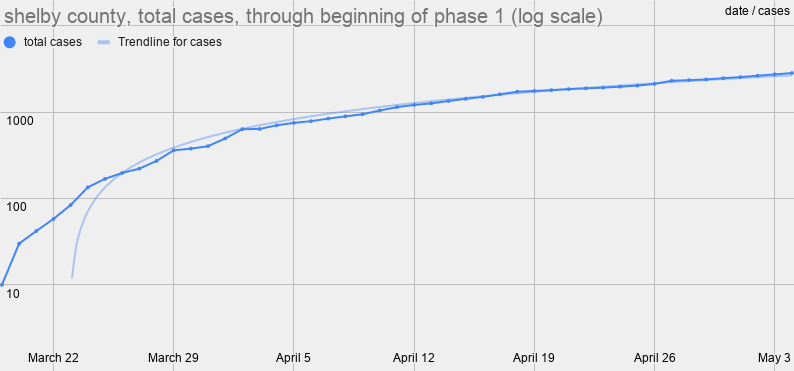
We have successfully flattened the curve twice now, once from March into April, then again from August through September.
If we did it before, we can do it again.
The only thing stopping us is the will to do so.
8/
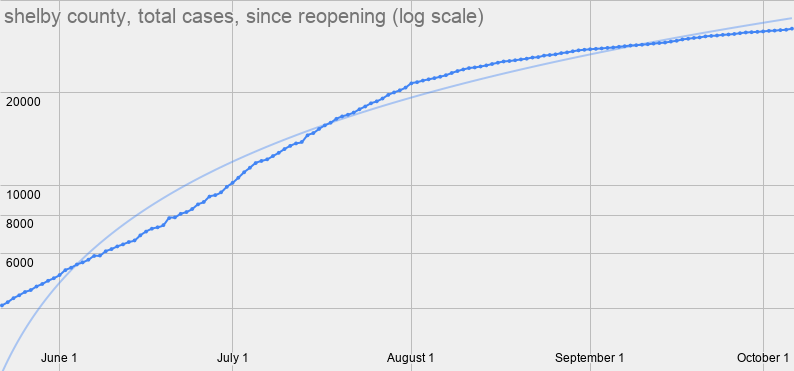
We have successfully flattened the curve twice now, once from March into April, then again from August through September.
If we did it before, we can do it again.
The only thing stopping us is the will to do so.
8/
In fact, we could go even further than flattening the curve. We could just get rid of covid altogether.
It's possible.
Look at Melbourne, Australia. The city is the size of DC, about 5x larger than Memphis, but has not had a new covid case in 4wks.
vox.com/2020/12/4/2215…
9/
It's possible.
Look at Melbourne, Australia. The city is the size of DC, about 5x larger than Memphis, but has not had a new covid case in 4wks.
vox.com/2020/12/4/2215…
9/
But right now there's no goal. And there's no call for everyone to rally together to reach a shared destination.
We've given up.
10/
We've given up.
10/

But now's not the time to give up.
We can see the finish line. Vaccines will be here by the Spring & Summer.
We can make it.
11/
We can see the finish line. Vaccines will be here by the Spring & Summer.
We can make it.
11/
We can literally save thousands of lives.
Have you ever have the chance to save thousands of lives? Probably not. And you probably never will again.
This is a once in a lifetime opportunity.
12/
Have you ever have the chance to save thousands of lives? Probably not. And you probably never will again.
This is a once in a lifetime opportunity.
12/
So what can you do?
Well, first of all, avoid being indoors w/ppl you don't live with, if at all possible.
If it's unavoidable (e.g., work, store), keep distance & wear a mask.
13/
Well, first of all, avoid being indoors w/ppl you don't live with, if at all possible.
If it's unavoidable (e.g., work, store), keep distance & wear a mask.
13/
And support local biz, esp restaurants.
Shop local for the holidays. Buy some gift cards. And order as much takeout from local restaurants as you can afford.
Support local nonprofits too. They're hurting too.
14/
Shop local for the holidays. Buy some gift cards. And order as much takeout from local restaurants as you can afford.
Support local nonprofits too. They're hurting too.
14/
Then, push for Congress to pass a financial relief bill.
The problem is Senate Rs.
So call and/or write.
15/
The problem is Senate Rs.
So call and/or write.
15/
We know what the end of the story looks like. Vaccines are coming, just not for a few more months.
But there is plenty of story yet to be written.
The question is, how how much death & disease will we allow as we wait?
The choice is ours. We can save thousands of lives.
16/16
But there is plenty of story yet to be written.
The question is, how how much death & disease will we allow as we wait?
The choice is ours. We can save thousands of lives.
16/16
• • •
Missing some Tweet in this thread? You can try to
force a refresh