Memphis/Shelby County
Mid-Wk Covid Report
tl;dr
* cases +260% since sept30, testing only +52%
* positivity rate up from 5.2% to 10.7%
* hospitalizations at record-highs, staffing is a problem
* vaccines are on the way...if we can make it to spring
1/
Mid-Wk Covid Report
tl;dr
* cases +260% since sept30, testing only +52%
* positivity rate up from 5.2% to 10.7%
* hospitalizations at record-highs, staffing is a problem
* vaccines are on the way...if we can make it to spring
1/

We've had problems with the case data since Nov1.
Read here:
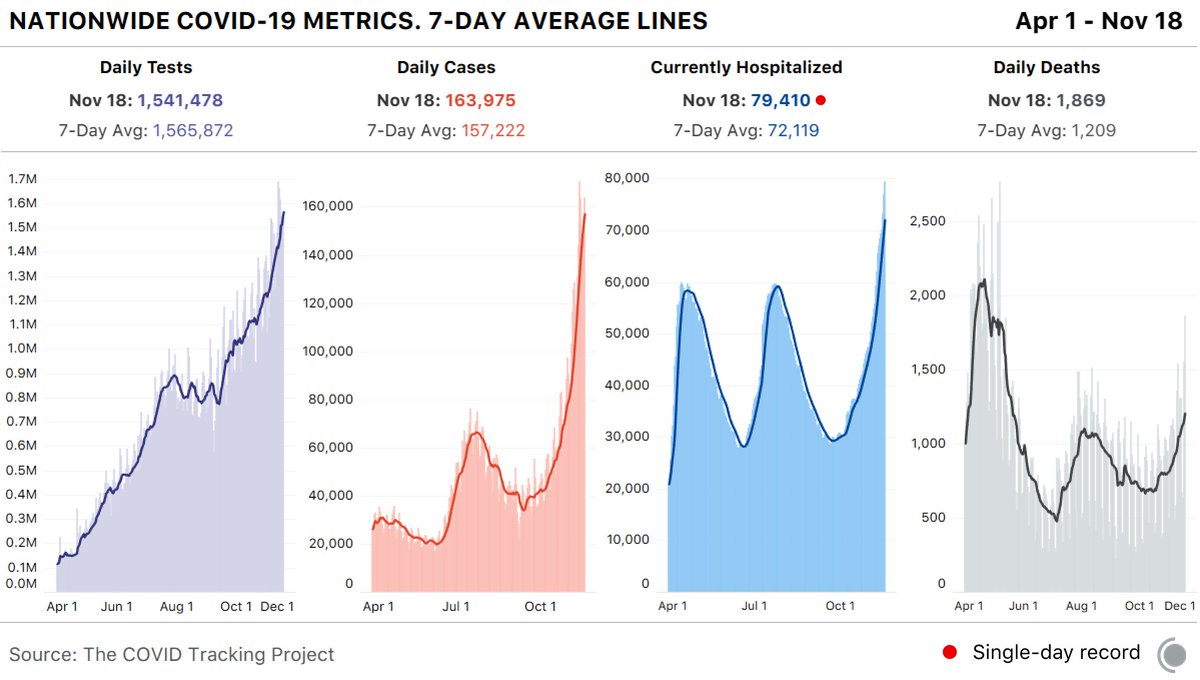
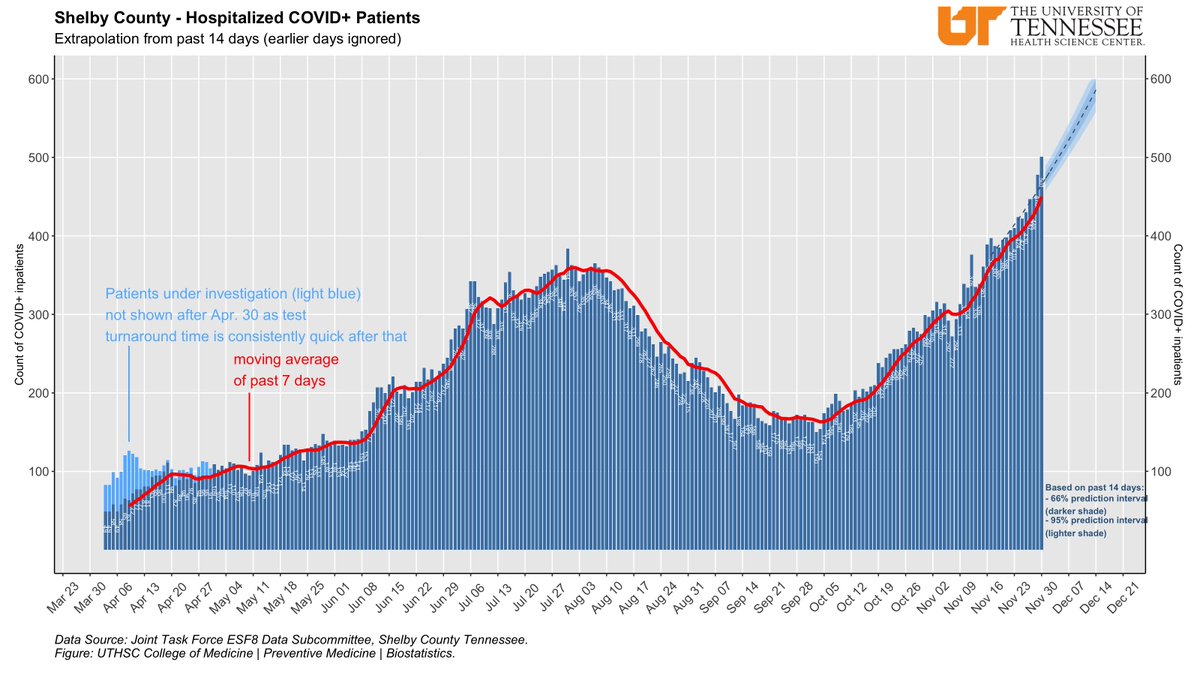
In the meantime, hospitalization numbers are the best we've got. And we've been setting records literally for wks now.
"Elective" surgeries are being canceled. Staffing is a problem.
2/
Read here:
https://twitter.com/firstresponses/status/1332875593130663941
In the meantime, hospitalization numbers are the best we've got. And we've been setting records literally for wks now.
"Elective" surgeries are being canceled. Staffing is a problem.
2/
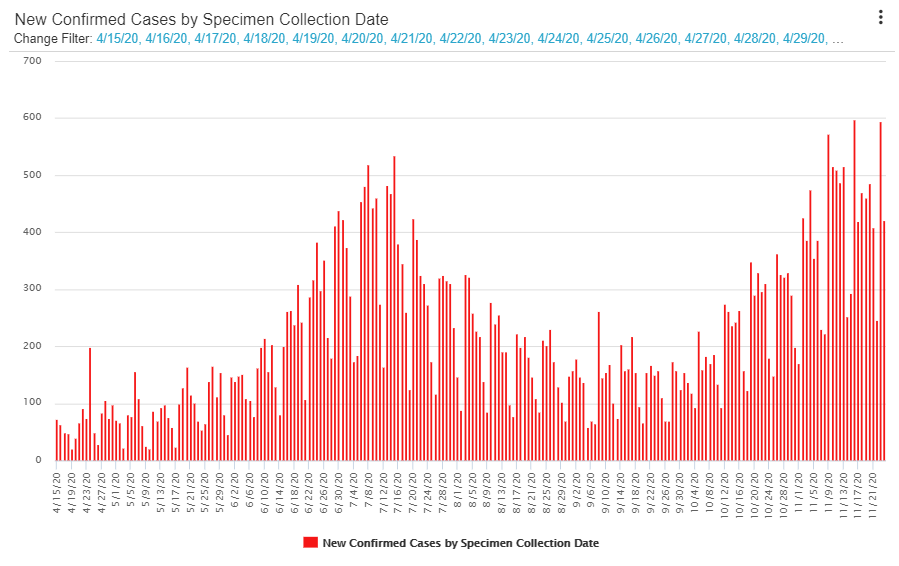
Here's the most up-to-date data we have on cases. This is a graph of daily cases by the date the test occurred.
A few things here...
1) The most recent data here is a wk old.
2) Bc of reporting delays, cases are still trickling in.
3) This is the worst we've seen.
3/
A few things here...
1) The most recent data here is a wk old.
2) Bc of reporting delays, cases are still trickling in.
3) This is the worst we've seen.
3/
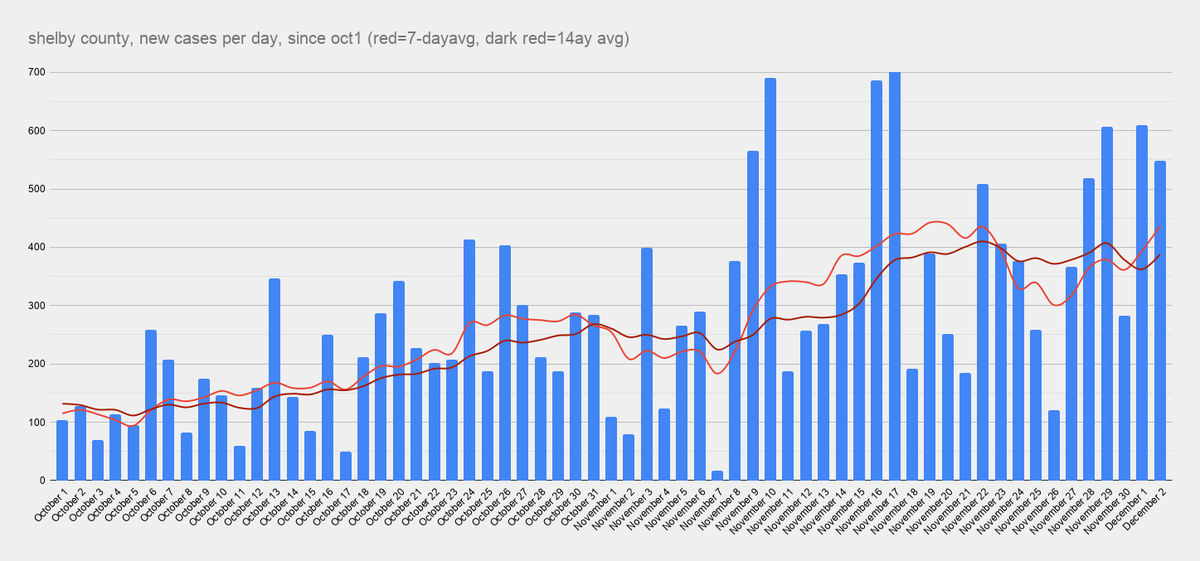
Here are daily cases by report date.
This goes up until today, but this way of presenting the data is sensitive to reporting delays. And that's why the rolling avg's are so important.
4/
This goes up until today, but this way of presenting the data is sensitive to reporting delays. And that's why the rolling avg's are so important.
4/
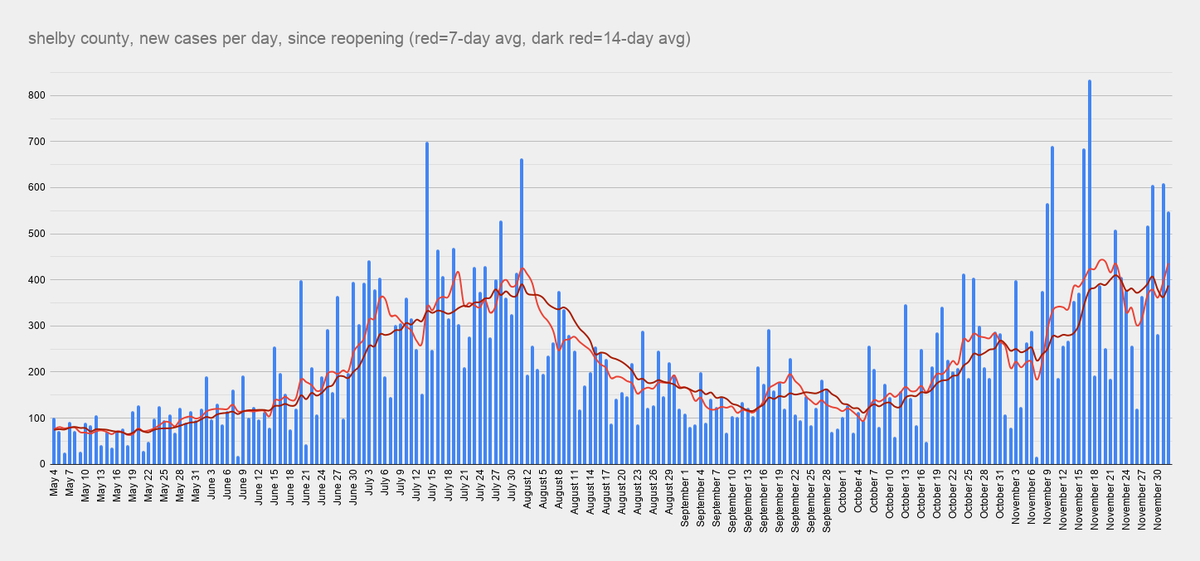
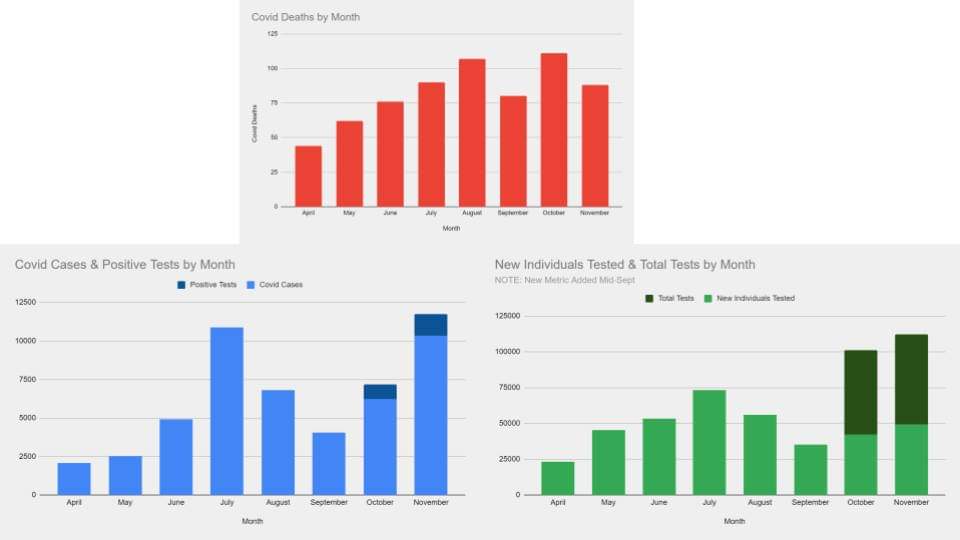
Here are daily cases and daily testing since Oct1.
Cases are +260%
Testing is just +52%
In other words, cases have grown 5x faster than testing.
5/
Cases are +260%
Testing is just +52%
In other words, cases have grown 5x faster than testing.
5/
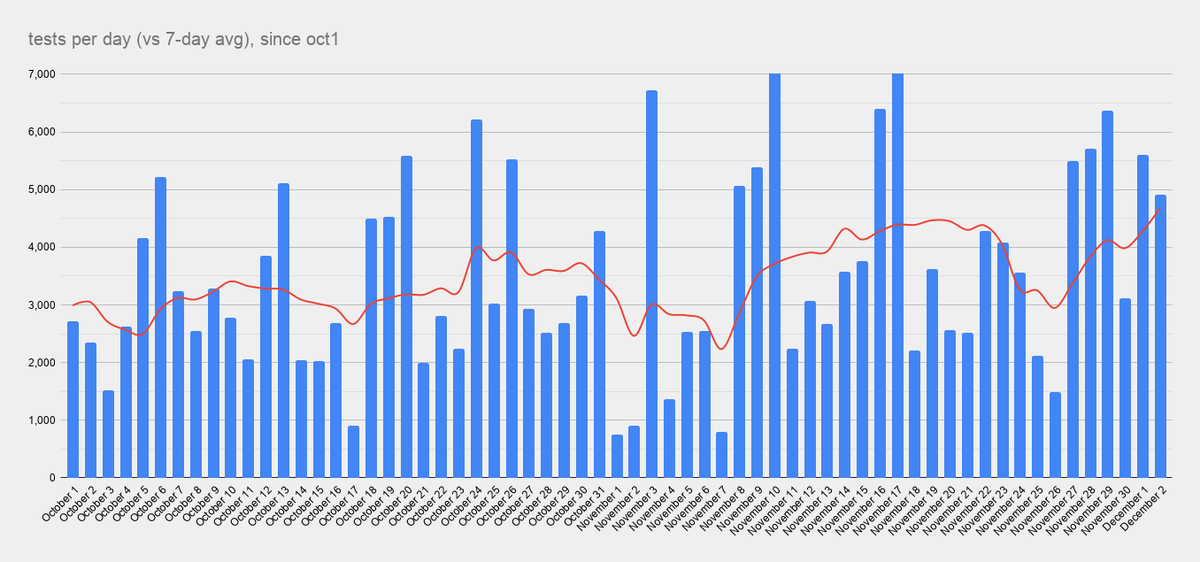
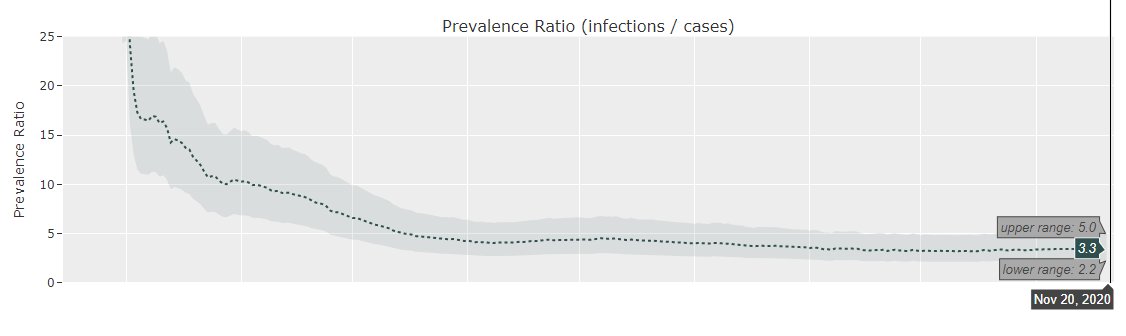
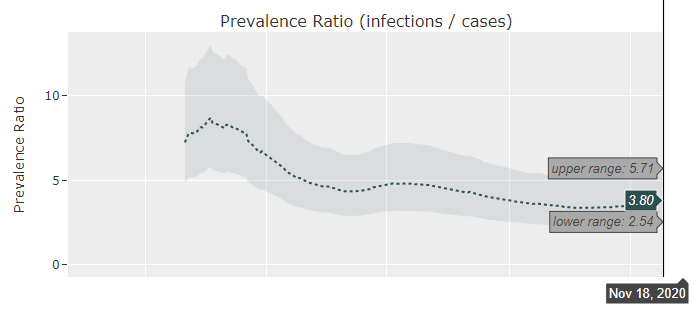
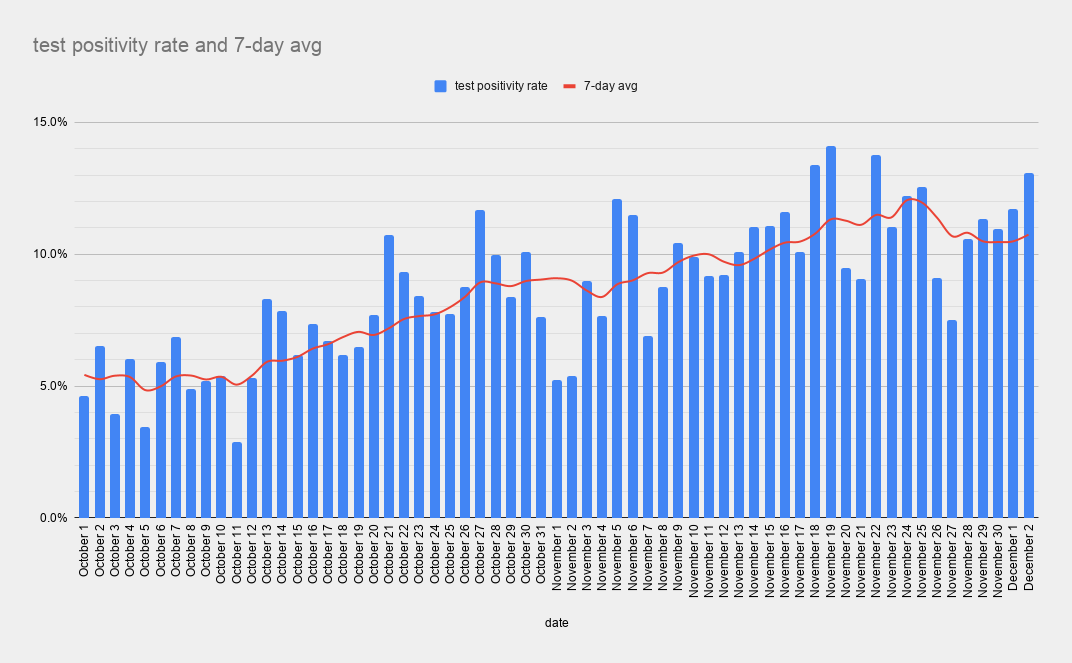
And so the positivity rate has grown from 5.2% to 10.7% over that same time.
Now, fortunately, over the past 7days, the positivity rate has fallen from 12.0% to 10.7%, bc testing has increased. But we still need to more than double our current testing.
6/
Now, fortunately, over the past 7days, the positivity rate has fallen from 12.0% to 10.7%, bc testing has increased. But we still need to more than double our current testing.
6/
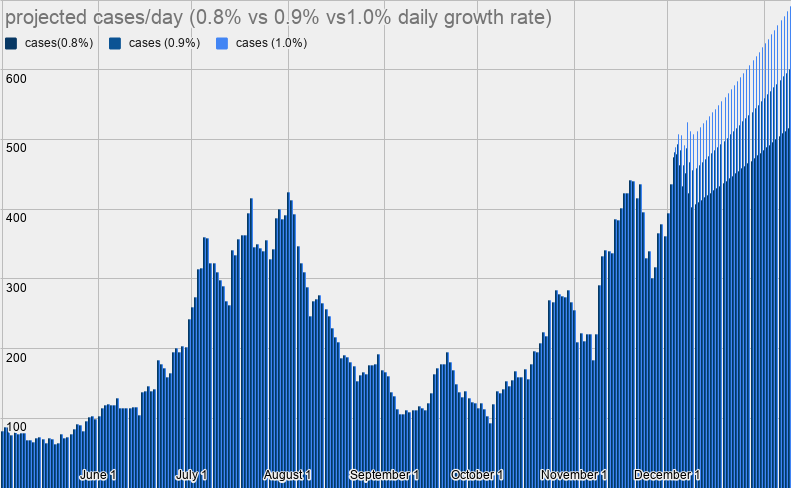
Here are projected cases through the end of the year.
Unfortunately, the growth rate has increased, and we now are on pace for the worst of the three paths here.
That would put us at 600 new cases/day by Xmas.
7/
Unfortunately, the growth rate has increased, and we now are on pace for the worst of the three paths here.
That would put us at 600 new cases/day by Xmas.
7/
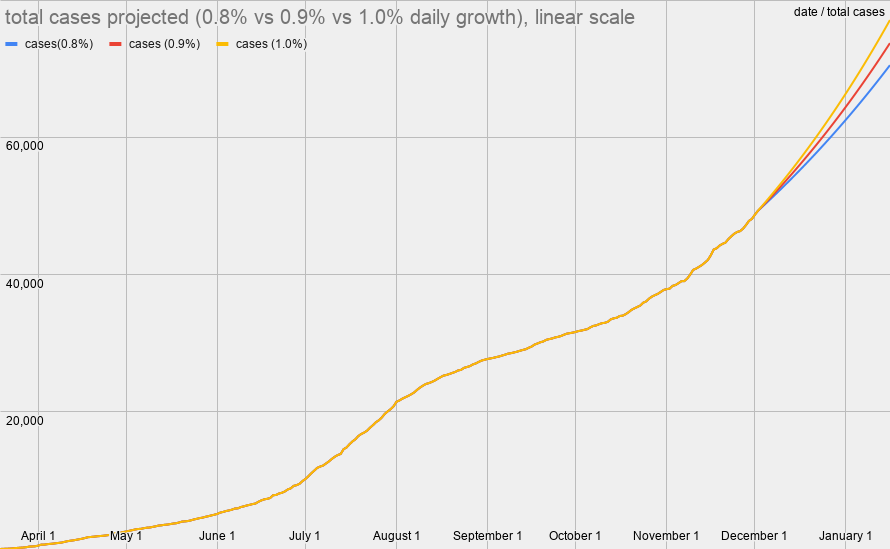
At this pace, we'll add another 10k cases by Dec21, just 19 days away.
The last 10k took 26 days.
The previous 10k took 56 days.
8/
The last 10k took 26 days.
The previous 10k took 56 days.
8/
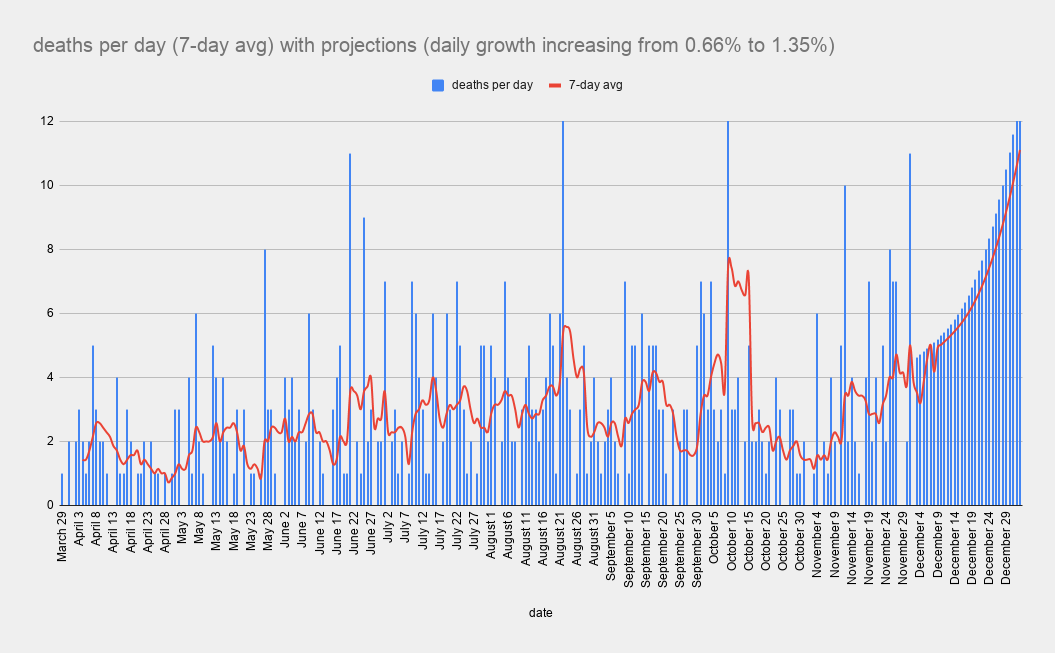
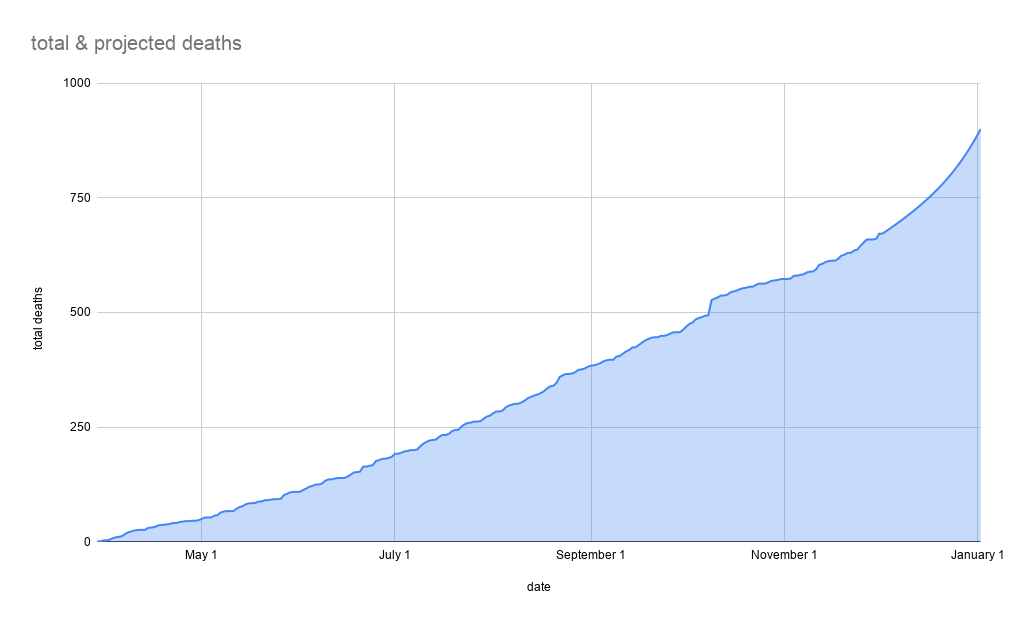
And here are projected deaths...
At this rate, we'll be up to 10 deaths per day and 875 total deaths by the end of the year.
For context, we're currently avg'ing just under 4 per day and 672 total.
9/
At this rate, we'll be up to 10 deaths per day and 875 total deaths by the end of the year.
For context, we're currently avg'ing just under 4 per day and 672 total.
9/
And yet bars, strip clubs, & large event parties remain open.
Apparently, the health dept was told about the big party this weekend, held in an enclosed tent outside a SE Mem club. Inspectors visited beforehand. They came back during the event. And they didn't shut it down.
10/
Apparently, the health dept was told about the big party this weekend, held in an enclosed tent outside a SE Mem club. Inspectors visited beforehand. They came back during the event. And they didn't shut it down.
10/
In yesterday's briefing, Dr. Randolph implied that ppl were being selfish & making poor decisions. He said, Just bc something's allowed doesn't mean you should do it.
Well, think about that msg'ing.
They allowed the party to happen. How can they blame anyone else for that?
11/
Well, think about that msg'ing.
They allowed the party to happen. How can they blame anyone else for that?
11/
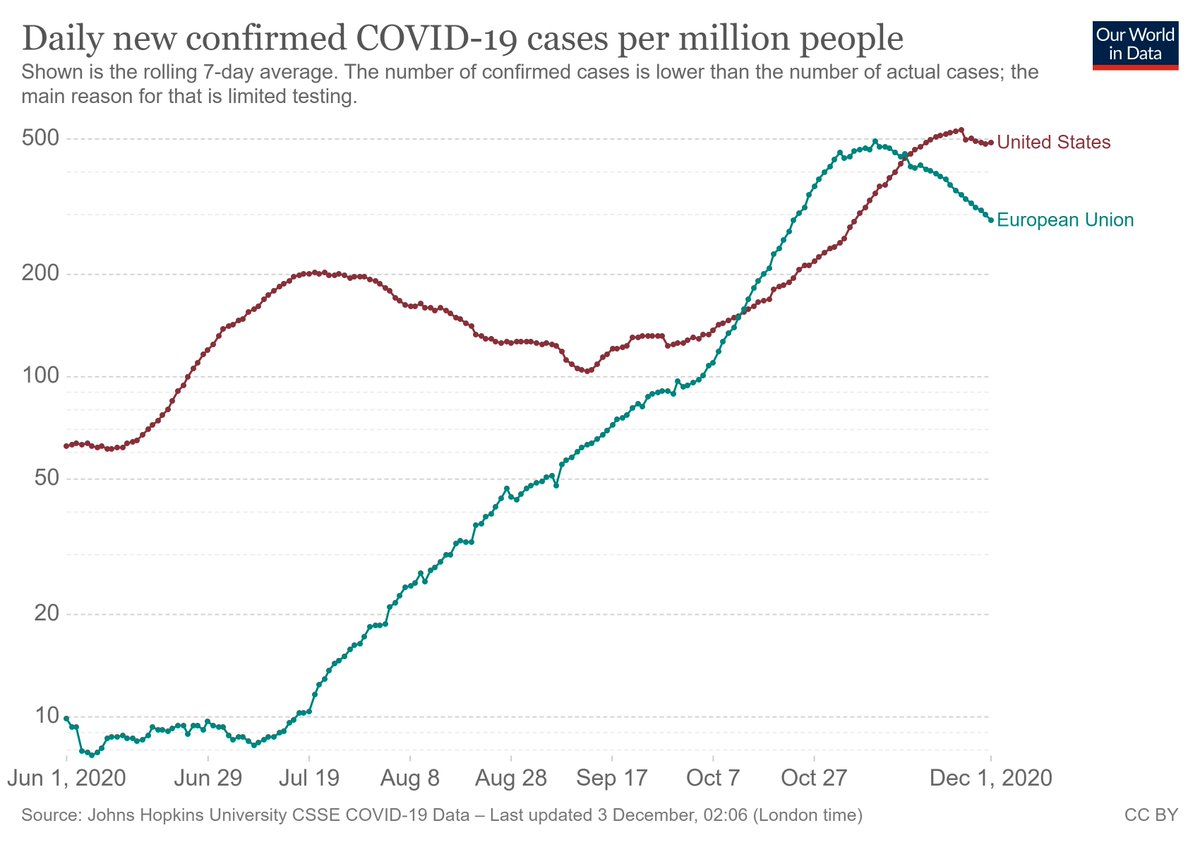
Someone asked today why schools in Europe are open while schools in America are not.
Well, the short story is that Europe prioritized schools, while America prioritized bars & businesses.
12/
Well, the short story is that Europe prioritized schools, while America prioritized bars & businesses.
12/
The long story is that European govts have provided enough financial relief to allow individuals & businesses to make safe-ish decisions.
America, meanwhile, has forced biz to open by refusing to provide relief and encouraged ppl to make bad decisions by mixed messages.
13/
America, meanwhile, has forced biz to open by refusing to provide relief and encouraged ppl to make bad decisions by mixed messages.
13/
And as a result, we've sacrificed our children.
You can't blame schools for closing. Blame the political leaders for letting covid spread unchecked in the community, making it unsafe for schools to open.
14/
You can't blame schools for closing. Blame the political leaders for letting covid spread unchecked in the community, making it unsafe for schools to open.
14/
That's the other thing. European govts were able to keep numbers down for most of the Summer & Fall, then took significant action when cases spiked.
That's how you open schools, then keep schools open.
15/
That's how you open schools, then keep schools open.
15/
Contrast that with our local govt, which opened strip clubs as cases were spiking 3wks ago...and then allowed a huge super-spreader party to go unchecked.
And that's why schools are closed right now.
16/
And that's why schools are closed right now.
16/
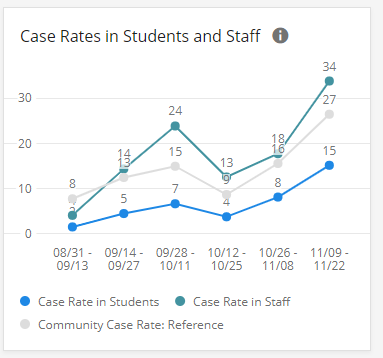
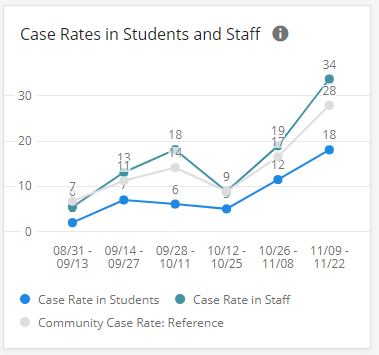
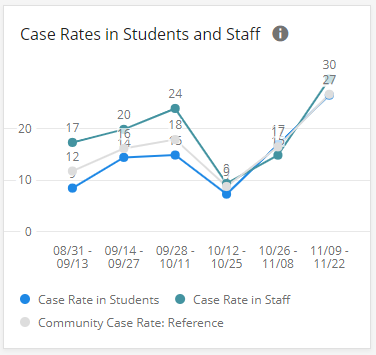
Speaking of schools, @ProfEmilyOster has built the most comprehensive national school covid dashboard.
Elementary schools, 15 daily cases per 100k in students.
Middle schools, 18 per 100k.
High schools, 27 per 100k.
Apart from high, teacher rates are considerably higher.
17/
Elementary schools, 15 daily cases per 100k in students.
Middle schools, 18 per 100k.
High schools, 27 per 100k.
Apart from high, teacher rates are considerably higher.
17/
I'm going to end w/a word of hope.
In the Christian church, we just entered the Advent season. And Advent is all abt waiting, anticipating, & preparing for that which is to come.
Vaccines are coming. We just have to wait a little while longer.
Can you make it to Spring?
18/18
In the Christian church, we just entered the Advent season. And Advent is all abt waiting, anticipating, & preparing for that which is to come.
Vaccines are coming. We just have to wait a little while longer.
Can you make it to Spring?
18/18
• • •
Missing some Tweet in this thread? You can try to
force a refresh