Memphis/Shelby County
Mid-Wk Covid Report
tl;dr
* we're up to 815 new cases/day, with 13.1%+
* and the growth rate is increasing
* we're on pace to avg 1,000 cases/day by xmas
* cases are +438% over 10wks, tests up +109%
* it's time to hibernate for the winter
1/
Mid-Wk Covid Report
tl;dr
* we're up to 815 new cases/day, with 13.1%+
* and the growth rate is increasing
* we're on pace to avg 1,000 cases/day by xmas
* cases are +438% over 10wks, tests up +109%
* it's time to hibernate for the winter
1/
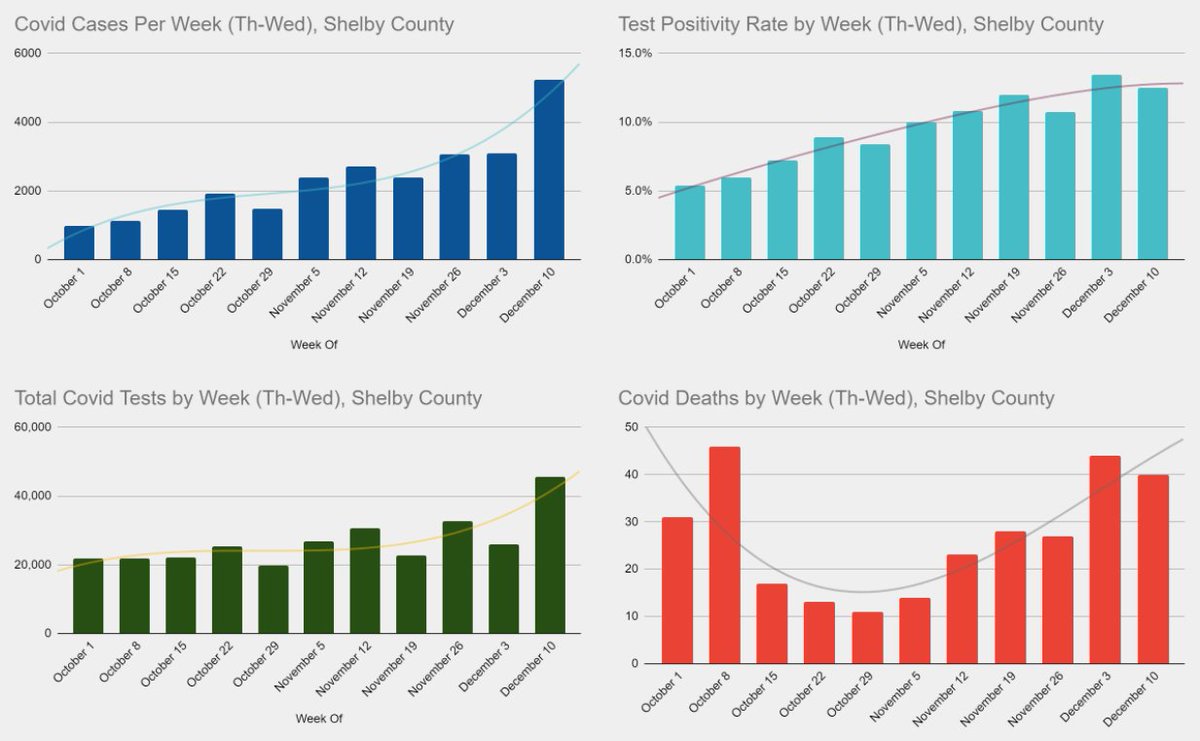
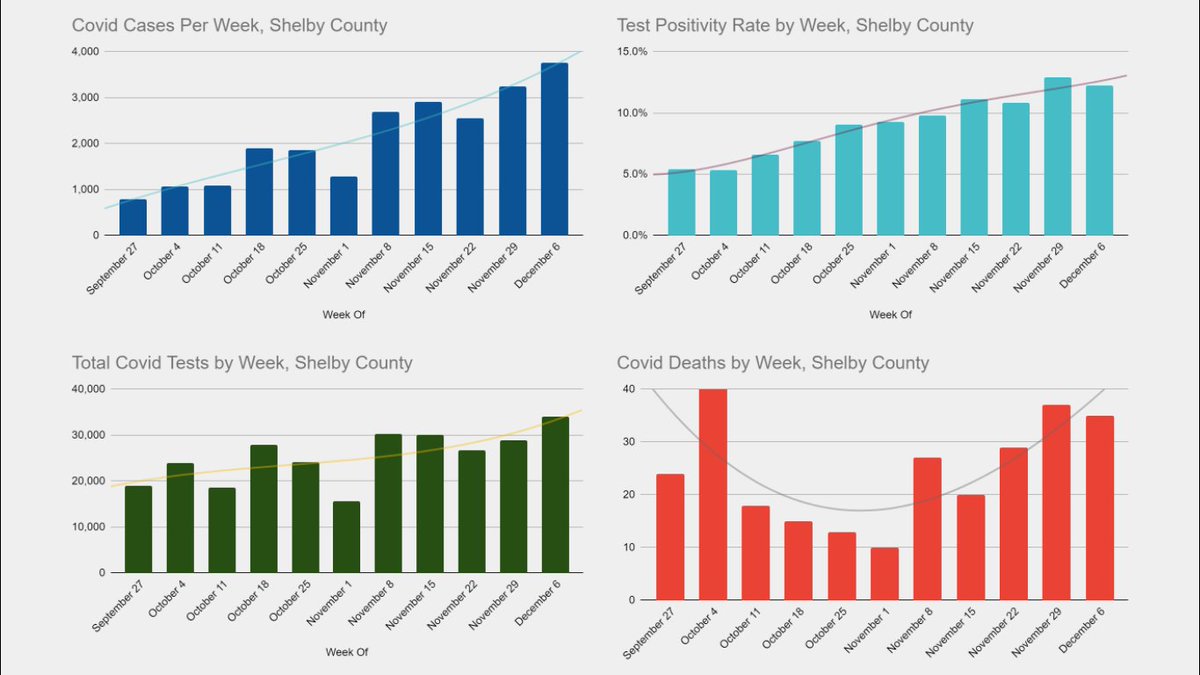
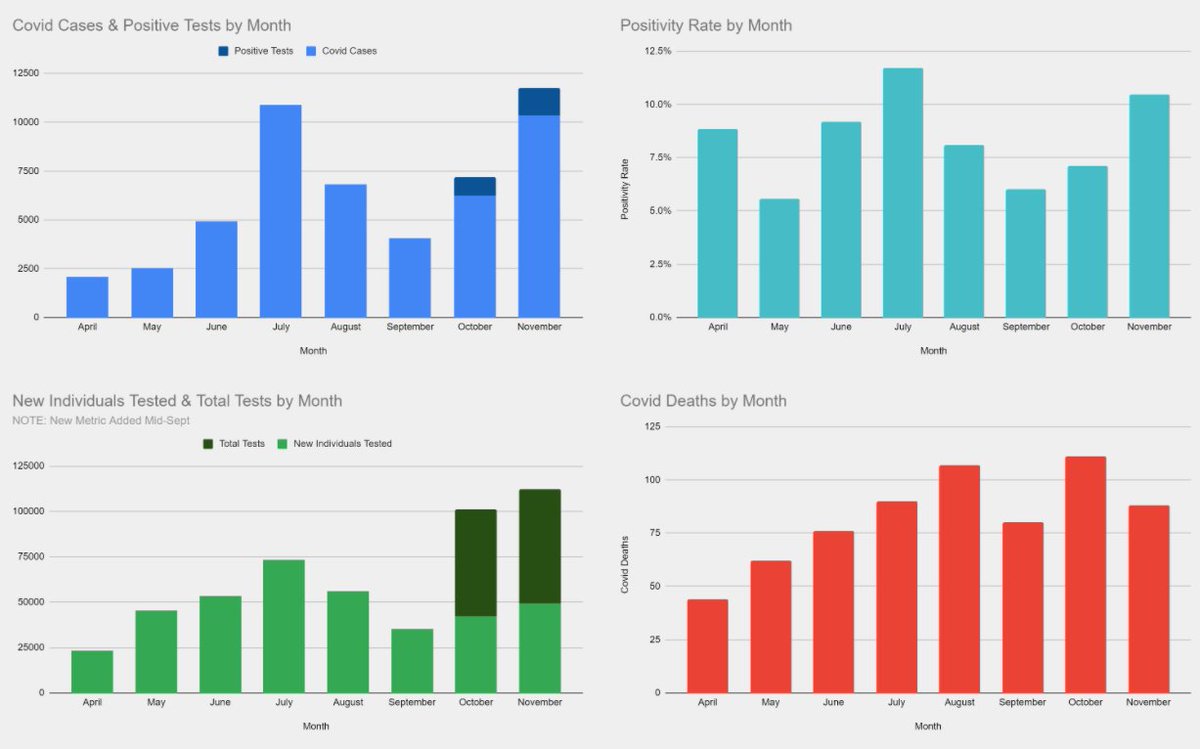
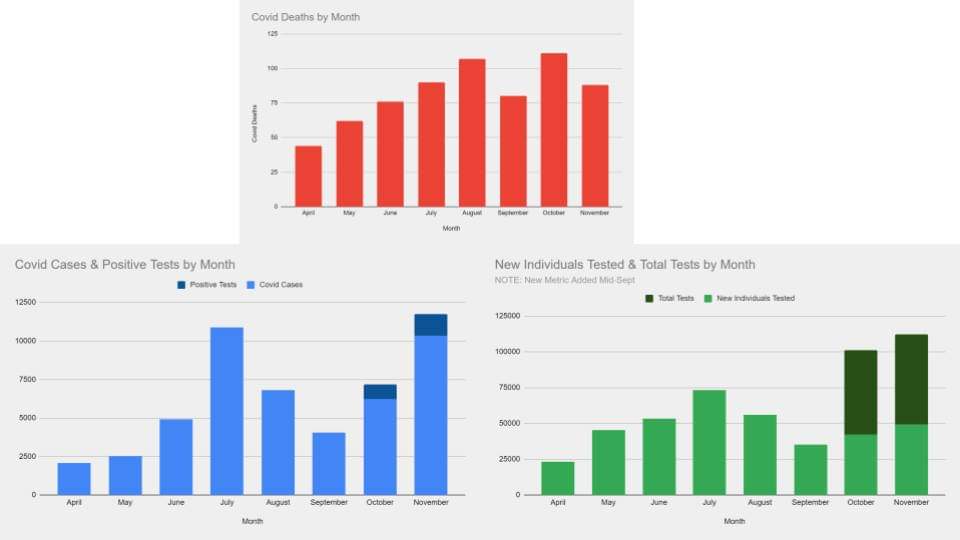
Cases vs Tests
1wk, +69% vs +76%
2wks, +72% vs +39%
4wks, +94% vs +48%
8wks, +261% vs 105%
10wks, +438% vs +109%
Positivity Rate
5.4%, wk of Oct1
13.5%, wk of Dec3
12.5%, wk of Dec10
Deaths
from 46 down to 11 in Oct
then up to 44 & 40 in Dec
2/
1wk, +69% vs +76%
2wks, +72% vs +39%
4wks, +94% vs +48%
8wks, +261% vs 105%
10wks, +438% vs +109%
Positivity Rate
5.4%, wk of Oct1
13.5%, wk of Dec3
12.5%, wk of Dec10
Deaths
from 46 down to 11 in Oct
then up to 44 & 40 in Dec
2/

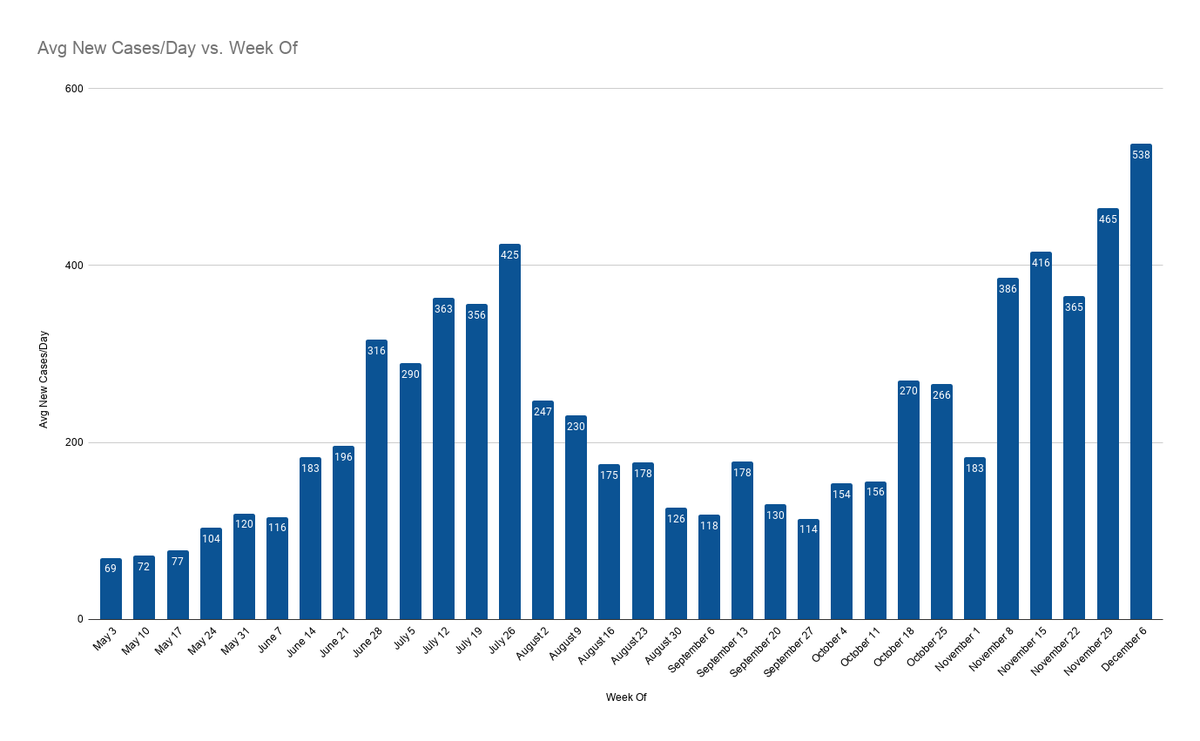
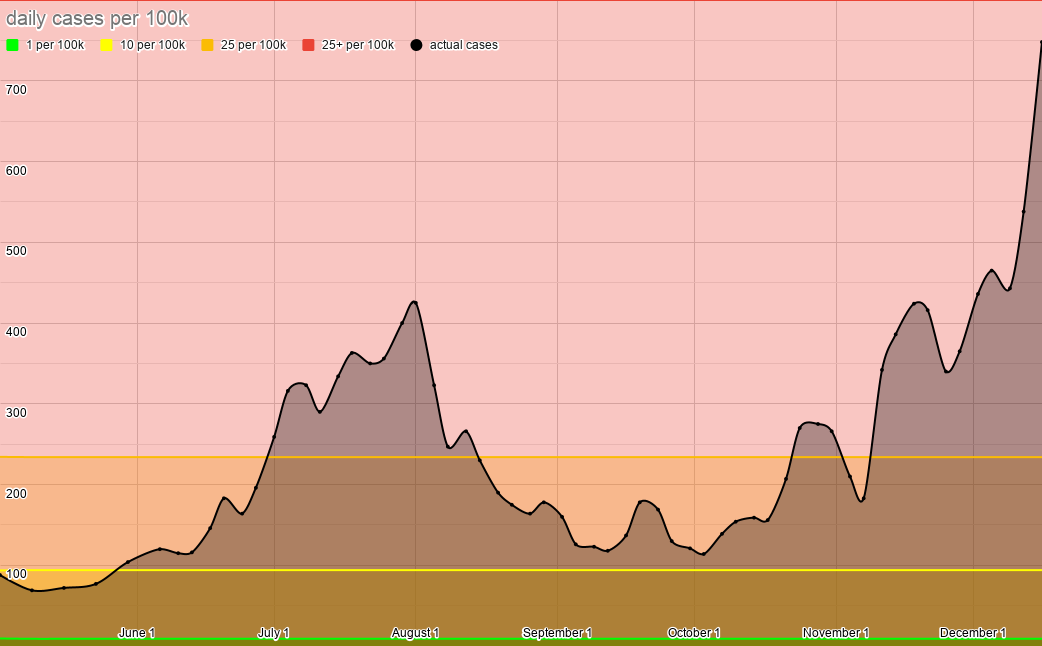
Case Rate
- summer peak: 45.3 daily cases per 100k
- today: 87.0 per 100k
In other words, we are nearly double the cases per capita from the worst of the summer.
3/
- summer peak: 45.3 daily cases per 100k
- today: 87.0 per 100k
In other words, we are nearly double the cases per capita from the worst of the summer.
3/
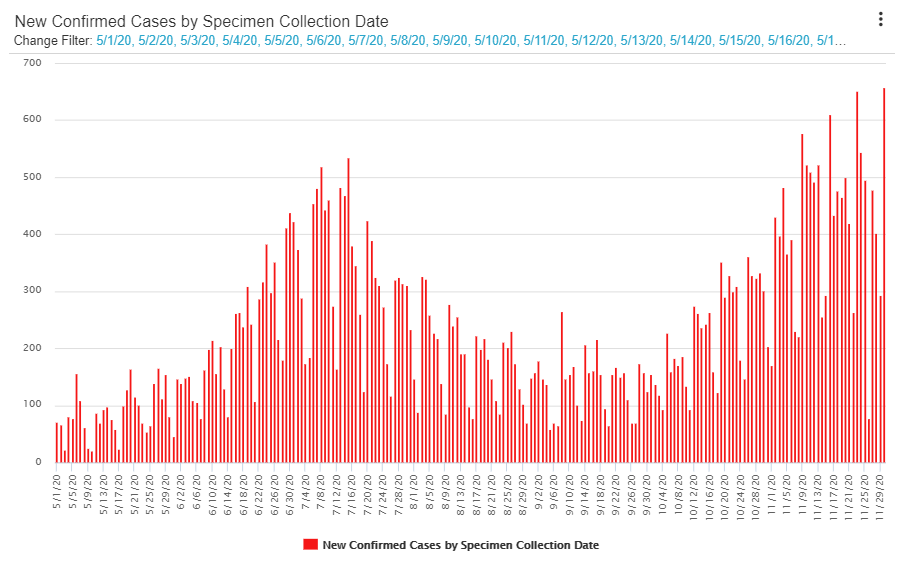
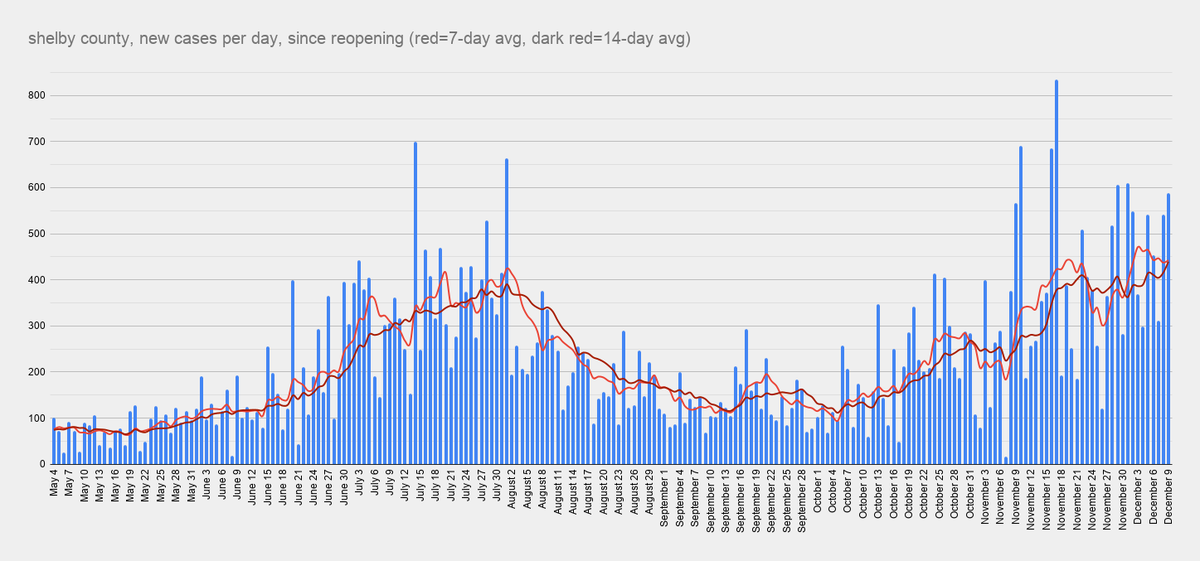
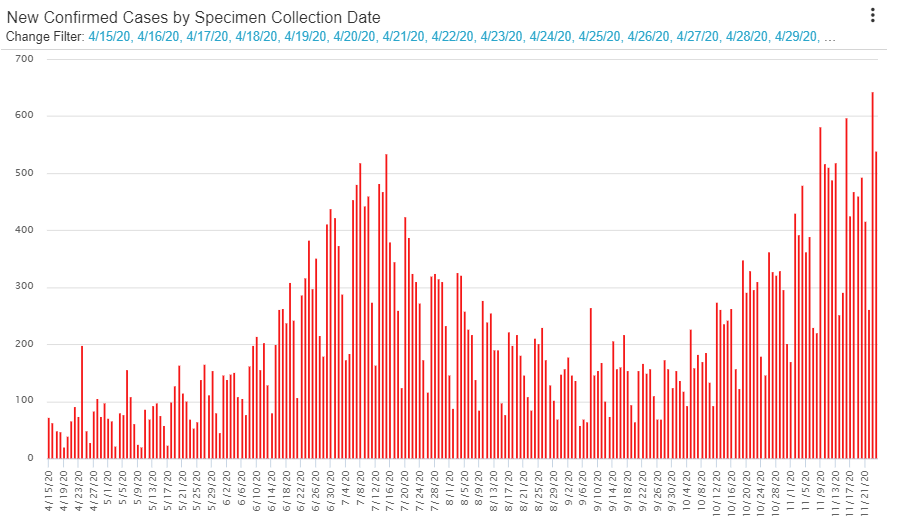
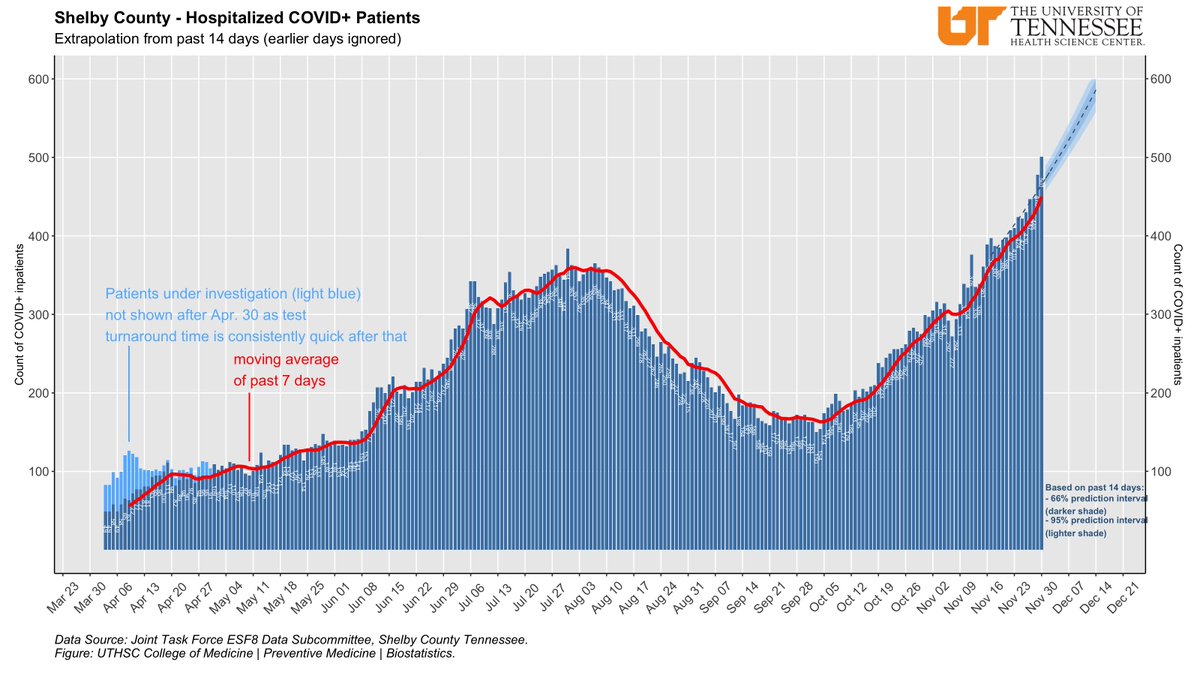
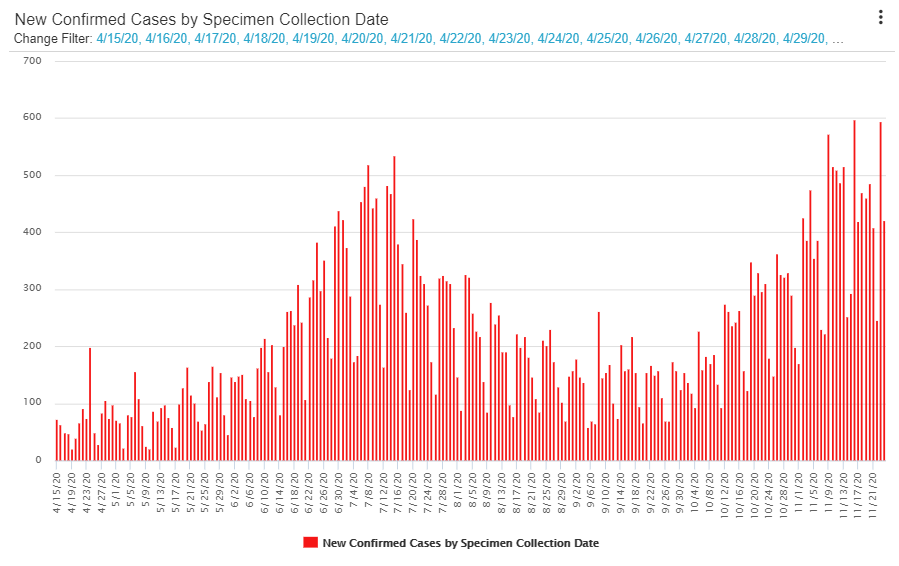
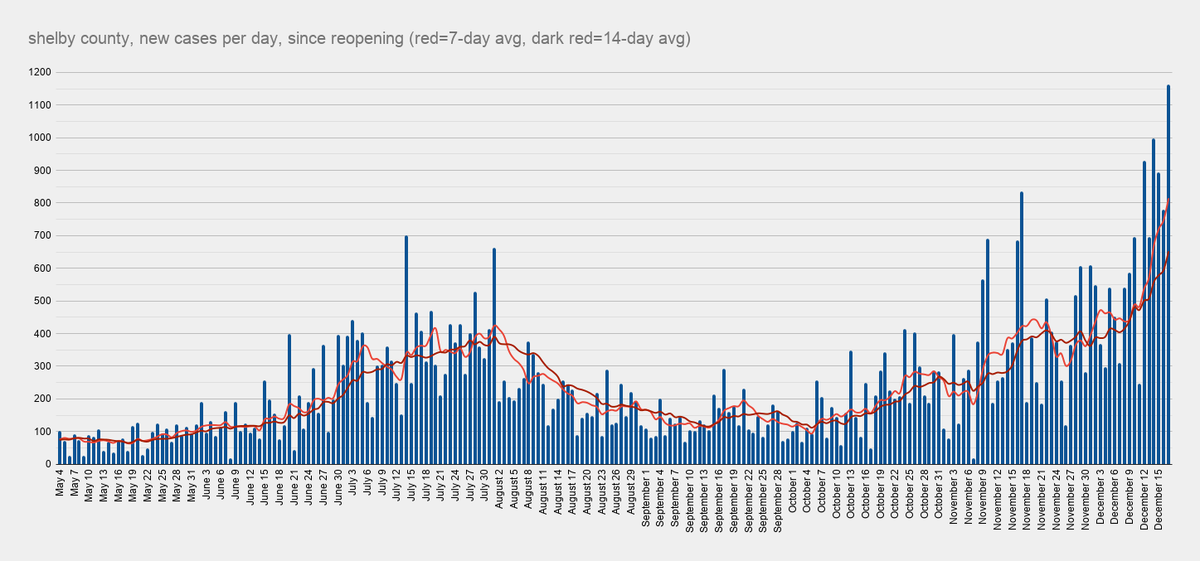
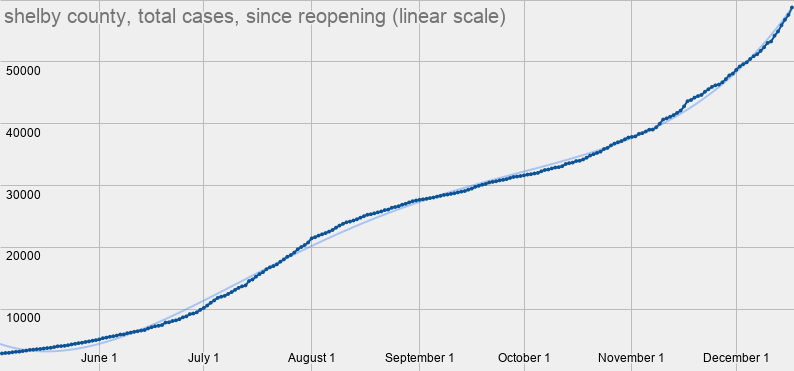
Here are cases per day.
The dashboard is already updated with tomorrow's numbers, so this is through Th/Dec17.
Notice something?
Dec17 tops 1,000 for the first time. For context, the high this summer was 700.
The 7-day avg: 815 cases/day. The high this summer: 425/day.
4/
The dashboard is already updated with tomorrow's numbers, so this is through Th/Dec17.
Notice something?
Dec17 tops 1,000 for the first time. For context, the high this summer was 700.
The 7-day avg: 815 cases/day. The high this summer: 425/day.
4/
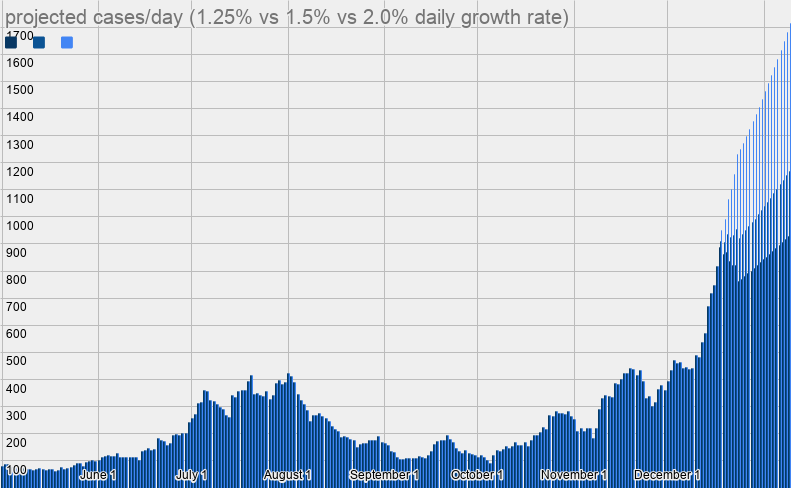
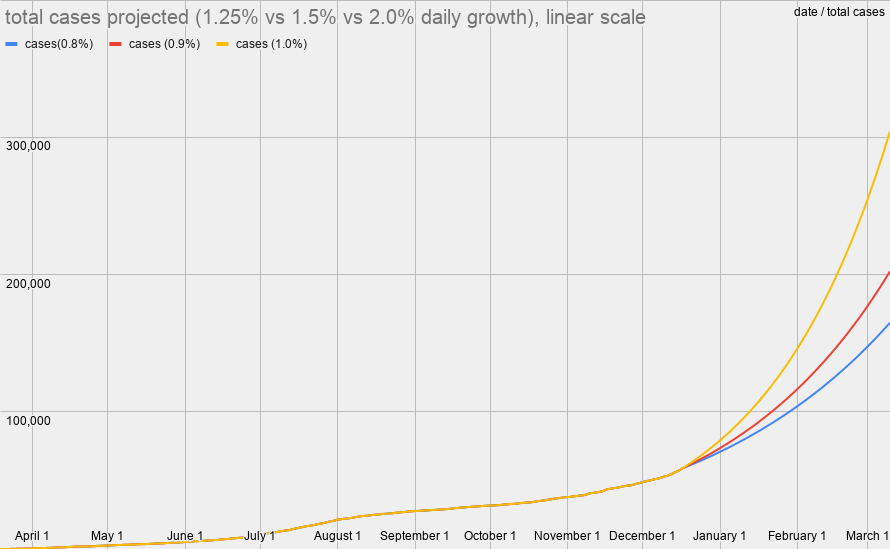
Our daily growth rate has risen from 0.8% in late Oct, to 1.0% in early Dec, to 1.5% the past wk.
We're now on pace to avg 1,000 new cases per day by Christmas.
5/
We're now on pace to avg 1,000 new cases per day by Christmas.
5/
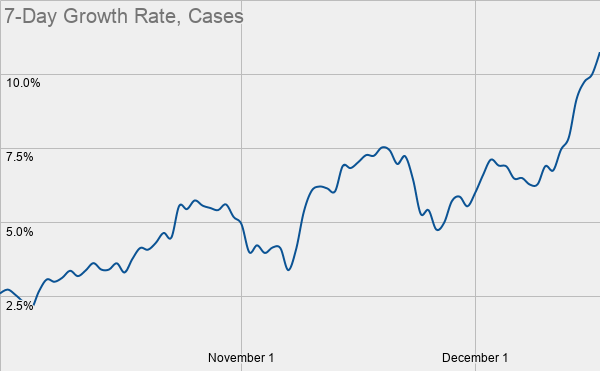
Here is the 7-day growth rate.
On Oct5, it was down to 2.1%. Now it's up to 10.8%.
The growth rate is 5x what it was 10wks ago.
This is how you get exponential growth.
6/
On Oct5, it was down to 2.1%. Now it's up to 10.8%.
The growth rate is 5x what it was 10wks ago.
This is how you get exponential growth.
6/
The first 10k cases took over 100 days.
From 10k to 20k, 28 days
30k, 52 days
40k, 52 days
50k, 25 days
We're going to hit 60k this weekend.
14 days.
7/
From 10k to 20k, 28 days
30k, 52 days
40k, 52 days
50k, 25 days
We're going to hit 60k this weekend.
14 days.
7/
We reached 50k cases on Dec5.
That took 272 days.
It took 111 days to double from 25k to 50k.
We're on pace to reach 100k by Jan22.
That's just 48 days to double from 50k to 100k.
8/
That took 272 days.
It took 111 days to double from 25k to 50k.
We're on pace to reach 100k by Jan22.
That's just 48 days to double from 50k to 100k.
8/
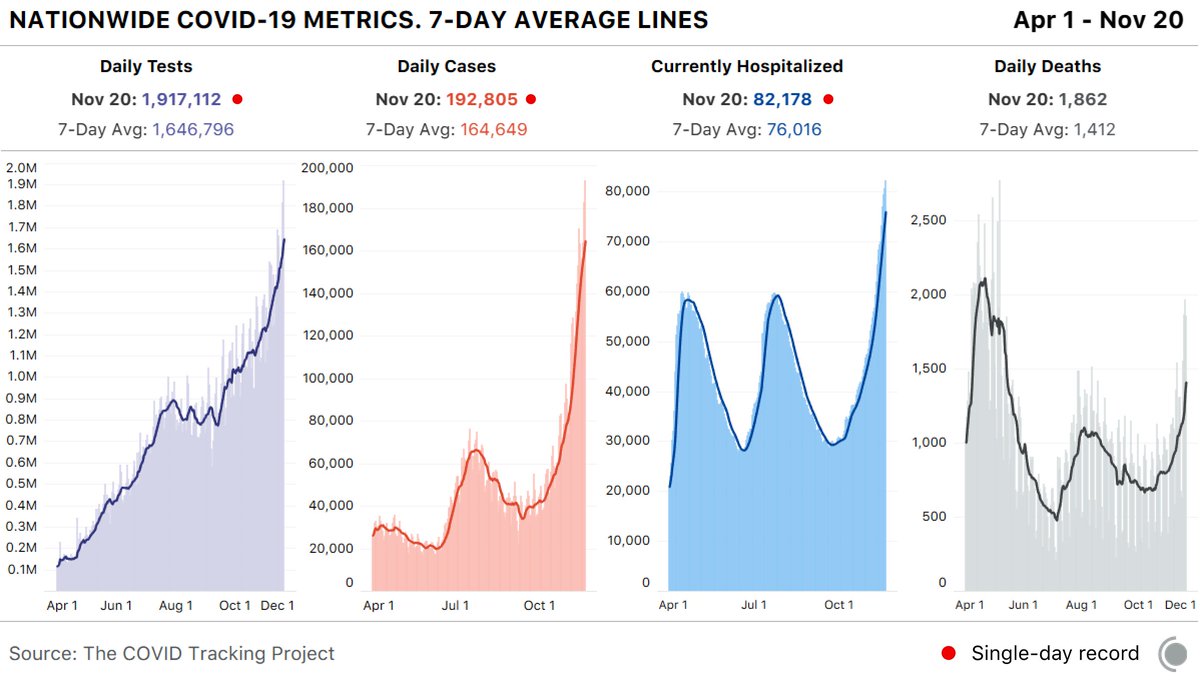
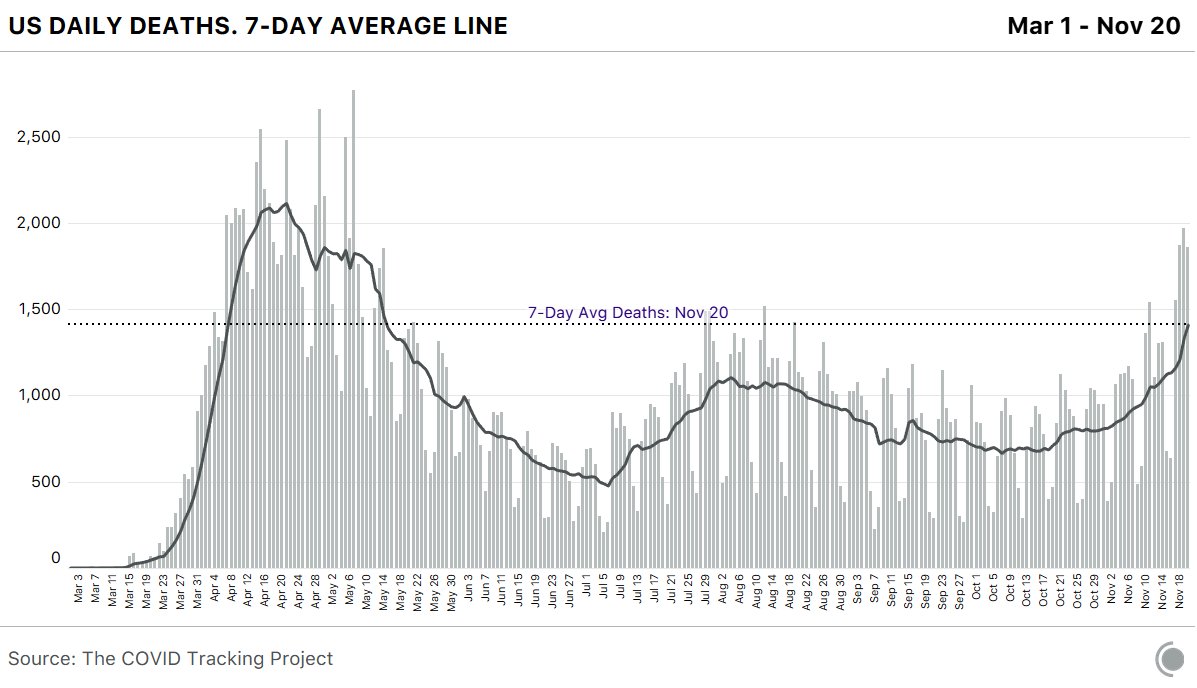
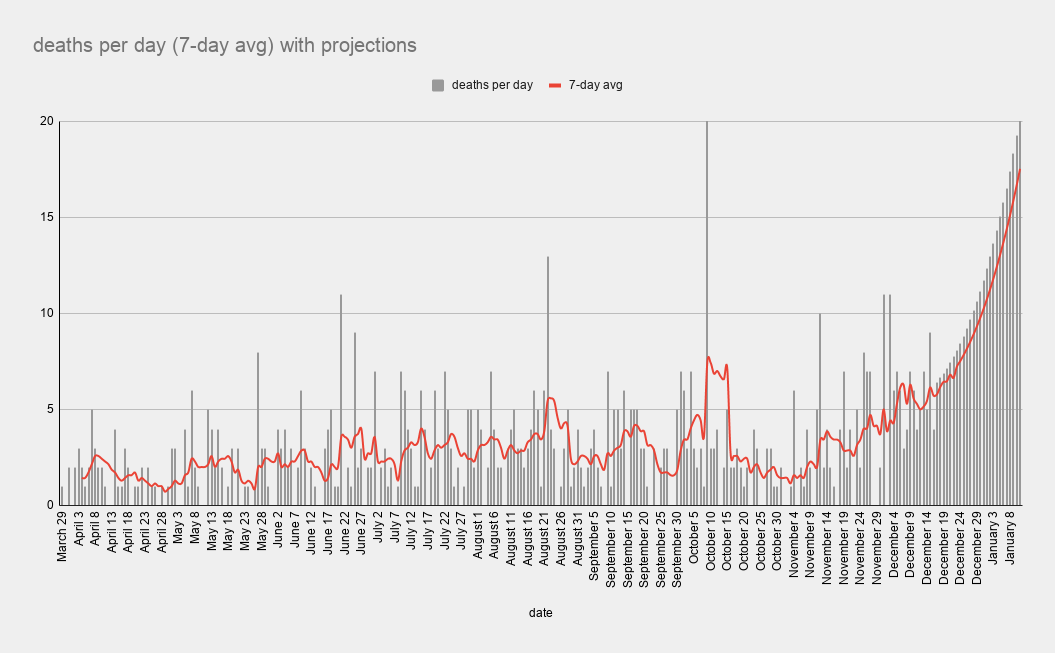
What about deaths?
At the end of Oct, we were avg'ing 1.4 deaths per day. We were up over 6 per day yesterday, but now we're down slightly to 5.7 per day.
We're on pace to be at 10 deaths per day by the end of Dec and 20 per day 2wks into Jan.
9/
At the end of Oct, we were avg'ing 1.4 deaths per day. We were up over 6 per day yesterday, but now we're down slightly to 5.7 per day.
We're on pace to be at 10 deaths per day by the end of Dec and 20 per day 2wks into Jan.
9/
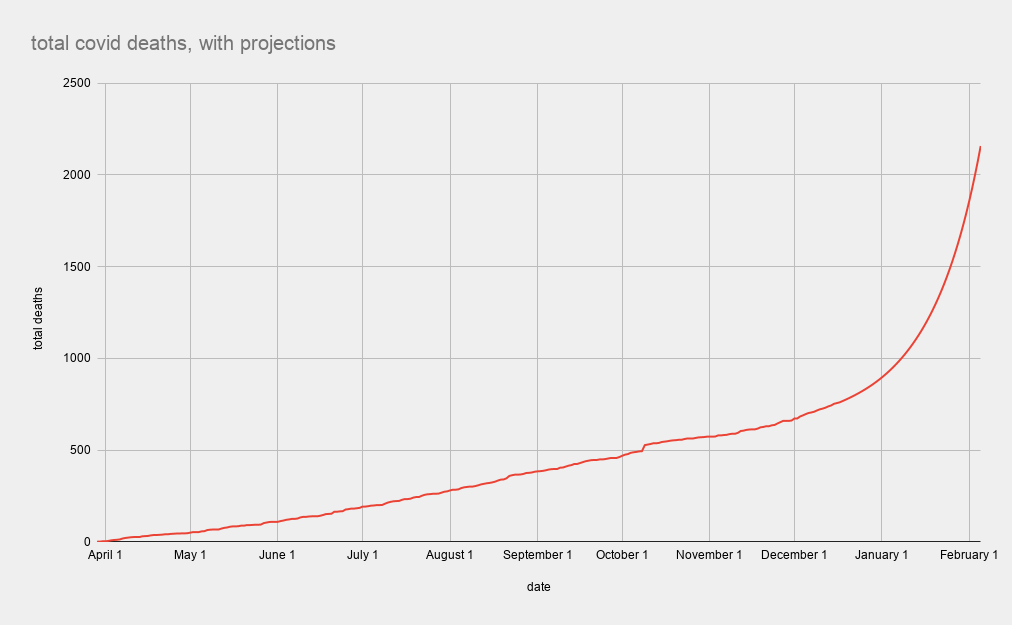
Here's what happens, though.
As cases surge, the healthcare system becomes overwhelmed. Sure, we could open the old CA Bldg for space. But who would work it? There's not enough staff.
And so deaths start to skyrocket.
10/
As cases surge, the healthcare system becomes overwhelmed. Sure, we could open the old CA Bldg for space. But who would work it? There's not enough staff.
And so deaths start to skyrocket.
10/
Not just covid deaths either.
What happens when you have a heart attack? What happens when you're in a car accident? What happens when you have an asthma attack?
If there aren't any beds, or there aren't any staffed beds, then you are in trouble!
11/
What happens when you have a heart attack? What happens when you're in a car accident? What happens when you have an asthma attack?
If there aren't any beds, or there aren't any staffed beds, then you are in trouble!
11/
And help is *not* on the way.
In the briefing yesterday, the main message from the health dept was this: "We've done all we can do."
And: "It's up to you."
That last part was said at least five times.
"It's up to you."
"It's up to you."
"It's up to you."
12/
In the briefing yesterday, the main message from the health dept was this: "We've done all we can do."
And: "It's up to you."
That last part was said at least five times.
"It's up to you."
"It's up to you."
"It's up to you."
12/
And the governor is shifting his priority from testing to vaccinations.
Why is it an either/or?
Why not hire more staff and do both?
The majority of ppl won't get a vaccine for months.
13/
Why is it an either/or?
Why not hire more staff and do both?
The majority of ppl won't get a vaccine for months.
13/
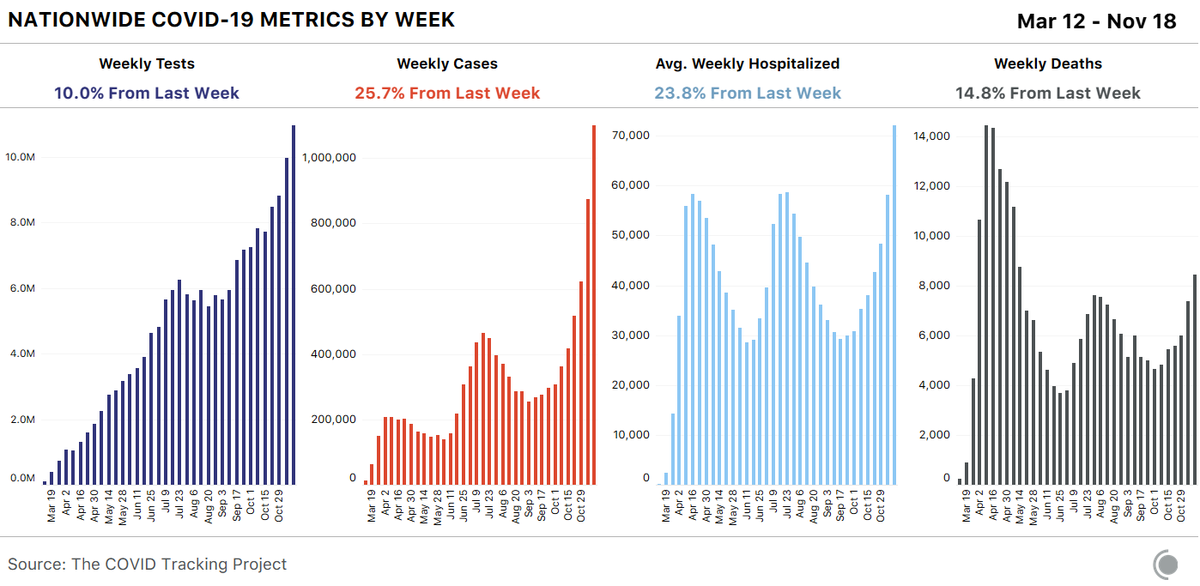
And TN has the worst outbreak in the entire world right now!
In the whole world!
But we still don't have a mask mandate!
14/
In the whole world!
But we still don't have a mask mandate!
14/
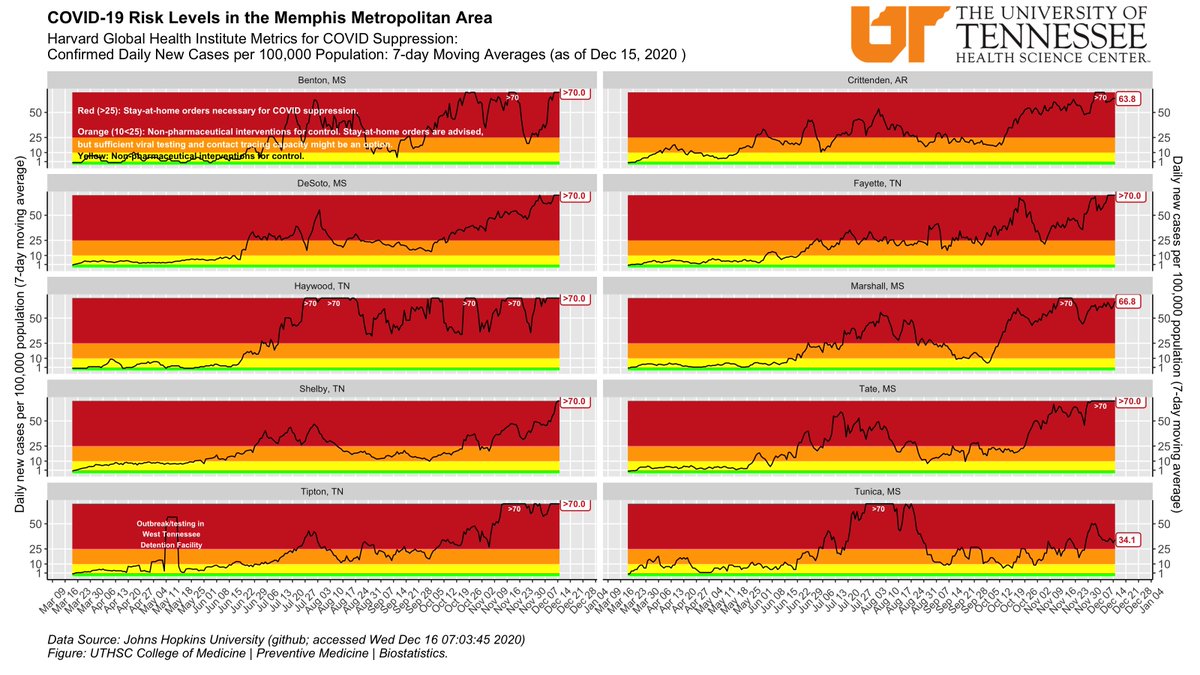
Nearly the entire Memphis Metro Area now has case rates that are literally off the chart.
Seriously, the chart goes up to 70 per 100k.
And 7 of the 10 counties are above that. Plus 2 more are in the 60s per 100k.
15/
Seriously, the chart goes up to 70 per 100k.
And 7 of the 10 counties are above that. Plus 2 more are in the 60s per 100k.
15/
Meanwhile, on the coldest day of the year, in the middle of the worst pandemic in the world, you've got evictions happening.
And police arresting organizers trying to help.
Much love to @hunter_demster.
Cashapp the family: $justice4martavious
facebook.com/HunterDemster/…
16/
And police arresting organizers trying to help.
Much love to @hunter_demster.
Cashapp the family: $justice4martavious
facebook.com/HunterDemster/…
16/
As I've said beffore, we know the end of the story. Vaccines are on the way.
But there is plenty of story yet to be written.
The question is, what does the next 3-6 months look like?
We're on the road to death & disease.
May we choose life & love instead.
17/17
But there is plenty of story yet to be written.
The question is, what does the next 3-6 months look like?
We're on the road to death & disease.
May we choose life & love instead.
17/17
• • •
Missing some Tweet in this thread? You can try to
force a refresh