Memphis/Shelby County
Covid Wk-In-Review
tl;dr
* it. just. keeps. getting. worse.
* 844 new cases/day
* 5907 new cases this wk (previous high last wk, 3764)
* +57% over 1wk, +642% over 11wks
* 73 deaths this wk (previous high, 52)
* stay-at-home orders coming monday (maybe?)
1/
Covid Wk-In-Review
tl;dr
* it. just. keeps. getting. worse.
* 844 new cases/day
* 5907 new cases this wk (previous high last wk, 3764)
* +57% over 1wk, +642% over 11wks
* 73 deaths this wk (previous high, 52)
* stay-at-home orders coming monday (maybe?)
1/
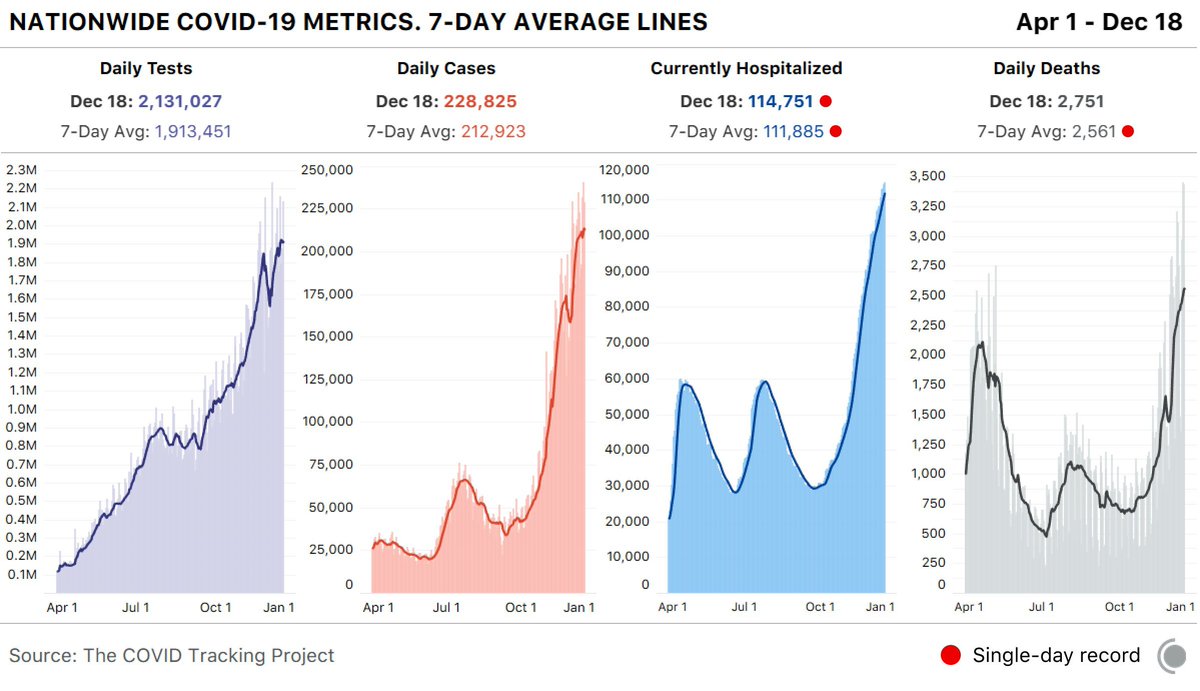
Let's actually start with the national picture.
We're avg'ing 2561 covid deaths per day.
That's 1 death every 16.9 seconds.
Let that sink in.
Count off 17 seconds.
That's not long.
That's how often a covid death happens.
And it's getting worse.
2/
We're avg'ing 2561 covid deaths per day.
That's 1 death every 16.9 seconds.
Let that sink in.
Count off 17 seconds.
That's not long.
That's how often a covid death happens.
And it's getting worse.
2/
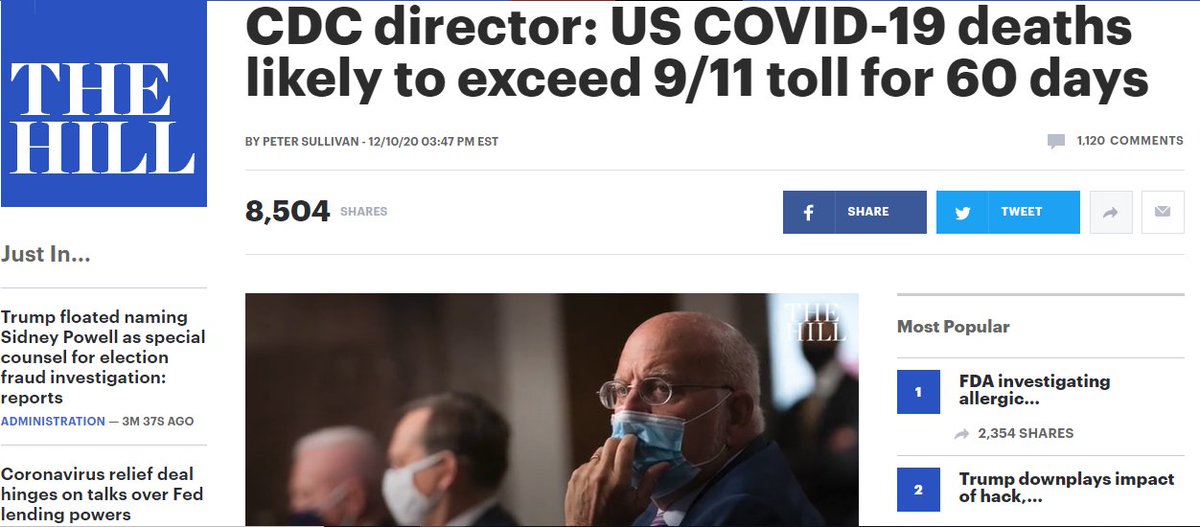
"For the next 60 to 90 days, we’re going to have more deaths per day than we had on 9/11 or Pearl Harbor," said CDC Director Robert Redfield.
2605 Americans died on 9/11.
That's 156,300 over 60 days.
234,450 over 90 days.
There have been 312,636 total covid deaths this yr.
3/
2605 Americans died on 9/11.
That's 156,300 over 60 days.
234,450 over 90 days.
There have been 312,636 total covid deaths this yr.
3/
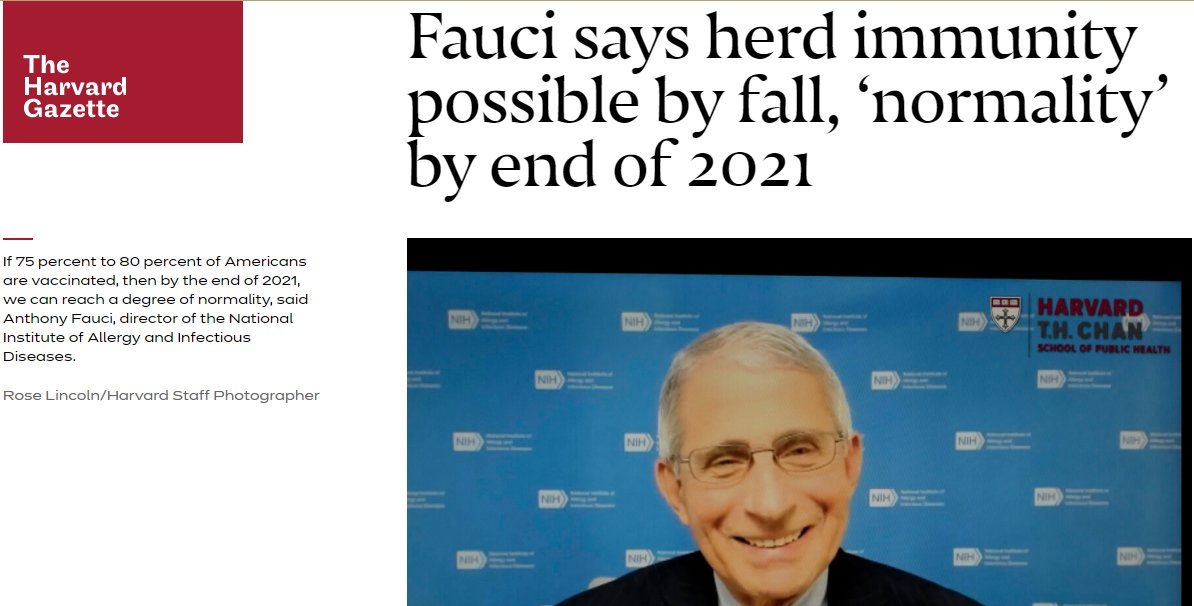
We won't get back to "normal" until the Fall, according to Fauci.
In the meantime, how much death will we tolerate?
That's the question.
We need "pro-life" Republicans & Christians to step up and prove how much they care about life.
4/
In the meantime, how much death will we tolerate?
That's the question.
We need "pro-life" Republicans & Christians to step up and prove how much they care about life.
4/
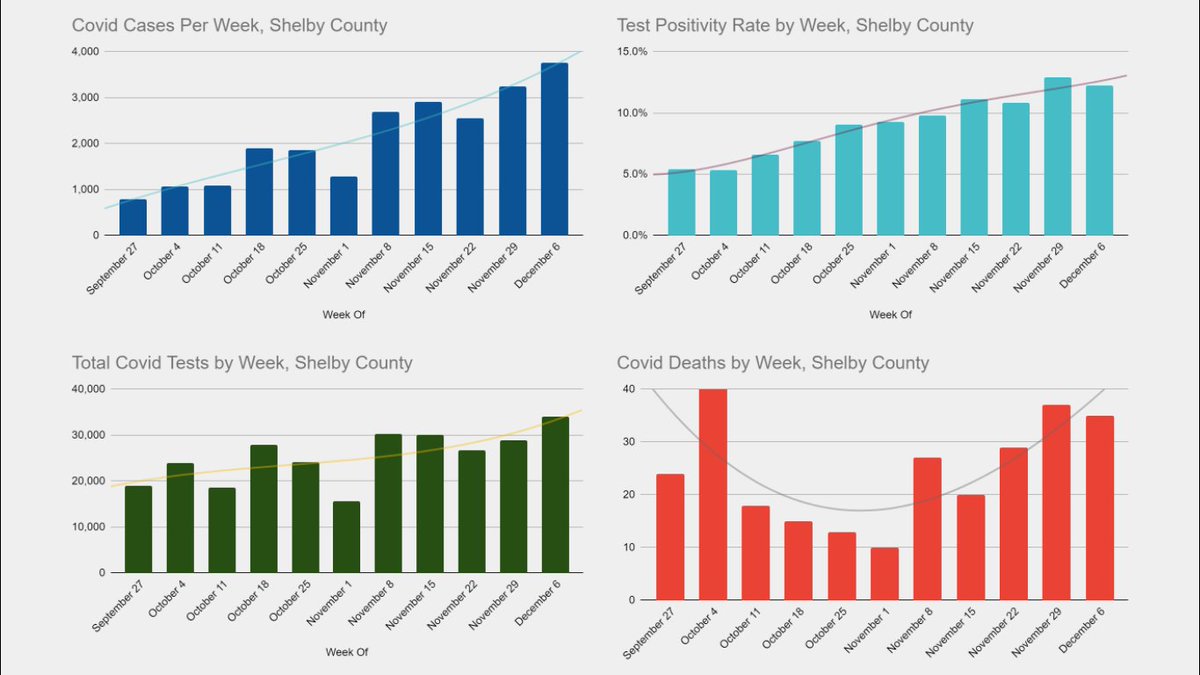
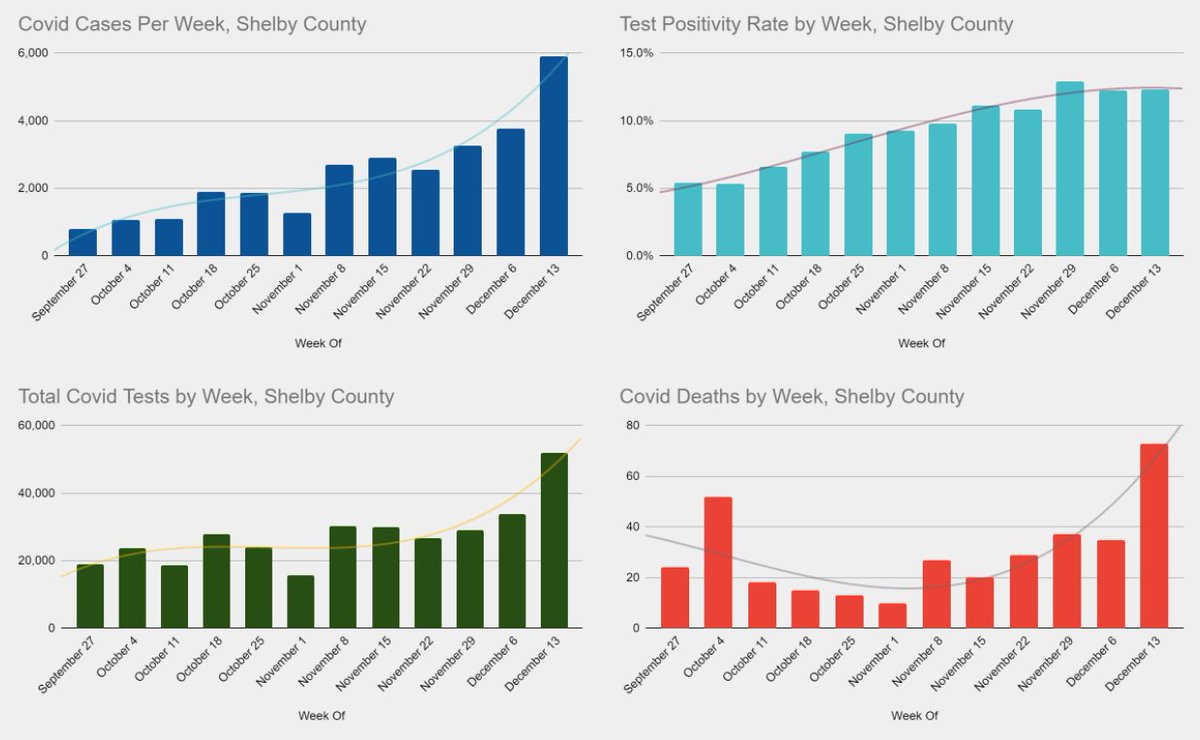
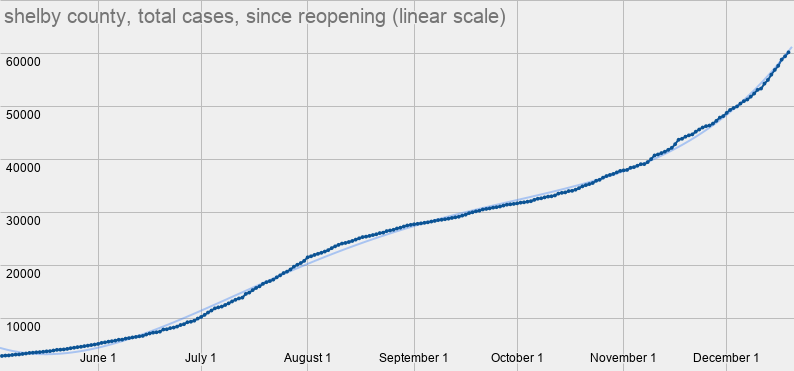
Okay, now let's shift to local data.
Here are total cases, graphed on a linear scale.
Notice how the shape of the graph has changed since the beginning of Oct.
We're looking at exponential growth.
5/
Here are total cases, graphed on a linear scale.
Notice how the shape of the graph has changed since the beginning of Oct.
We're looking at exponential growth.
5/
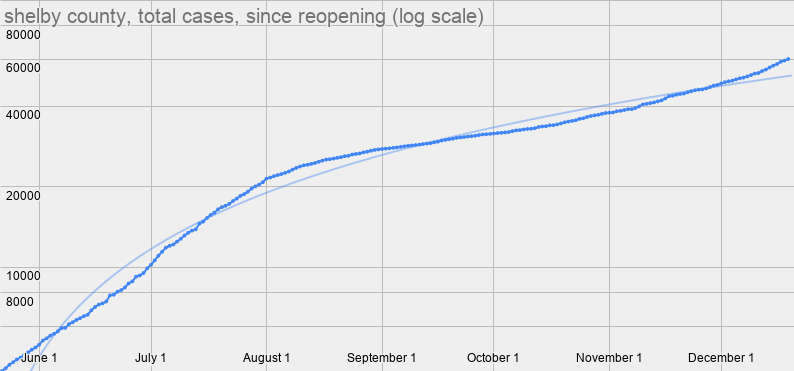
Here are total cases on the log scale.
Look at how we started to flatten the curve in Aug thru Sept. Then look at what happened in Oct & Nov.
And look especially at Dec.
This is a scary chart.
The virus is absolutely out of control.
6/
Look at how we started to flatten the curve in Aug thru Sept. Then look at what happened in Oct & Nov.
And look especially at Dec.
This is a scary chart.
The virus is absolutely out of control.
6/
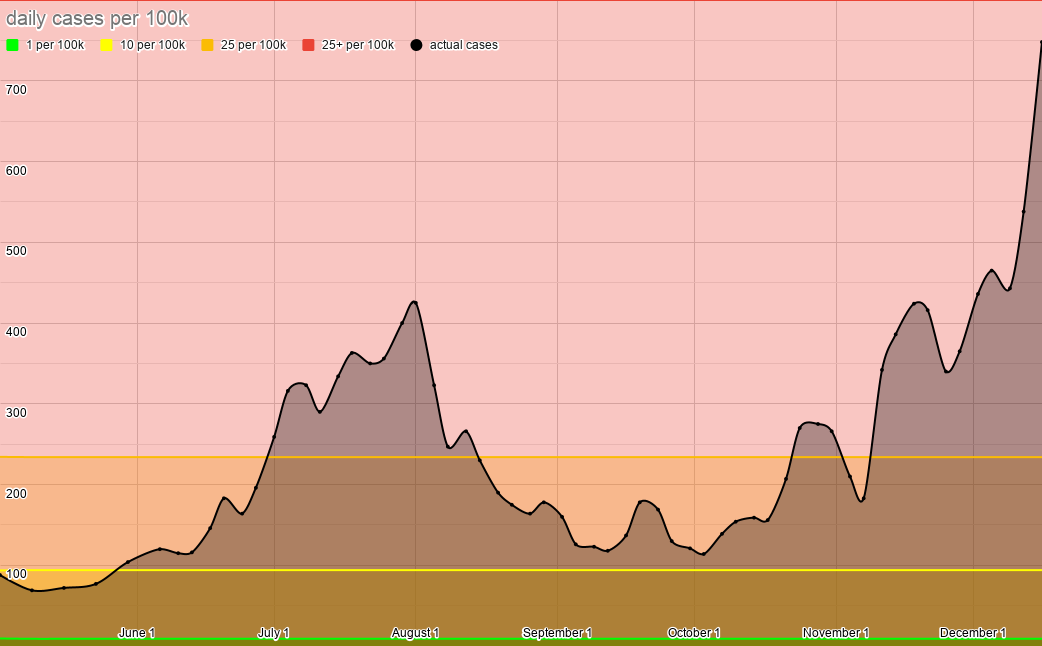
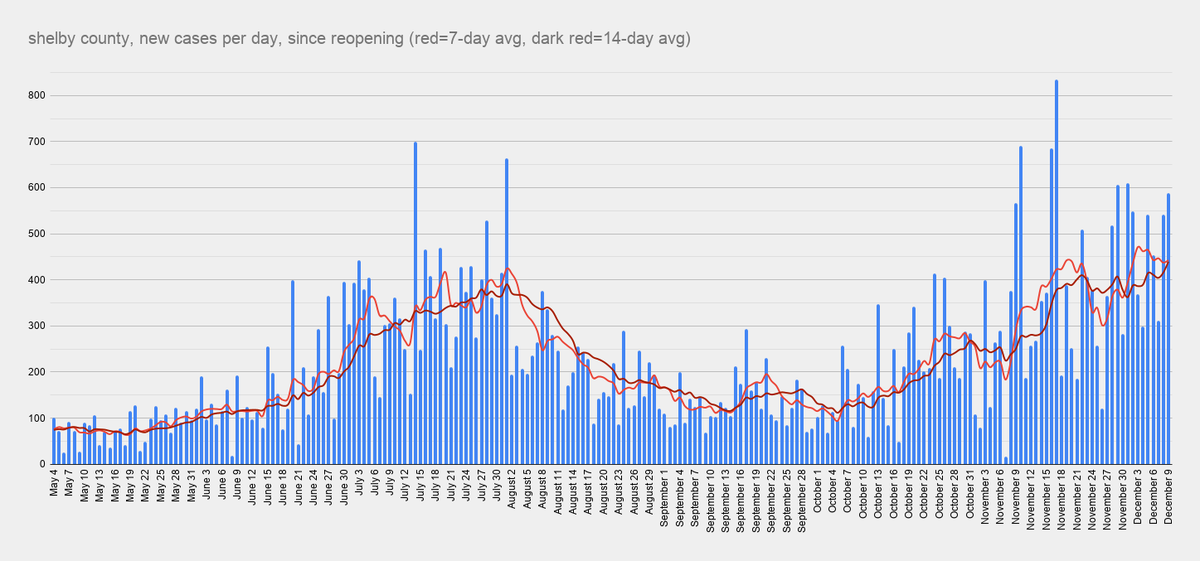
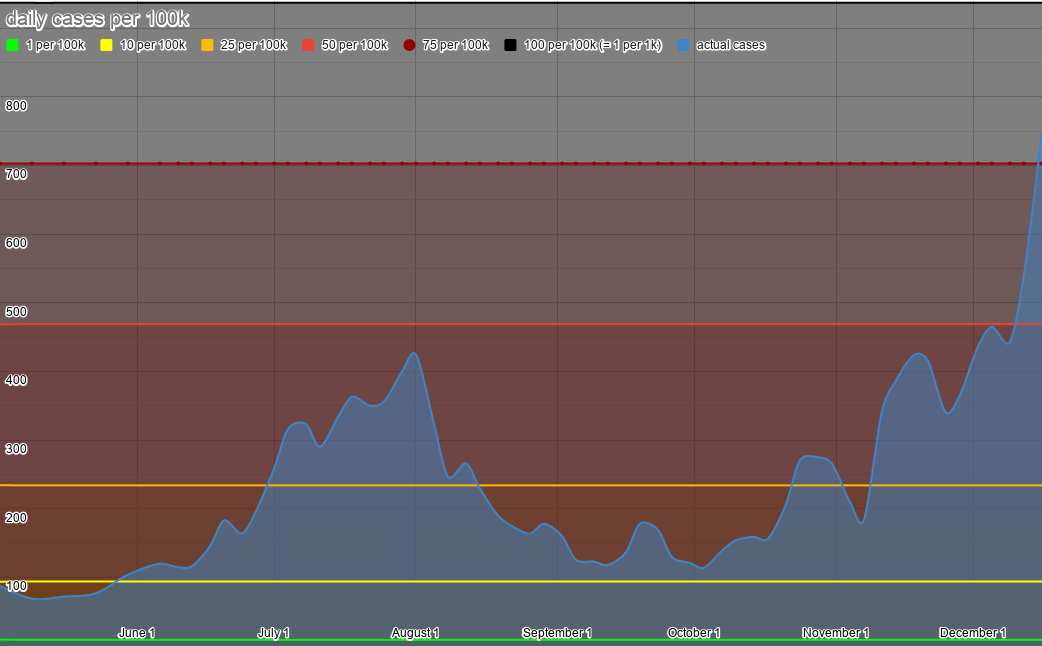
Here is our case rate over time. This is scary too.
We're up to 90 daily cases per 100k.
We'll be up to 100 per 100k next wk.
That's 1 new case per every 1,000 ppl each day.
7/
We're up to 90 daily cases per 100k.
We'll be up to 100 per 100k next wk.
That's 1 new case per every 1,000 ppl each day.
7/
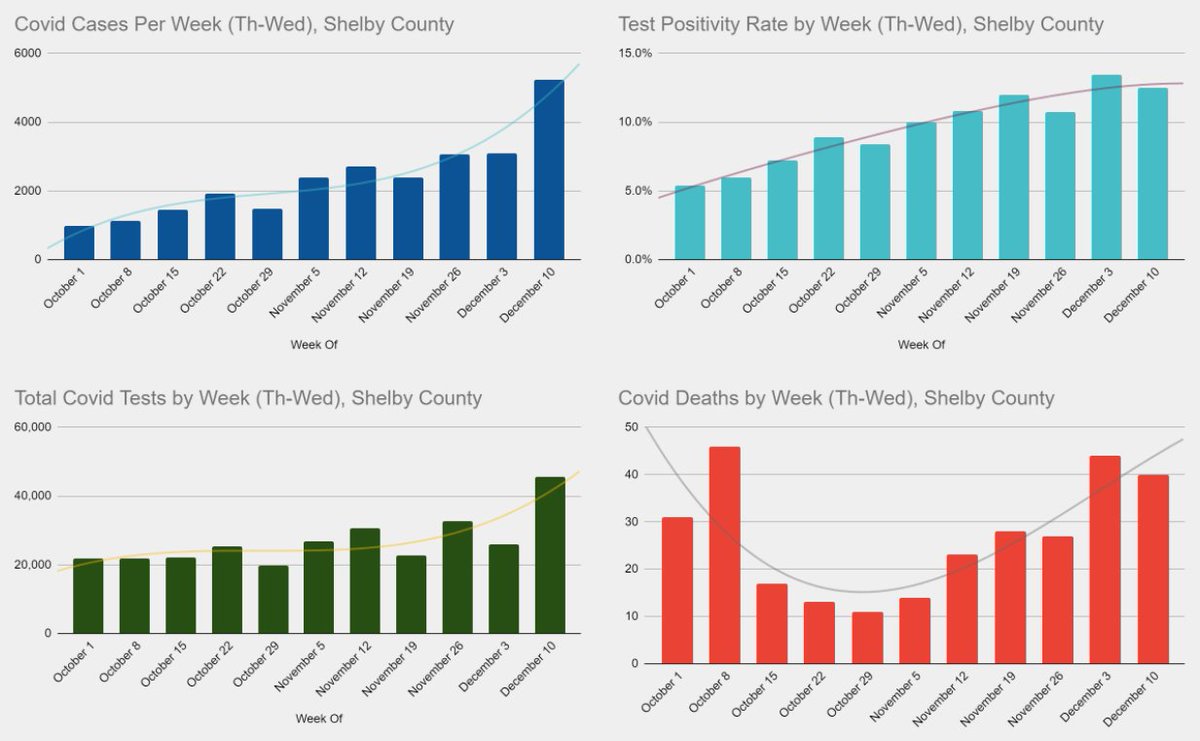
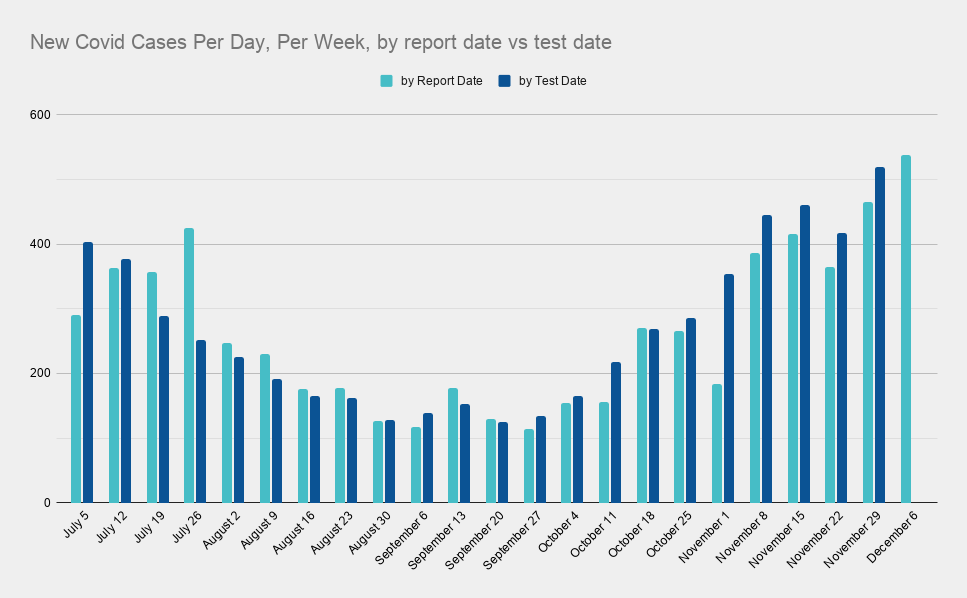
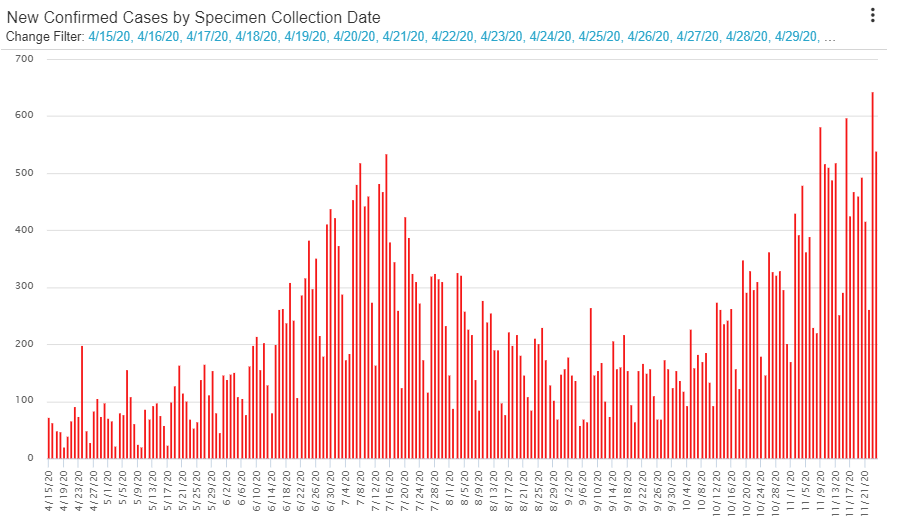
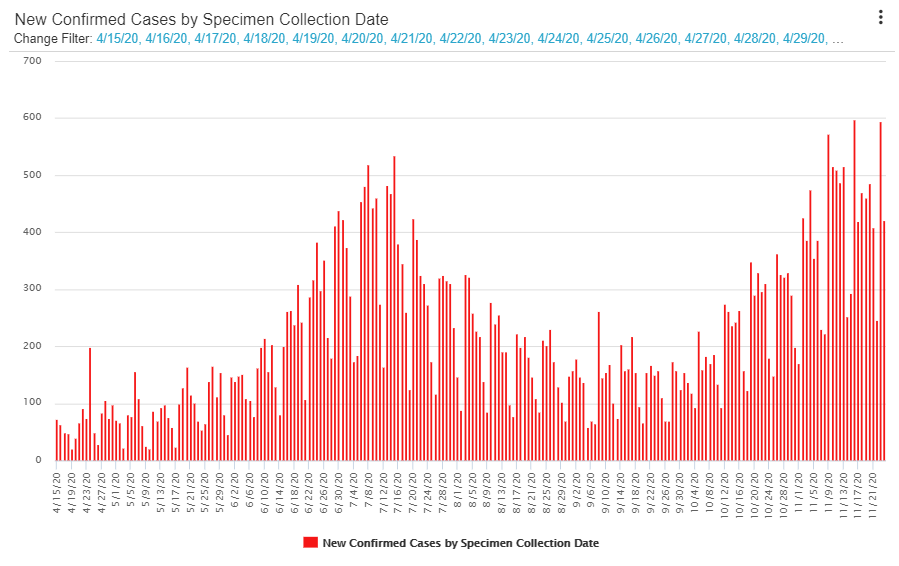
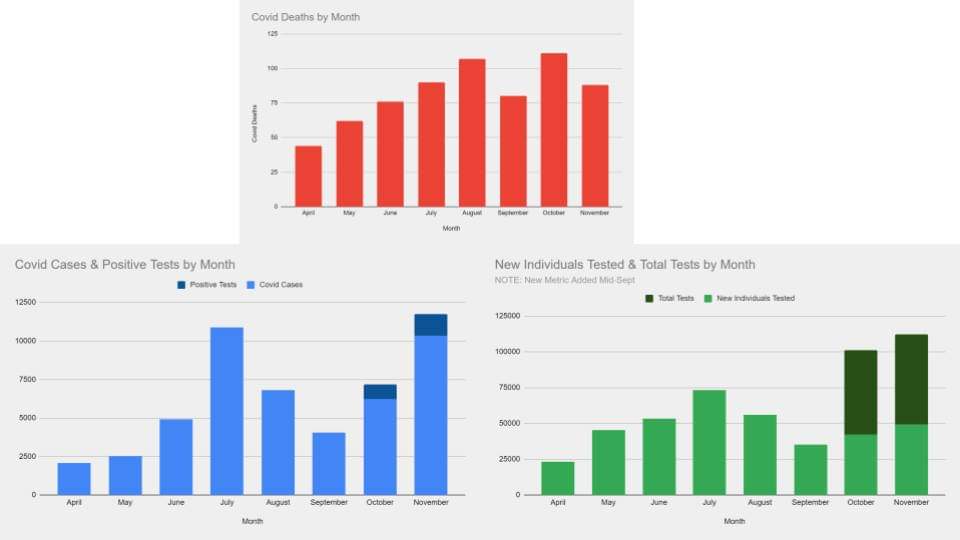
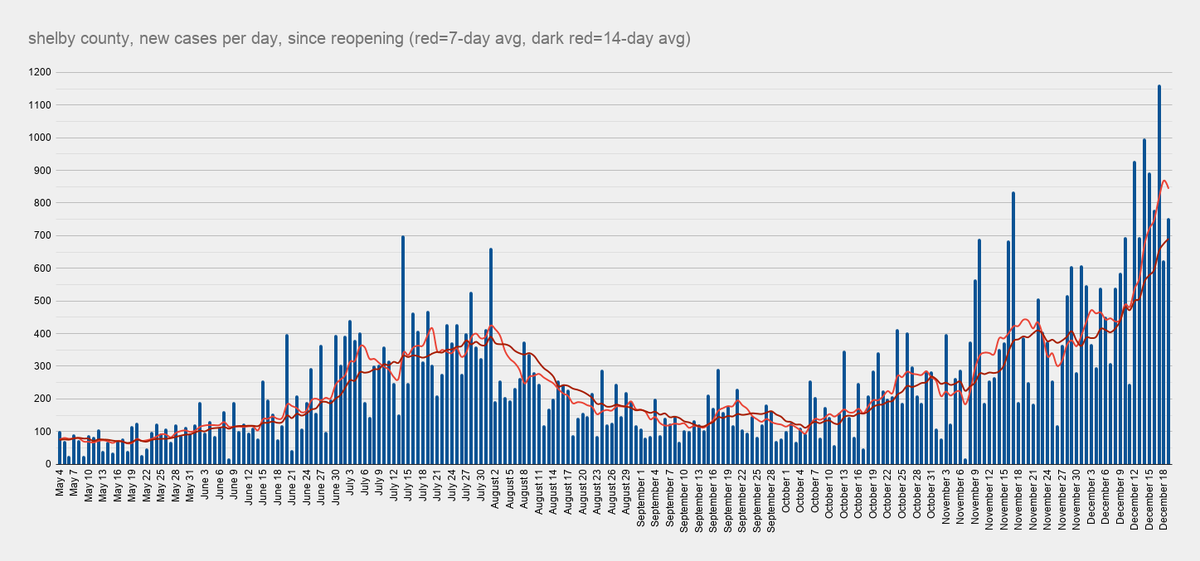
Here are daily cases, by report date.
We're avg'ing 844 new cases per day.
8/
We're avg'ing 844 new cases per day.
8/
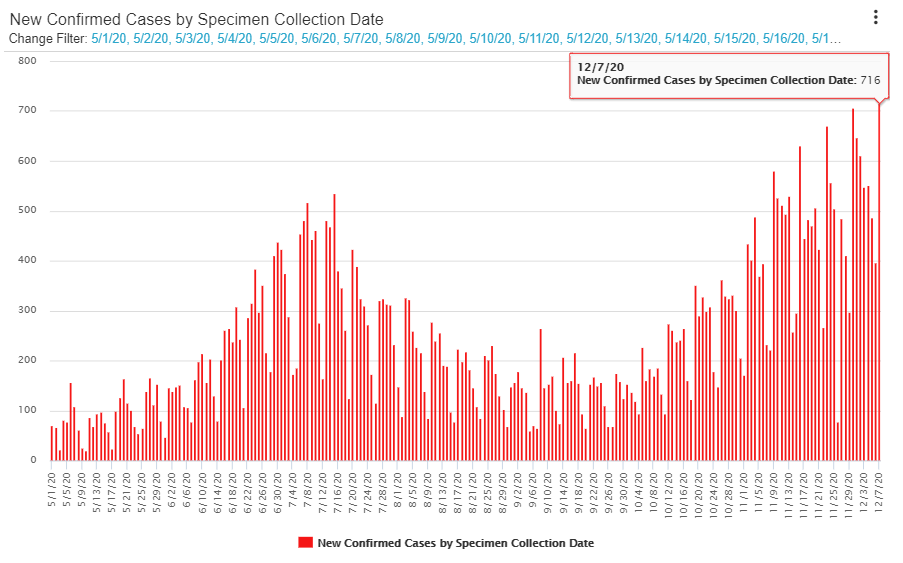
Here are cases per day, by test date. There's a lag, so it only goes thru Dec7.
But here are the Top-10 days thru Dec7
716, Dec7 Mon
706, Nov30 Mon
671, Nov23 Mon
646, Dec1 Tues
630, Nov16 Mon
610, Dec2 Wed
581, Nov9 Mon
557, Nov24 Tues
552, Dec4 Fri
547, Dec3 Th
9/
But here are the Top-10 days thru Dec7
716, Dec7 Mon
706, Nov30 Mon
671, Nov23 Mon
646, Dec1 Tues
630, Nov16 Mon
610, Dec2 Wed
581, Nov9 Mon
557, Nov24 Tues
552, Dec4 Fri
547, Dec3 Th
9/
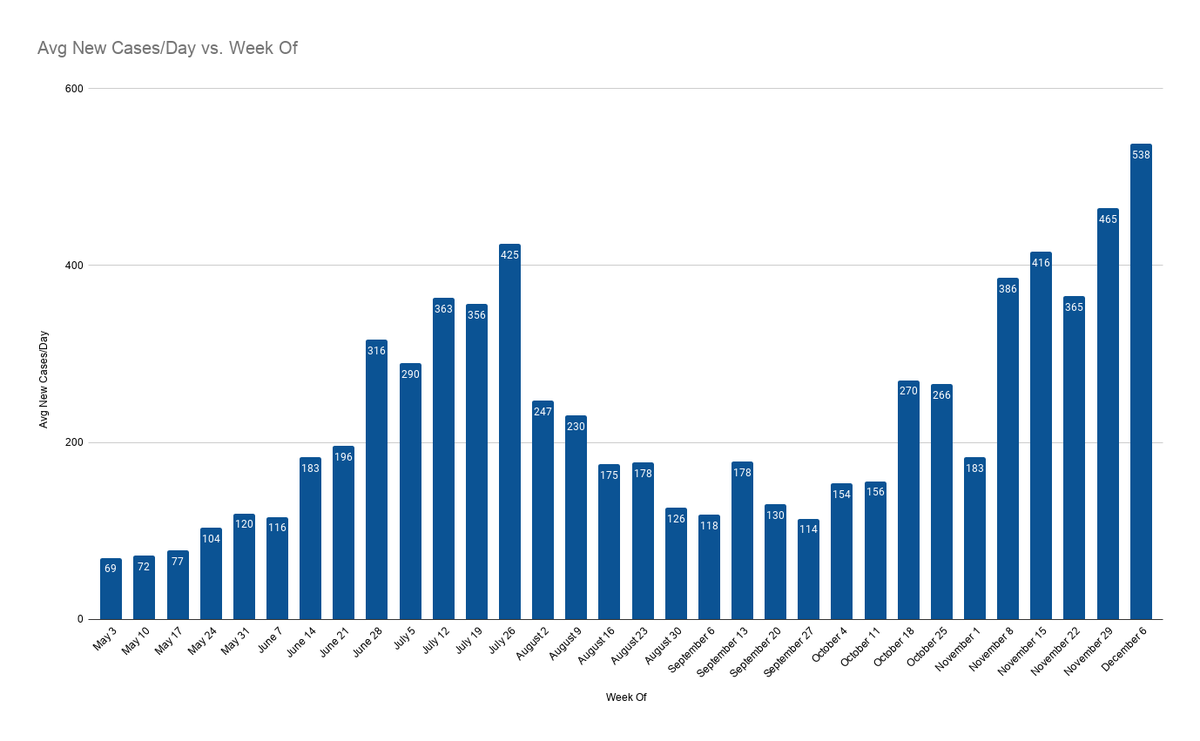
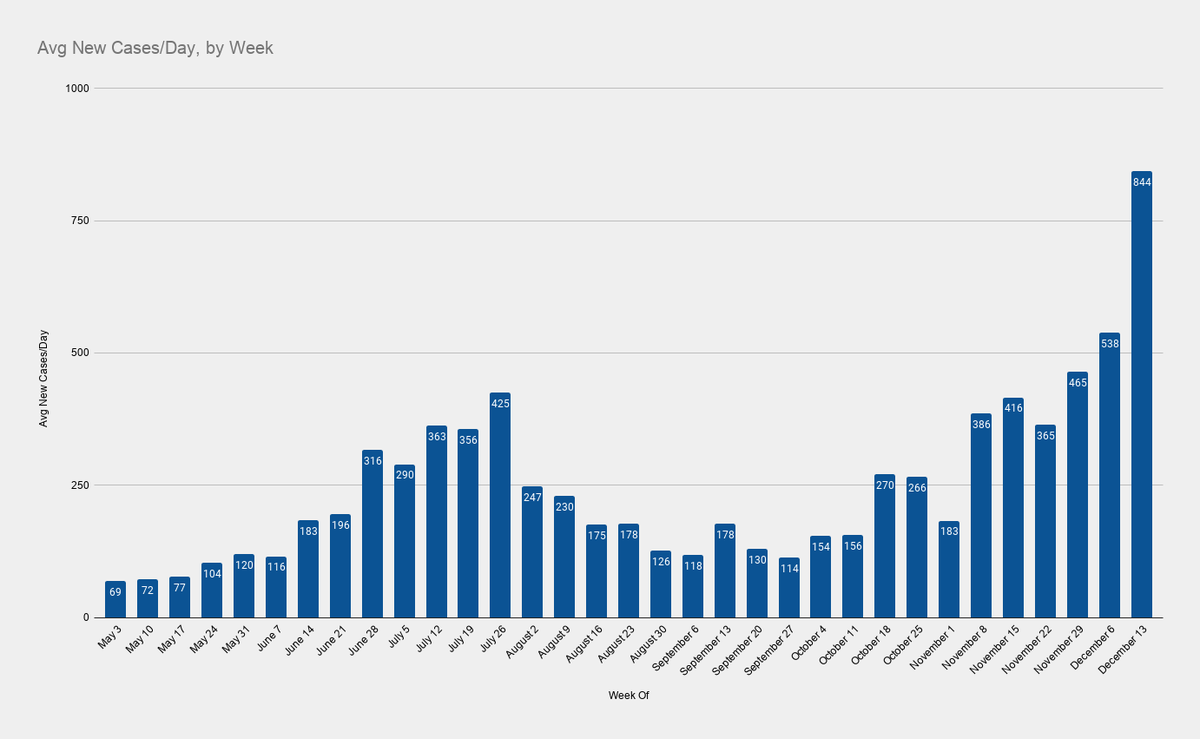
Here are avg daily cases by wk, by report date.
+57% over 1wk (vs testing +53%)
+81% over 2wks (+80%)
+103% over 4wks (+73%)
+449% over 10wks (+118%)
+642% over 11wks (+174%)
10/
+57% over 1wk (vs testing +53%)
+81% over 2wks (+80%)
+103% over 4wks (+73%)
+449% over 10wks (+118%)
+642% over 11wks (+174%)
10/
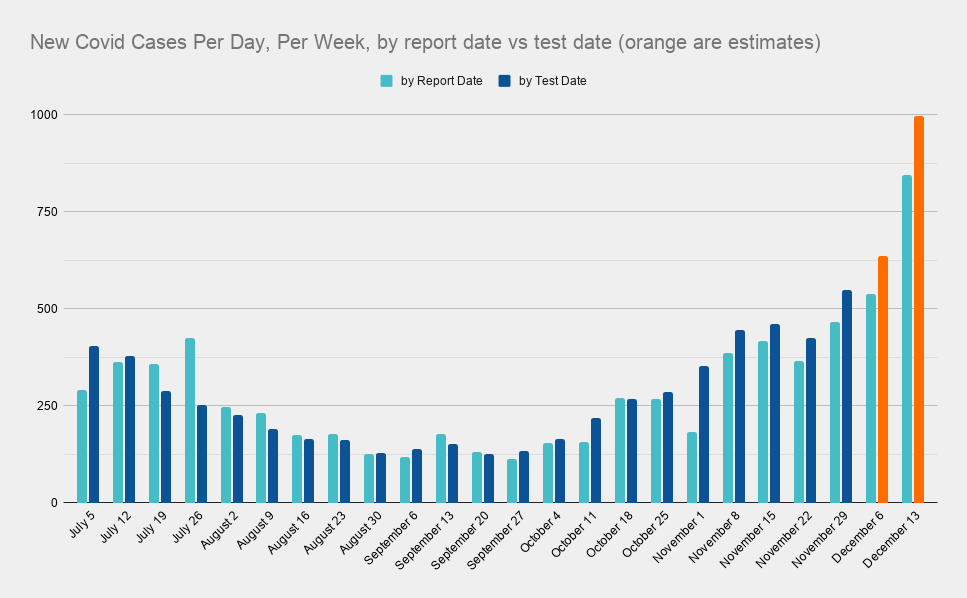
Here are avg daily cases per wk, by both report date & by test date.
The test date data only goes thru Dec7, but those cases have been about 18% higher than what was initially reported.
With that assumption, I estimate we actually avg'd 996 positive cases per day this wk.
11/
The test date data only goes thru Dec7, but those cases have been about 18% higher than what was initially reported.
With that assumption, I estimate we actually avg'd 996 positive cases per day this wk.
11/
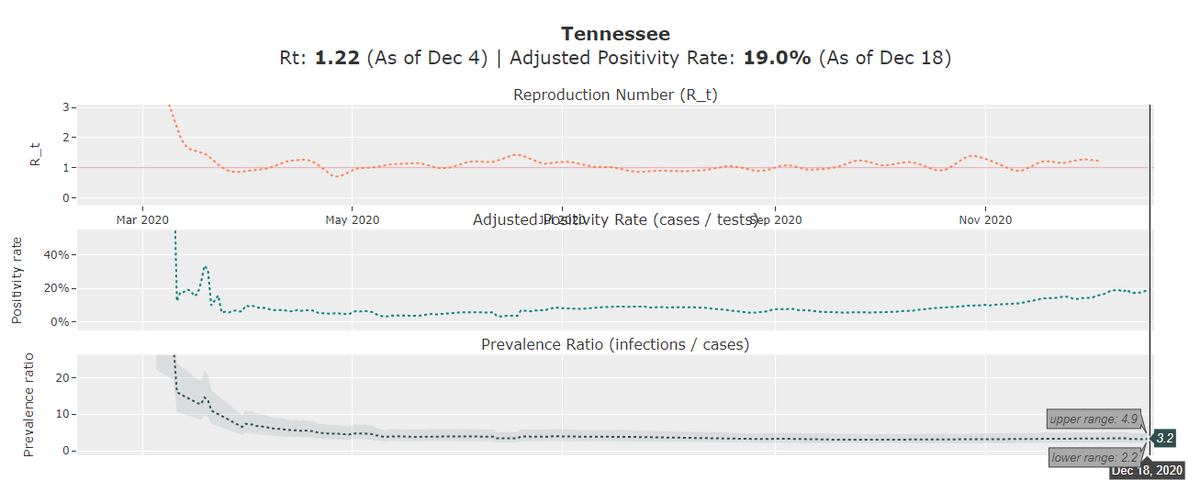
Now, @youyanggu estimates that there are actually 3.2 infections for every 1 positive test.
He built the most accurate covid forecasting model. His new model is a now-casting model.
If he's right, we actually avg'd over 3,000 new infections per day this wk.
12/
He built the most accurate covid forecasting model. His new model is a now-casting model.
If he's right, we actually avg'd over 3,000 new infections per day this wk.
12/
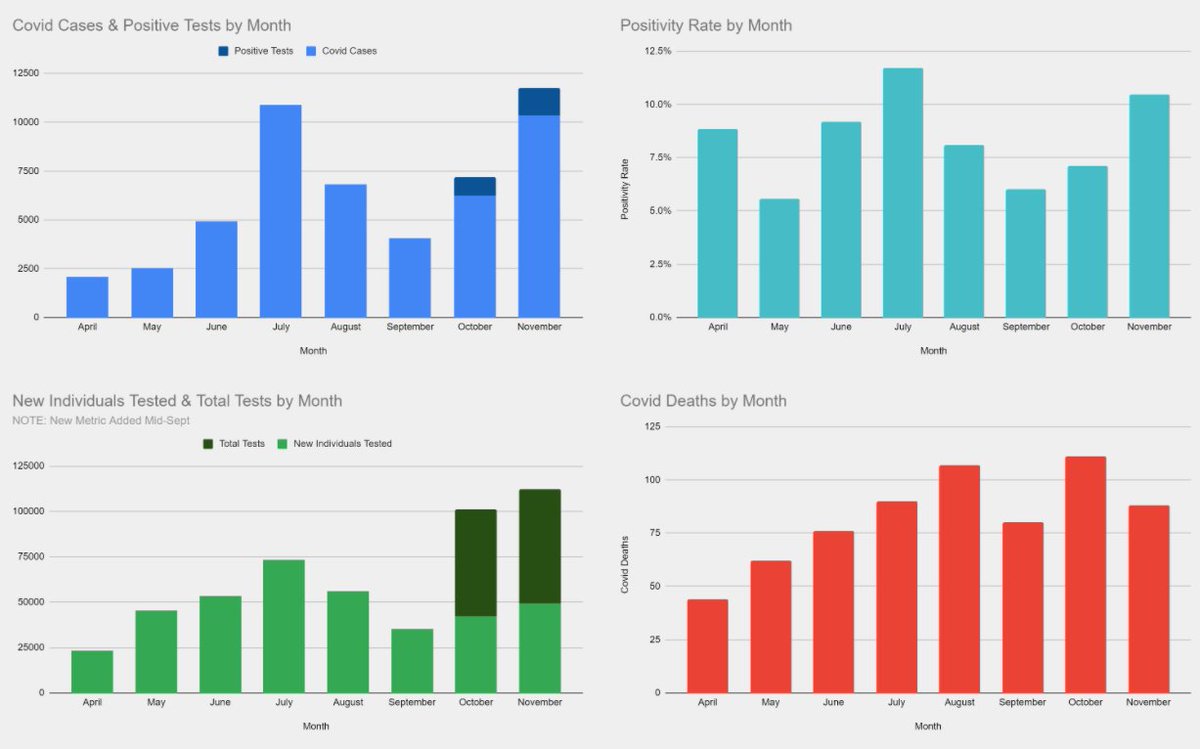
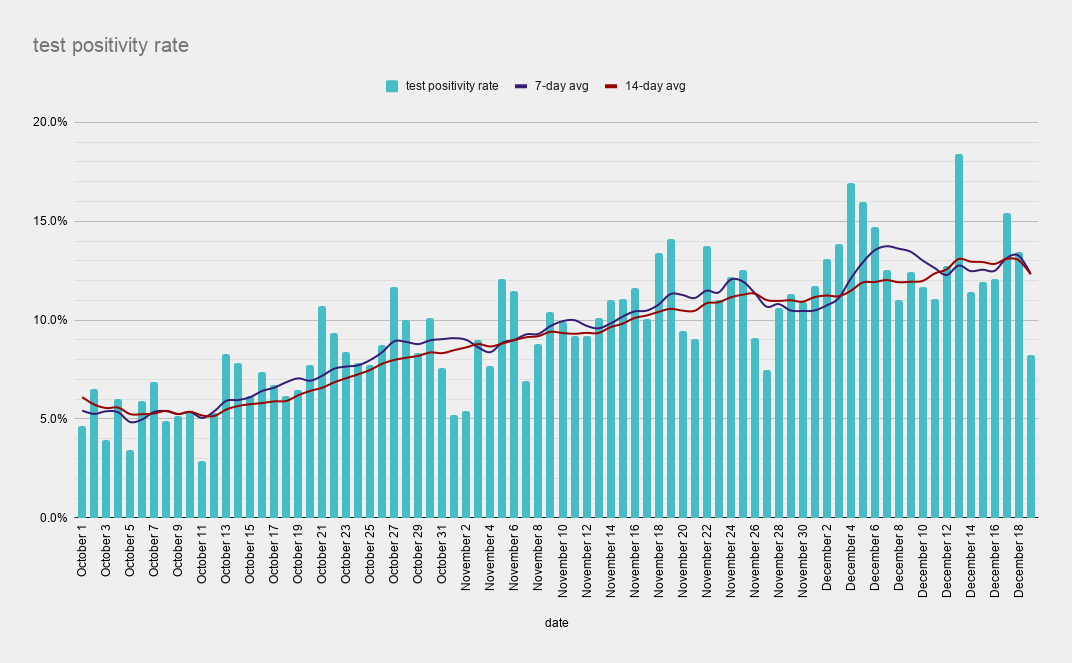
Here is test positivity rate.
The past 6wks:
9.8%
11.1%
10.8%
12.9%
12.3%
12.3%
This should be below 5%.
We should be doing more than double the testing we're doing. And bc we're not testing enough, we're missing a lot of infections.
13/
The past 6wks:
9.8%
11.1%
10.8%
12.9%
12.3%
12.3%
This should be below 5%.
We should be doing more than double the testing we're doing. And bc we're not testing enough, we're missing a lot of infections.
13/
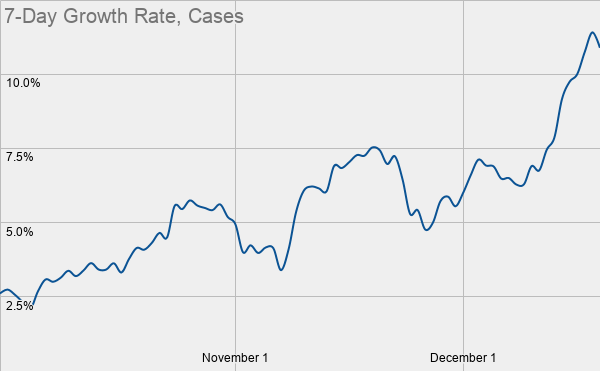
And the growth rate for new cases is skyrocketing.
The 7-day rate hit 2.1% on Oct5, then spiked all the way to 11.4% yesterday. It's at 10.9% today.
When the growth rate is constant, you have linear growth. When the growth rate is rising, you have exponential growth.
14/
The 7-day rate hit 2.1% on Oct5, then spiked all the way to 11.4% yesterday. It's at 10.9% today.
When the growth rate is constant, you have linear growth. When the growth rate is rising, you have exponential growth.
14/
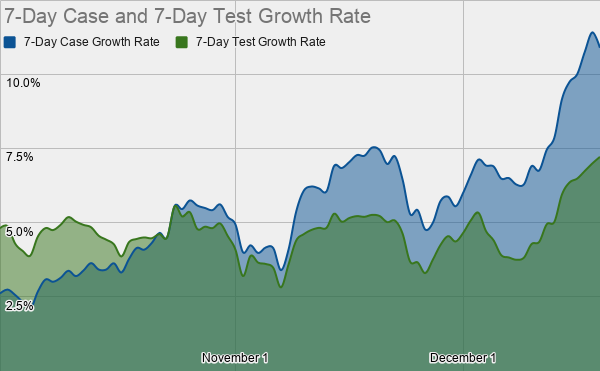
Here you can see the growth rate for cases and tests.
As you can see, test growth is not keeping up with case growth.
This is a big reason the virus is out of control.
15/
As you can see, test growth is not keeping up with case growth.
This is a big reason the virus is out of control.
15/
Here are my projections for the next month.
We will hit 1,000 avg cases per day before the end of the year, quite possibly by Christmas.
If we don't slow the spread, we'll be at 2,000 new cases per day in a month.
The virus is out of control.
16/
We will hit 1,000 avg cases per day before the end of the year, quite possibly by Christmas.
If we don't slow the spread, we'll be at 2,000 new cases per day in a month.
The virus is out of control.
16/
The first 10k cases took over 100 days.
From 10k to 20k, 28 days
30k, 52 days
40k, 52 days
50k, 25 days
We hit 60k today.
It took 14 days.
70k will come in 11 days
80k, 9 days later
90k, 8 days after that
100k, 7 days after that
17/
From 10k to 20k, 28 days
30k, 52 days
40k, 52 days
50k, 25 days
We hit 60k today.
It took 14 days.
70k will come in 11 days
80k, 9 days later
90k, 8 days after that
100k, 7 days after that
17/

It took 273 days for us to reach 50k total cases.
We're on pace to reach 100k just 49 days after that.
In other words, we will see more new cases between Dec6 & Jan23 than from the beginning of March all the way thru Dec5.
This is scary stuff.
18/
We're on pace to reach 100k just 49 days after that.
In other words, we will see more new cases between Dec6 & Jan23 than from the beginning of March all the way thru Dec5.
This is scary stuff.
18/
We just experienced our deadliest week yet. And it wasn't even close.
The 73 covid deaths this wk dwarfed the previous record of 52 back in Oct.
The thing is, ppl infected at Thanksgiving are only just now starting to die.
Expect deaths to keep rising.
19/
The 73 covid deaths this wk dwarfed the previous record of 52 back in Oct.
The thing is, ppl infected at Thanksgiving are only just now starting to die.
Expect deaths to keep rising.
19/
With 44 covid deaths reported in the past 2 days, we're now avg'ing 10 deaths per day over the past wk.
We'll be avg'ing 20 deaths per day in a few wks, 35 deaths per day a month from now.
20/
We'll be avg'ing 20 deaths per day in a few wks, 35 deaths per day a month from now.
20/
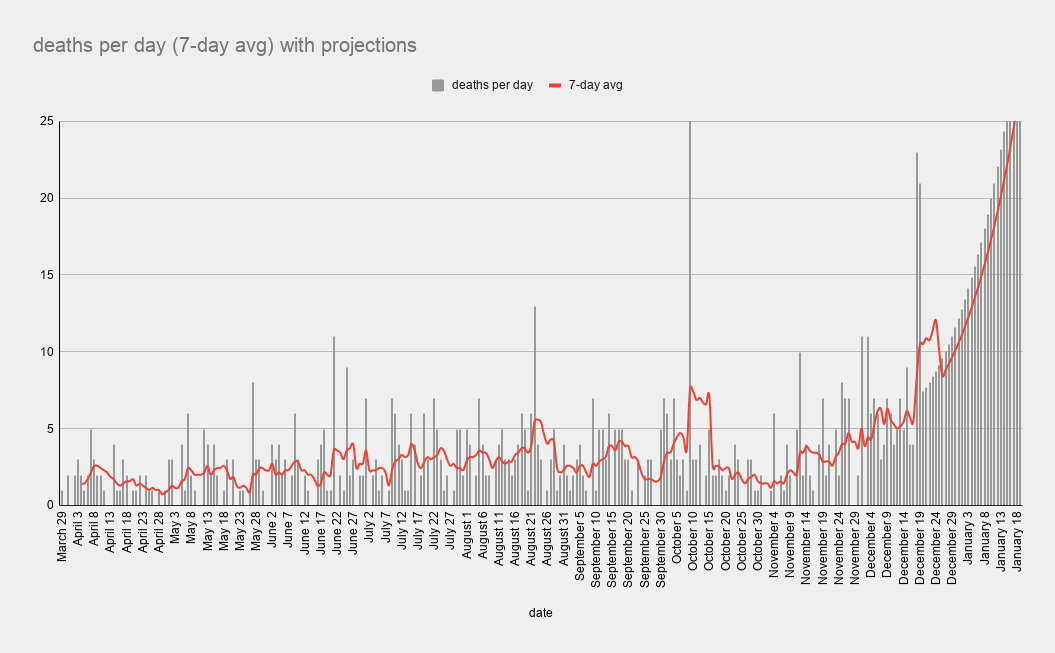
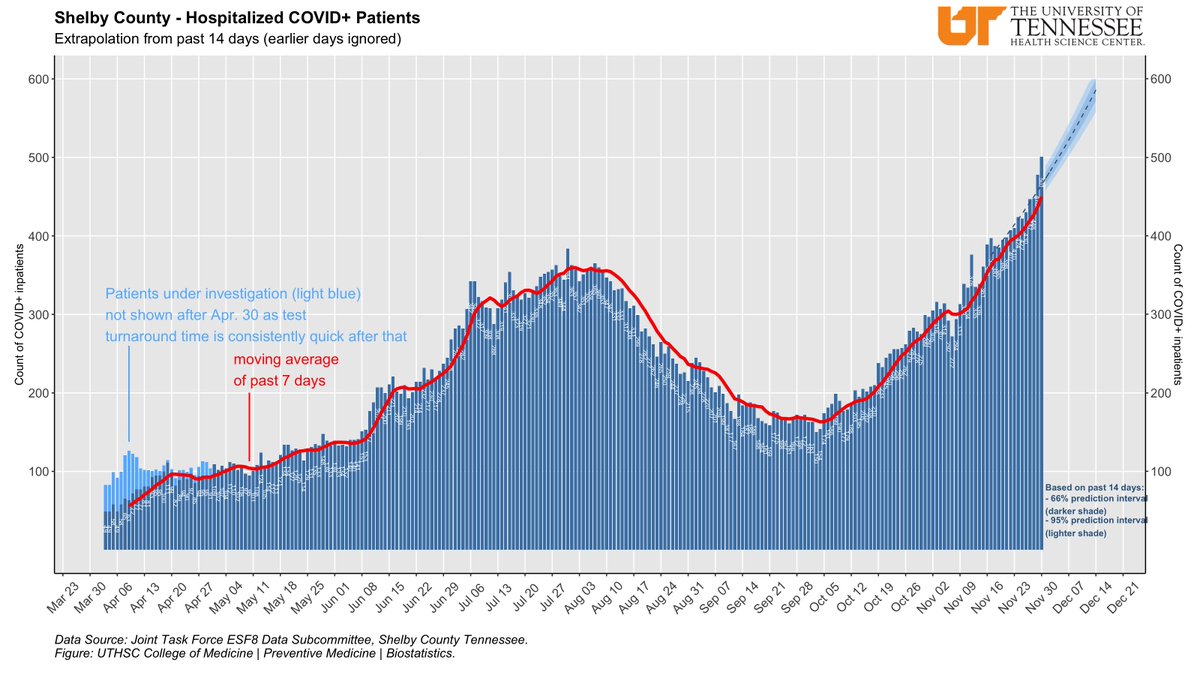
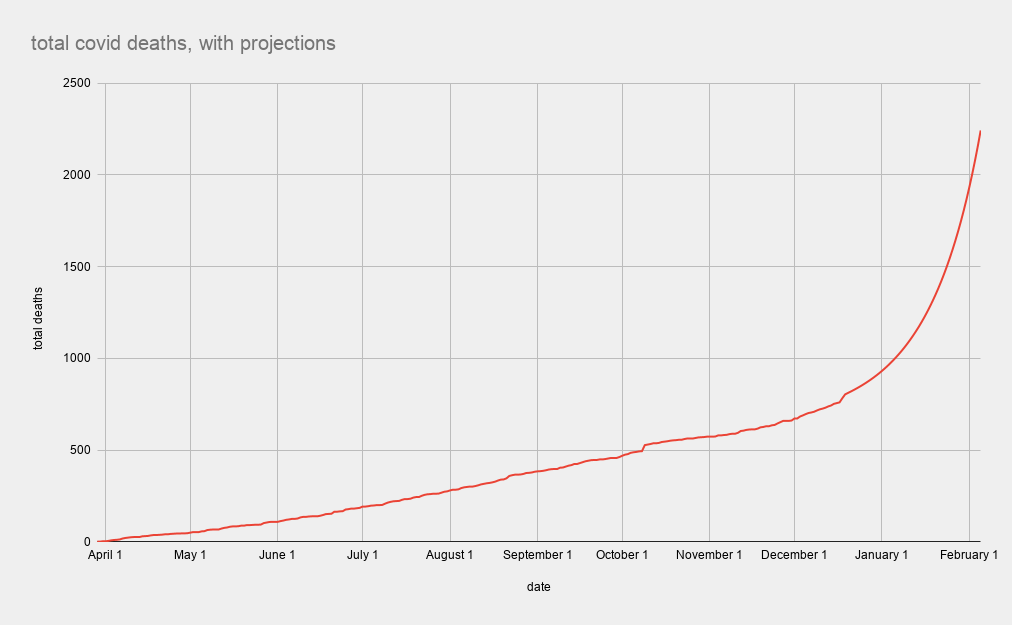
Once hospitals get overrun, deaths will skyrocket.
We hit 800 deaths today, 266 days since the first local covid death.
It will take 37 days for the next 800 deaths.
Then 12 days for the next 800.
Just 6 days for the next 800.
21/
We hit 800 deaths today, 266 days since the first local covid death.
It will take 37 days for the next 800 deaths.
Then 12 days for the next 800.
Just 6 days for the next 800.
21/
This morning, a draft of the new health directive, including safer-at-home orders to go into effect on Monday, was leaked.
If you follow @samhardiman @KathsBurgess, then you already knew this was being discussed. If you don't, you should. So go read them.
23/
If you follow @samhardiman @KathsBurgess, then you already knew this was being discussed. If you don't, you should. So go read them.
23/
The health dept made it clear in this wk's briefings that, in their minds, they had done all they could.
Safer-at-home measures, they said, were political.
And the politicians are not all on the same page.
24/
Safer-at-home measures, they said, were political.
And the politicians are not all on the same page.
24/
As @tamisawyer notes, Rep's sure do exert a lot of power in a county that is 2/3 Dem.
And I'll add, suburban munis exert a lot of power in a county where 2/3 of residents live in the City of Memphis.
So @MayorLeeHarris, who will you listen to?
25/
And I'll add, suburban munis exert a lot of power in a county where 2/3 of residents live in the City of Memphis.
So @MayorLeeHarris, who will you listen to?
https://twitter.com/tamisawyer/status/1340420611659751425
25/
It's late, and I'm tired, so I'm going to wrap things up.
I'll say it again, the virus is out of control. There is no doubt about that.
And there are no good options.
But at this point, it's either watch 1,000 ppl die over the next 6wks...or do something to save lives.
26/
I'll say it again, the virus is out of control. There is no doubt about that.
And there are no good options.
But at this point, it's either watch 1,000 ppl die over the next 6wks...or do something to save lives.
26/
And it sucks that Senate Republicans have refused to send relief to families, to small biz's, to local govt.
If you want to get mad, get mad at them.
Closing things will cause harm. Don't blame local officials for literally trying to save 1,000 lives.
27/
If you want to get mad, get mad at them.
Closing things will cause harm. Don't blame local officials for literally trying to save 1,000 lives.
27/
We know how this story ends.
But it doesn't end for at least 6 months. And the next 3 months will reveal a lot about us.
We have a chance to save thousands of lives.
Are we the kind of ppl who sacrifice to save those lives?
Or are we ppl who allow thousands to death?
28/28
But it doesn't end for at least 6 months. And the next 3 months will reveal a lot about us.
We have a chance to save thousands of lives.
Are we the kind of ppl who sacrifice to save those lives?
Or are we ppl who allow thousands to death?
28/28
• • •
Missing some Tweet in this thread? You can try to
force a refresh