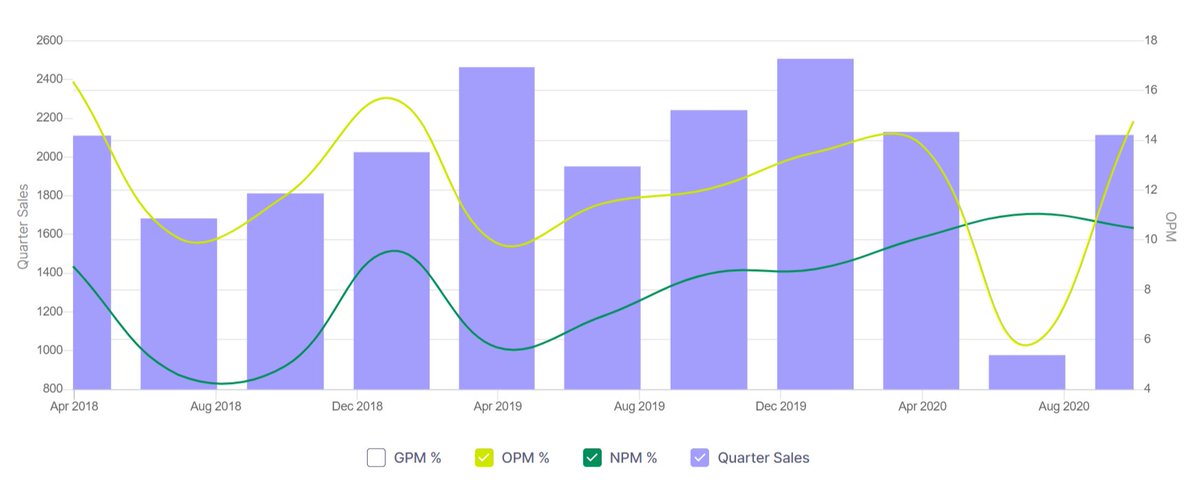
#Nestle valuation

History :
Sales trend :
Profit trend :
Profit growth rate :
Future EPS projection :

2025 EPS : 574rs/share
2030 EPS : 1360rs/share

Even at a median PE of 50x, 2030's CMP of 65k shows that one can expect 4X returns (14% CAGR) from here, but catching it at 11k pre-breakout would have given an additional +5% CAGR cushion.

• • •

Missing some Tweet in this thread? You can try to force a refresh
 

Keep Current with Generic Boi

Generic Boi Profile picture

Stay in touch and get notified when new unrolls are available from this author!

Read all threads

This Thread may be Removed Anytime!

PDF

Twitter may remove this content at anytime! Save it as PDF for later use!

Try unrolling a thread yourself!

how to unroll video
  1. Follow @ThreadReaderApp to mention us!

  2. From a Twitter thread mention us with a keyword "unroll"
@threadreaderapp unroll

Practice here first or read more on our help page!

More from @techlunatic

29 Dec
#PolyCab valuation

Pre-Corona quarterly sales : 2200
Corona dip : 50%
Current quarterly sales : 2200

It has healed from the lockdown slump. NPM has improved from 8.64% to 10.48% Image
85% revenues come from wires. Leading market share in wires segment. Image
EPS has virtually doubled in 18 months, from 25rs/share in 2019 to 50rs/share now.

ROCE 29%. This is a high growth company.

2030 projected EPS (DCF discount rate 20.12%) : 326rs/share
2030 CMP= 6520 (Median PE (20) x 326)
Read 6 tweets
28 Dec
#VGuard valuation.

Pre-Covid quarter sales : 620
Corona quarter sales : 405
Current quarter sales : 620

NPM improved from 7.5% to 8.11%

Sales are back to previous glory, NPM has improved. Potential turnaround story. Image
DCF valuation :

2030 EPS projection (discounting rate of 17.2%) = 24.3rs/share

2030 CMP = Median PE (30) x 2030's EPS
2030 CMP = 729

4X growth (~14% CAGR) expected in a decade if bought at current price.
51% monopoly in electric stabilizers and UPS backups. Image
Read 6 tweets
28 Dec
#Schaeffler valuation

2018 quarterly sales (1100/ QTR)
2020 Corona quarter (430/ QTR)
Current quarter (1100/ QTR)

Sales, profit margin, EPS, all have recovered to previous glory. CMP's languishing because the crowd is busy chasing momentum in Pharma. Potential turnaround story. ImageImage
DCF valuation.

2030 projected EPS at 14.6% discount rate= 960rs/share

2030 CMP= 960 x median PE(20): 19,200
Potential risks: Revenues (B2B) come from industrials & automobile sector. Both are cyclical in nature and rely on other cyclical factors like steel prices and interest rates.

All alpha comes from buying at the bottom & riding till tailwinds last. Keep <3% exposure in portfolio. Image
Read 5 tweets
28 Dec
Don't let the crowd's madness clout your judgment.

At any point, 40% up/down is speculative froth from momentum chasers. On the first -10% correction, the speculators all jump off the ship and the stock falls another 30%. 1-2-3 provides cleaner entry point for real investors. Image
@Goldsmithgunner

Fundamentals aside, #3MIndia was available at 15.8k & 23k in a short time span. 46% price difference due to crowd behavior.

21k is still a good price. This will become apparent at 26k. THEN brokerages will invite people giving 29k target celebrating 10% upside.
Some big institutional buyer has punched in a massive buy volume of 55,000 stocks on Dec 1,2, at 21k. He also knows that PE is 144, still he's buying with confidence. And retail investors are busy trying to outsmart destiny by buying cheap stocks because Warren chacha said so. Image
Read 5 tweets
26 Dec
My Excel sheet valuation of #Britannia

History : Image
Historical growth trends : 15% Image
Discounting future revenues at 15%, we get 2030 EPS projection as 327rs/share.

Multiplying this EPS with a pessimistic PE multiple of 30, we get 2030 CMP= 9810, and at a PE multiple of 50, we get CMP= 16,350.

4X to 5X growth from current rates. Image
Read 4 tweets
26 Dec
My Excel sheet based fundamental Analysis of #Kajaria

ZERO trendline/momentum, chart pattern, candle stick mumbo jumbo. Pure fundamentals.

Step 1 : Background checks👇
Step 2 : Sales analysis

Notice how the 'trendline' of sales shows a smooth, steady rise in revenues Y-o-Y, unlike the stock price which is deceptively zigzag, which clouts one's objective judgment.
Step 3 : Profit analysis

Notice how, unlike revenues, profit tends to be slightly more volatile, reason being the fluctuating raw material prices.

One can see why there was a breakout in 2014.

Hint : it wasn't because of "green bullish engulfing candle" or any other candle🤦‍♂️
Read 7 tweets

Did Thread Reader help you today?

Support us! We are indie developers!


This site is made by just two indie developers on a laptop doing marketing, support and development! Read more about the story.

Become a Premium Member ($3/month or $30/year) and get exclusive features!

Become Premium

Too expensive? Make a small donation by buying us coffee ($5) or help with server cost ($10)

Donate via Paypal Become our Patreon

Thank you for your support!

Follow Us on Twitter!