#Schaeffler valuation
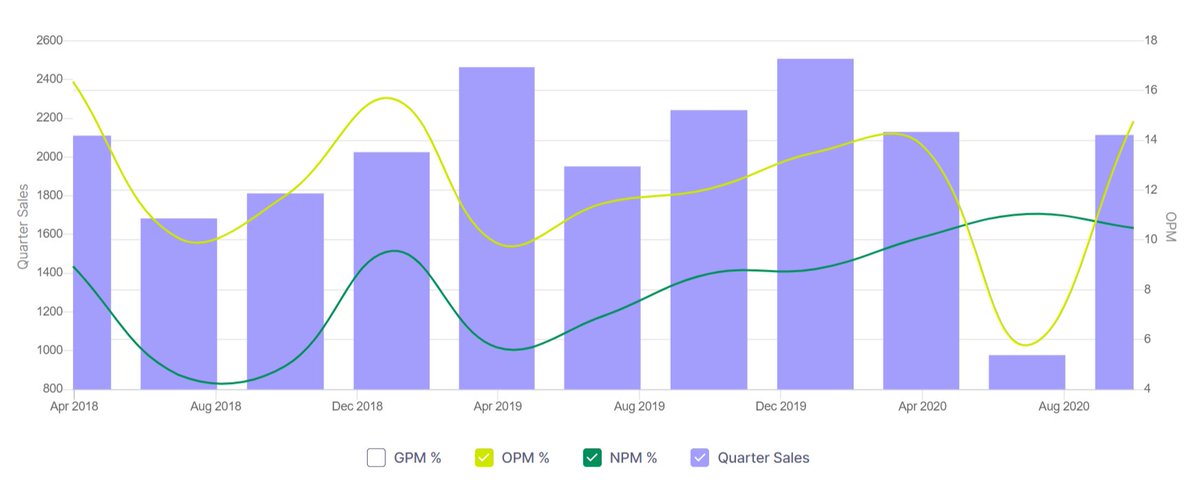
2018 quarterly sales (1100/ QTR)
2020 Corona quarter (430/ QTR)
Current quarter (1100/ QTR)
Sales, profit margin, EPS, all have recovered to previous glory. CMP's languishing because the crowd is busy chasing momentum in Pharma. Potential turnaround story.

2018 quarterly sales (1100/ QTR)
2020 Corona quarter (430/ QTR)
Current quarter (1100/ QTR)
Sales, profit margin, EPS, all have recovered to previous glory. CMP's languishing because the crowd is busy chasing momentum in Pharma. Potential turnaround story.


DCF valuation.
2030 projected EPS at 14.6% discount rate= 960rs/share
2030 CMP= 960 x median PE(20): 19,200
2030 projected EPS at 14.6% discount rate= 960rs/share
2030 CMP= 960 x median PE(20): 19,200
Potential risks: Revenues (B2B) come from industrials & automobile sector. Both are cyclical in nature and rely on other cyclical factors like steel prices and interest rates.
All alpha comes from buying at the bottom & riding till tailwinds last. Keep <3% exposure in portfolio.
All alpha comes from buying at the bottom & riding till tailwinds last. Keep <3% exposure in portfolio.

Took a hit during previous Auto slowdown in 2018-19. Could repeat this heart burn in any future trouble in the Auto sector. Conversely, if India manages to become a global contract manufacturing hub, this might even become a multibagger. Be open to both possibilities. 

My personal take: I would prefer buying this ancillary company instead of investing in Maruti, Tata or M&M.
Duopoly in its segment (nearest competitor being NRB bearings).
Schaeffler (3% of portfolio) + Balkrishna tyres (4%) makes up my entire Automobile sector exposure.
Duopoly in its segment (nearest competitor being NRB bearings).
Schaeffler (3% of portfolio) + Balkrishna tyres (4%) makes up my entire Automobile sector exposure.
• • •
Missing some Tweet in this thread? You can try to
force a refresh


