You may have heard this metaphor before, but the details are fun to consider. It also helps explain Bitcoin's path to scaling up to handle the entire world's transactions.
A thread...
In 2019, 802M containers were shipped.
A large container ship holds 8,000 containers. If an average one holds 4,000 containers, this means ~200k container ship journeys per year.
Dollars, gold, #Bitcoin - which is the best for storing your hard earned money?
----
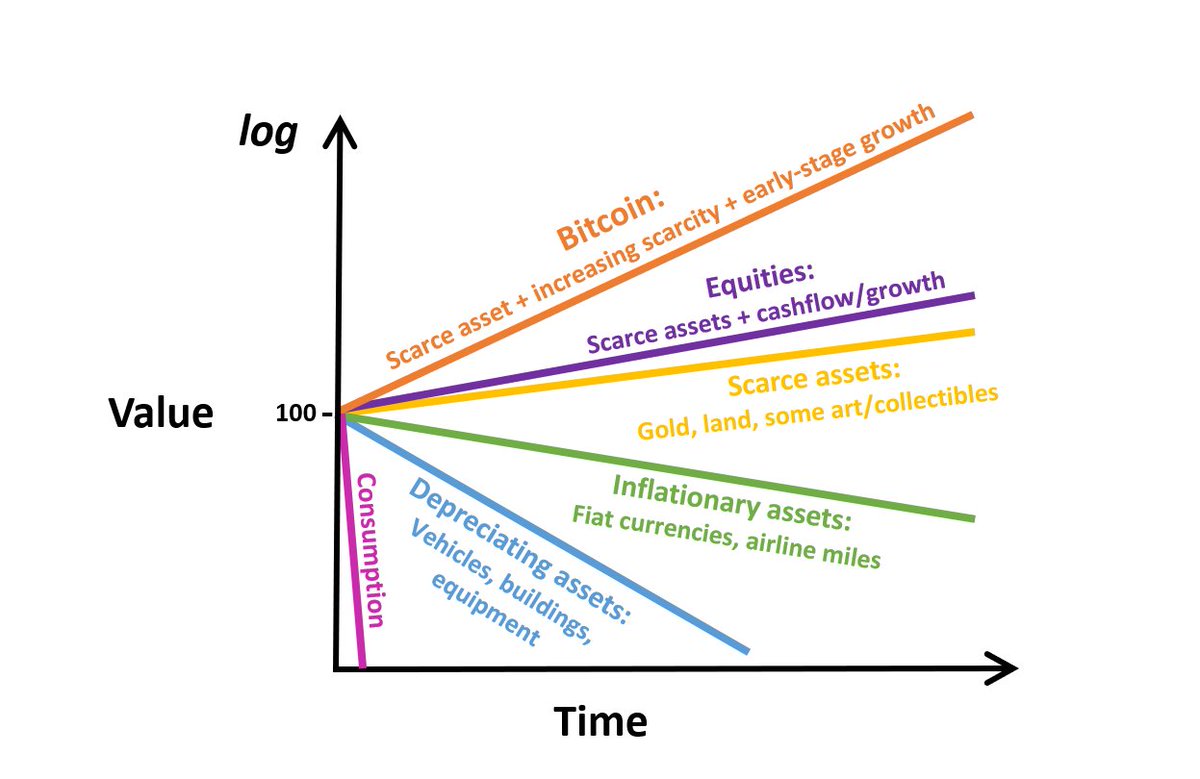
All forms of money grow in total value as the global economy grows. What differs is how they do it.
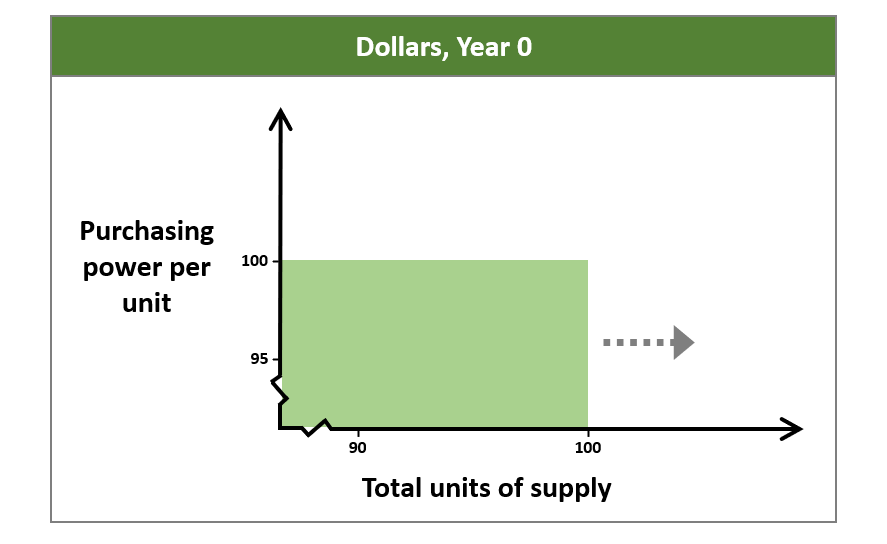
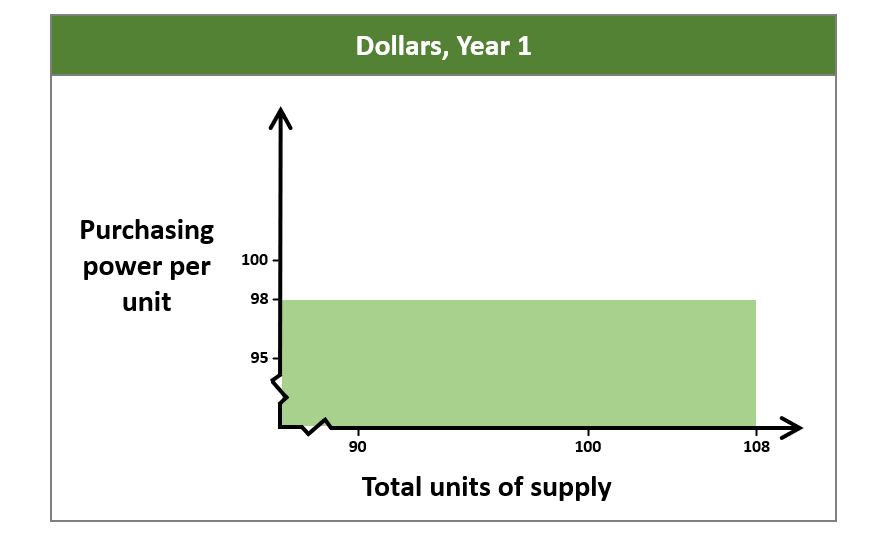
The U.S. prints as many dollars as needed to achieve 2% inflation.
The only way to do this is to pull supply out to the right far enough that it deflates the purchasing power of all existing dollars by ~2%. (For your own good!)
As time goes on and Bitcoin's network effect grows, educational content gets better, UX/UI of onramps and services get simpler, it gets easier for people to "get it"
Just like with the Internet in the 90s, social media, mobile, etc.
Same chart, now not in log format
If we think about how equipped everyone in the world is to understand that Bitcoin is on a trajectory to become the world's preferred money / dominant SoV... we would have a bell curve distribution, shown here
However, as @johnkvallis pointed out to me, there are different levels of #Bitcoin adoption, and each level is at a different point in the adoption curve.
When we clearly segment these levels of Bitcoin adoption, it helps illuminate just how early it still is for Bitcoin.
For our purposes, let's segment Bitcoin adopters into four buckets: