PHE's latest COVID surveillance report now published. Covers 4th-10th Jan.
Cases rates remain astonishingly high and whilst they may be turning a corner, rates are still rising among 80yrs+.
Hospital admissions and deaths also rising fast.🧵
gov.uk/government/sta…
Cases rates remain astonishingly high and whilst they may be turning a corner, rates are still rising among 80yrs+.
Hospital admissions and deaths also rising fast.🧵
gov.uk/government/sta…

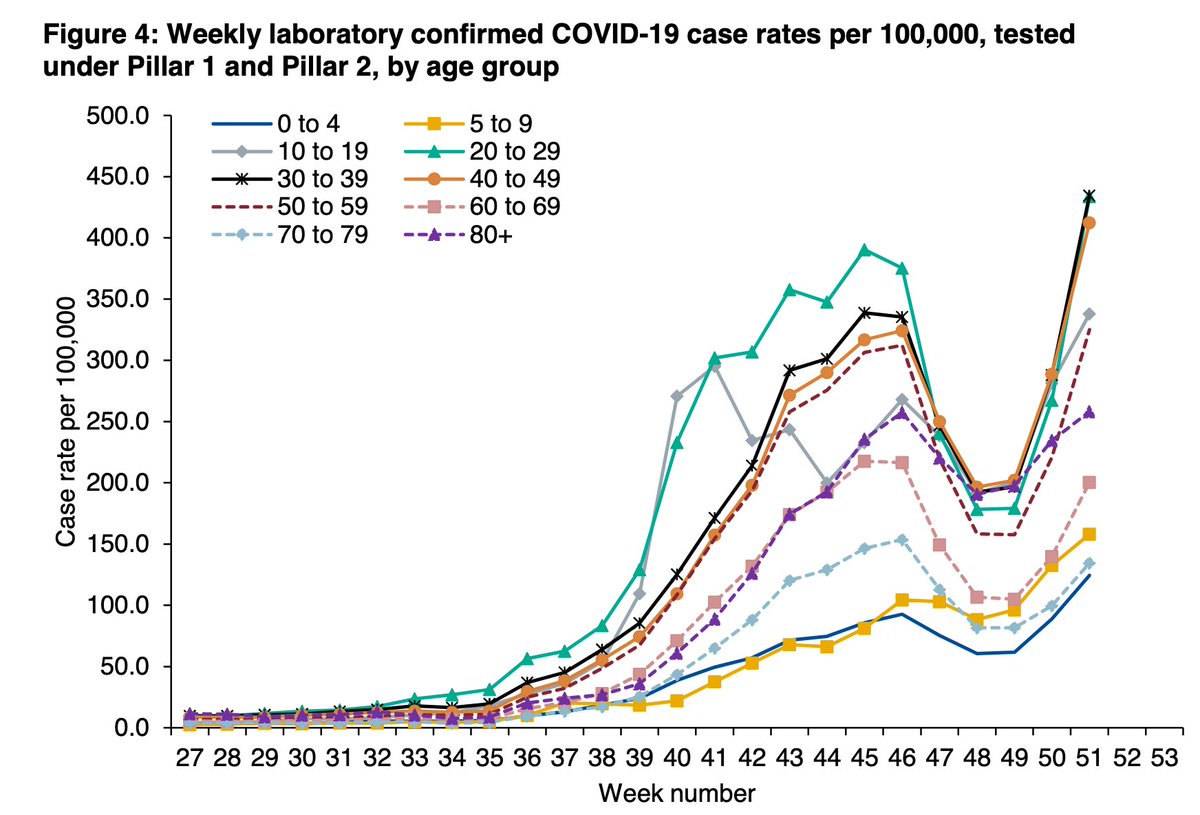
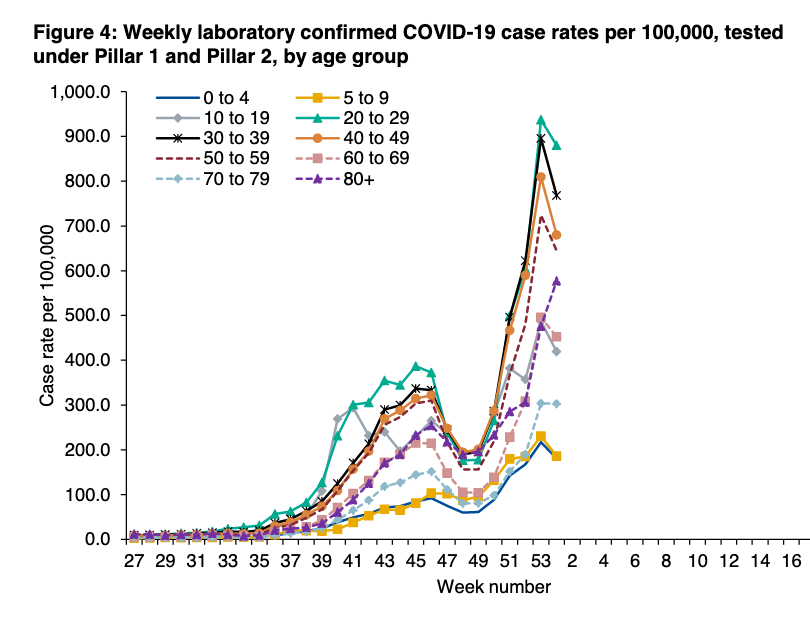
There is a suggestion that in terms of case rates, we may have turned a corner.
This is great news for every age group EXCEPT over 80+yrs where case rates look to be climbing as fast as ever in ALL regions (and 70-79yrs also in NW, SW, Mids).
This is great news for every age group EXCEPT over 80+yrs where case rates look to be climbing as fast as ever in ALL regions (and 70-79yrs also in NW, SW, Mids).

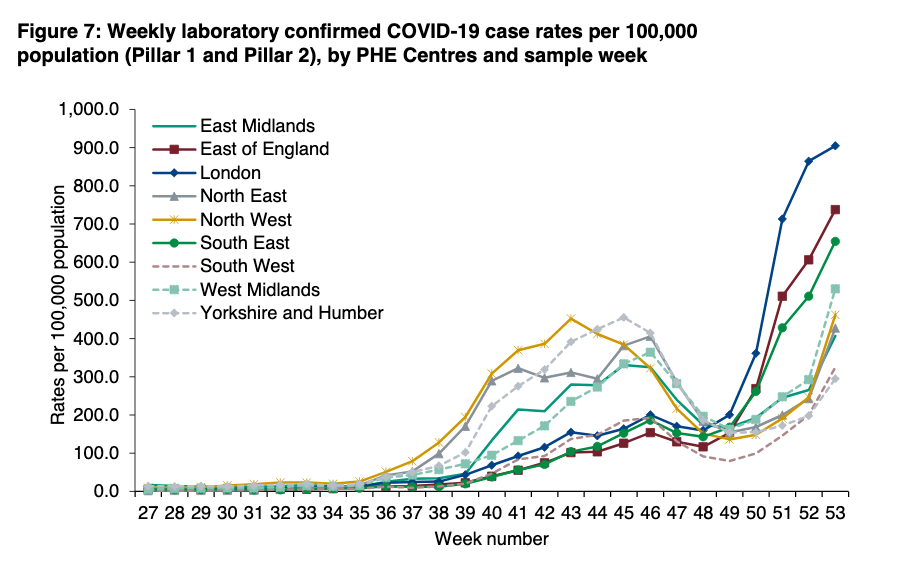
Here's the overall regional data.
Cases still climbing in the NW+, as well as SW and West Mids. Falling elsewhere.
Cases still climbing in the NW+, as well as SW and West Mids. Falling elsewhere.


Highest case rates still in SE/London - but not rising - and parts of NW, still rising.
**Note, the new scale on the chart this week, if PHE had continued with last week's scale, pretty much everything green and darker would be dark red😳(last week's map on the right...)**
**Note, the new scale on the chart this week, if PHE had continued with last week's scale, pretty much everything green and darker would be dark red😳(last week's map on the right...)**


Inequalities remain - both by ethnicity and deprivation.
And as case rates fall, the gradient by deprivation quintile for young adults is beginning to be exposed again. It's these groups who remain more likely to still have to work in lockdown.
And as case rates fall, the gradient by deprivation quintile for young adults is beginning to be exposed again. It's these groups who remain more likely to still have to work in lockdown.


With the rising case rates in over 80yrs, the number of incidents/outbreaks in care homes reported to PHE health protection teams is still rising.
This is devastating at the individual level, and also for hospitalisation rates and mortality.
This is devastating at the individual level, and also for hospitalisation rates and mortality.

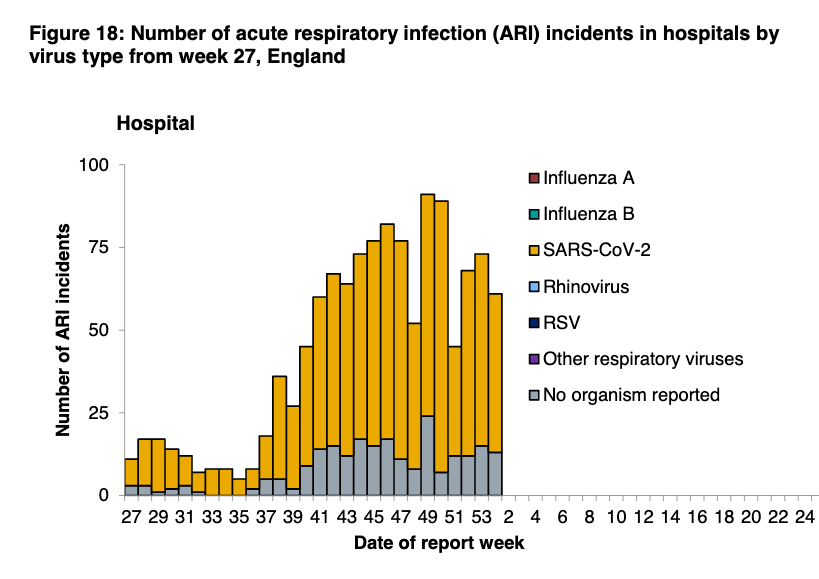
For hospitals, slight drop in recorded incidents (note scale is a *tenth* of that for the care home graph).
And for the first week back in schools, very little signal so far.
And for the first week back in schools, very little signal so far.

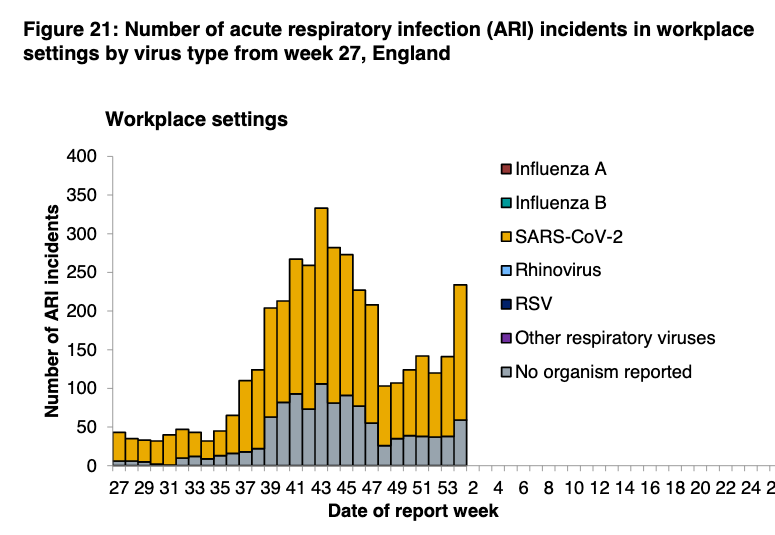
However, there's a big jump for workplace incidents.
Adults aged 20-60yrs still have the highest case rates and we know there are a lot of people still having to travel into work.
Adults aged 20-60yrs still have the highest case rates and we know there are a lot of people still having to travel into work.
For secondary care use and deaths it is entirely predictably dire.
Admission rates still racing up, and will continue to do so at this pace for another week at least.
Admission rates still racing up, and will continue to do so at this pace for another week at least.

There are now over 32,000 people in hospital in England with COVID-19.

The rise in admission rates is across the country, and still *including* London and the SE.
The NE is the only place that looks like it might be turning a corner.
The NE is the only place that looks like it might be turning a corner.

And given the age distribution of admissions and the fact that case rates are still rising in those over 80yrs across the country, hospitals still have some hugely difficult weeks ahead.

ICU admission rates also dire with over 3,000 people in England on ventilation. And this is across the country.


Finally the number of deaths is rising, and will continue to do so for another 3 weeks at the least. Nothing we do now can help that.
It's also worth flagging that the 60 day definition alongside the 28 day definition has been used in these reports from the start.
It's also worth flagging that the 60 day definition alongside the 28 day definition has been used in these reports from the start.

Excess mortality is also very high, consistent with @ONS @NickStripe_ONS reporting. Particularly in London and SE in the last couple of weeks.


Please note, even if this is the start of a change in case rates, >1 in 50 people are infected & hospital admissions are rising fast in a resource limited system.

Lockdown is more important than ever. Please ask for help if needed & only go out if absolutely reqd. Including kids to school, travelling to work, popping into shops.
And @GOVUK, please recognise that people still need more support to isolate & home school - £/social/practical.
And @GOVUK, please recognise that people still need more support to isolate & home school - £/social/practical.
And thank you to all those who are still working to keep us safe. There's light at the end.

PHE surveil rpt @felly500 @deb_cohen @martinmckee @carolecadwalla @mgtmccartney @ADPHUK @Jeanelleuk @fascinatorfun @profchrisham @petermbenglish @HPIAndyCowper @Davewwest @HSJEditor @KateAlvanley
@IndependentSage @nedwards_1 @SamanthaJonesUK @ewanbirney @FurberA @Dr_D_Robertson
@IndependentSage @nedwards_1 @SamanthaJonesUK @ewanbirney @FurberA @Dr_D_Robertson
And here's the flu data.
No admissions reported, and flu vax at an all time high.
No admissions reported, and flu vax at an all time high.


• • •
Missing some Tweet in this thread? You can try to
force a refresh