Most recent Test and Trace data, covers 31st Dec - 6th Jan.
Mixed picture this week:
- tests, cases, contacts ⬆️
- test turnaround times still not great
- taking longer to reach cases, but contact tracing performance remains fairly strong
Detail in 🧵
gov.uk/government/pub…
Mixed picture this week:
- tests, cases, contacts ⬆️
- test turnaround times still not great
- taking longer to reach cases, but contact tracing performance remains fairly strong
Detail in 🧵
gov.uk/government/pub…
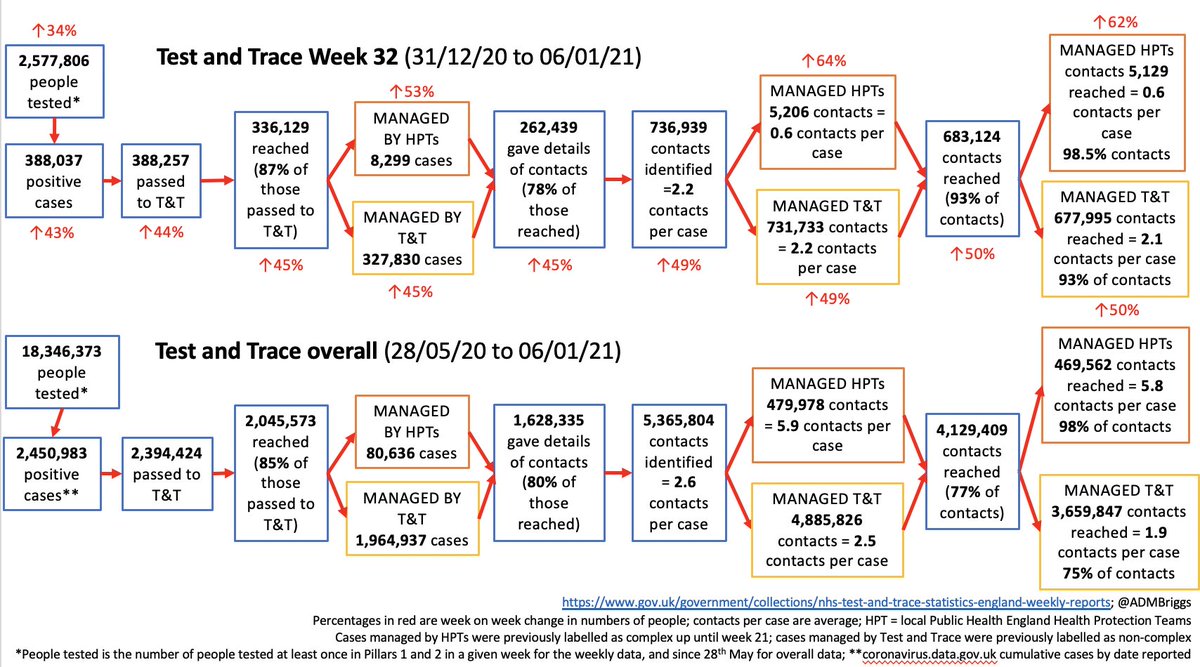
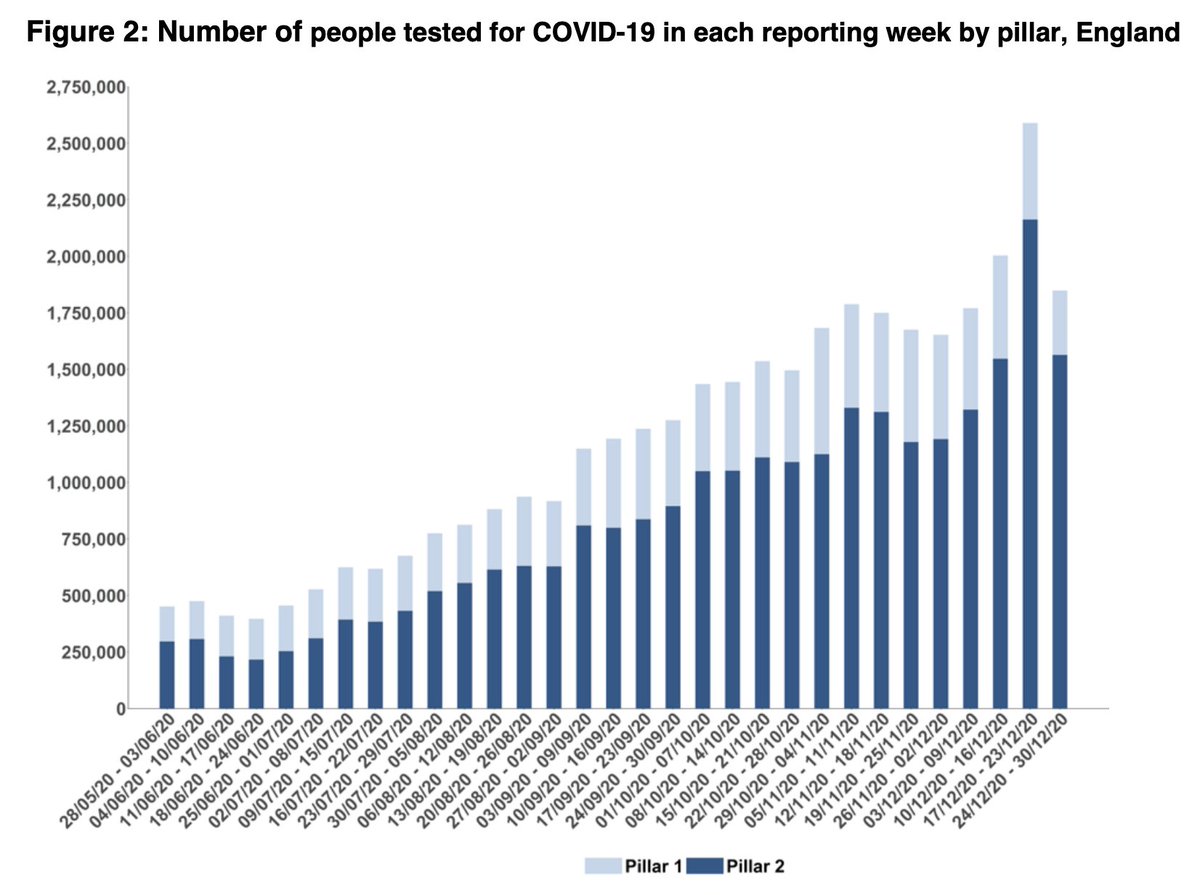
Following dip over Christmas week, number of people tested this week back up to 2.58m - 2.15m people tested in pillar 2 (community, including both PCR and rapid lateral flow devices) and 0.43m in pillar 1 (hospitals, just PCR).

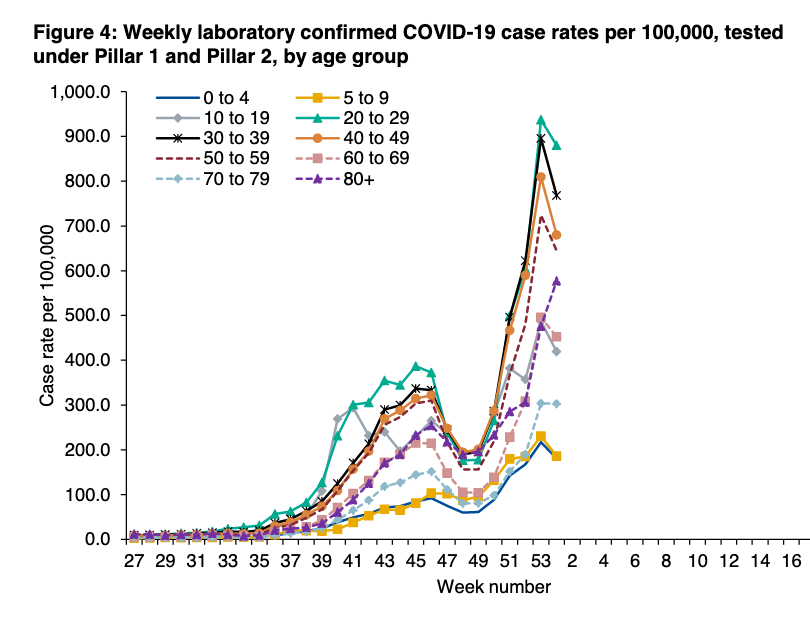
For week ending 6th Jan, there was a 21% increase in number of people testing positive to 388k, with similar percentage increases in both pillar 1 and pillar 2.

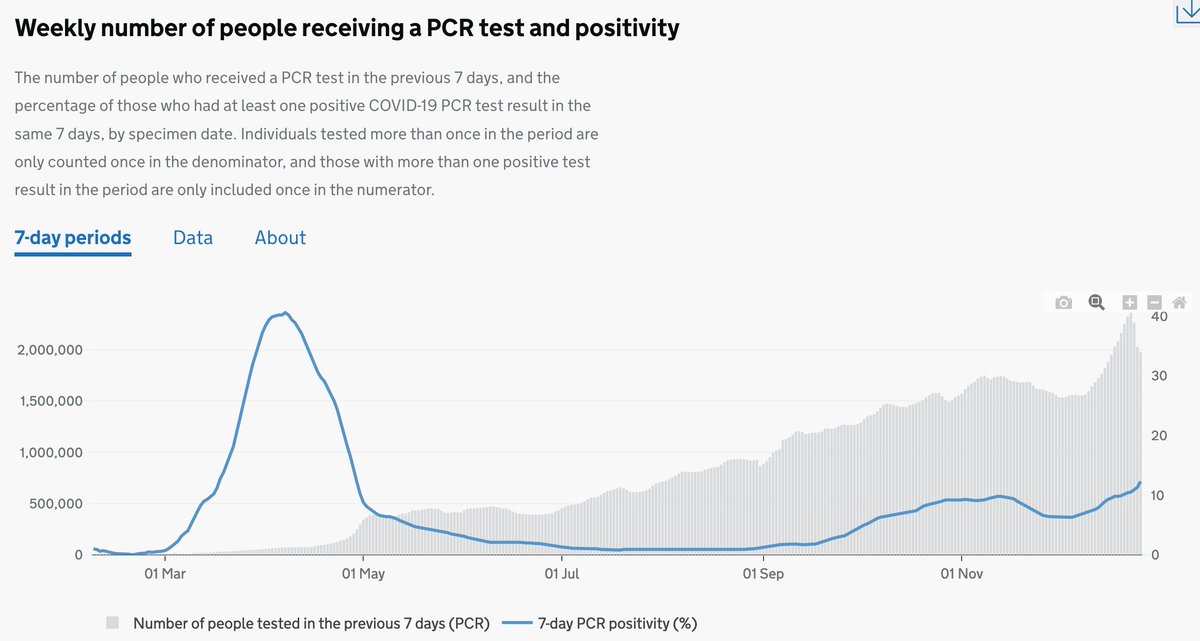
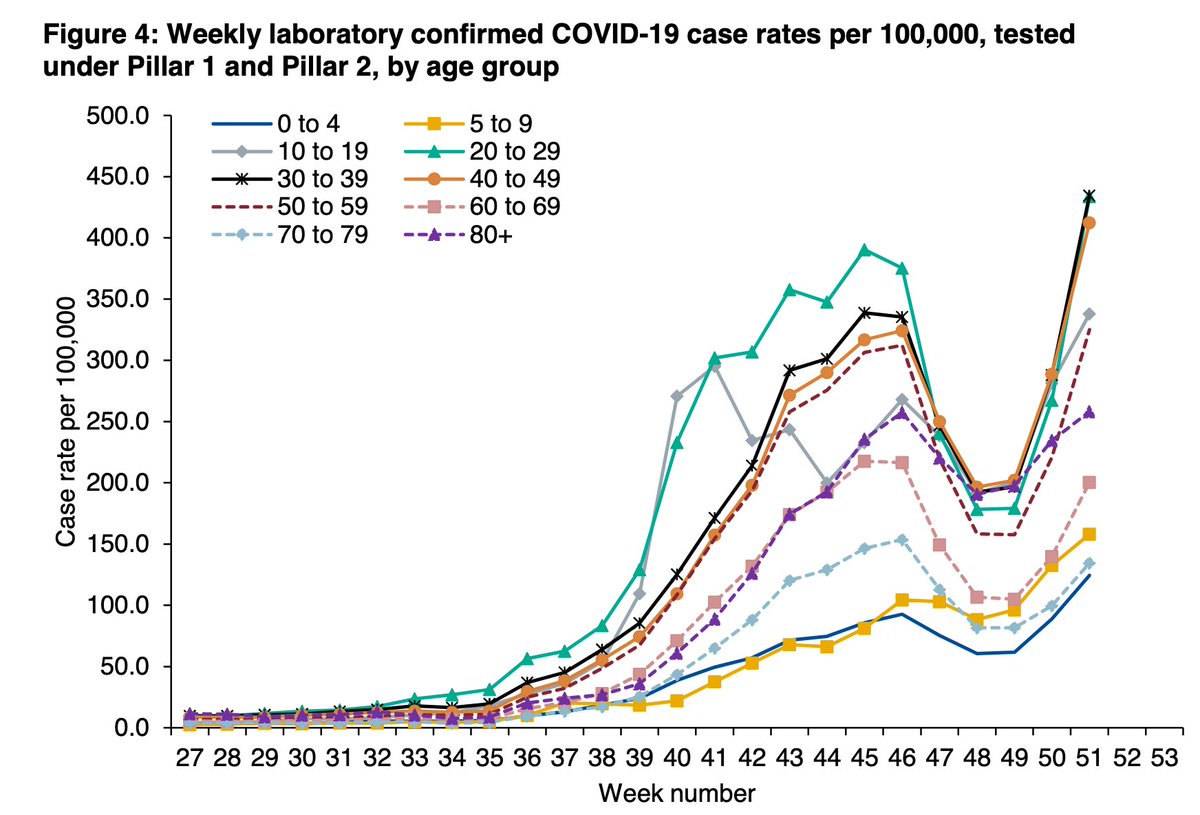
For pillar 2 PCR tests that week, the positivity rate was 18.0% - highest ever but today's PHE data up to 10th Jan suggests next week's T&T data will show positivity starting to fall.

Irrespective of your views on competence of the system etc, I think it's worth pausing here to say just how extraordinary it is to be testing over 2.5m people every week - nearly 5% of the entire population - for a disease we didn't even know about just 12 months before. 🤯
Test turnaround times are really up and down.
At least this week they're not significantly worse than the week before despite big increase in number of people tested.
But still a way off the performance of early Dec, and not consistently achieving 24hr test turnaround target.
At least this week they're not significantly worse than the week before despite big increase in number of people tested.
But still a way off the performance of early Dec, and not consistently achieving 24hr test turnaround target.

As more record numbers test positive, record numbers are handled by T&T. 388,257 in the week ending 6th Jan, of which 87% were reached
This % reached consistent with previous weeks but still means 52k cases weren't contacted
This % reached consistent with previous weeks but still means 52k cases weren't contacted


Jump in the numbers of cases managed by PHE local health protection teams (from 5,422 last wk to 8,299 this wk)
These cases are generally more complex/outbreaks often in high risk settings and may reflect growing numbers of incidents in care homes.
These cases are generally more complex/outbreaks often in high risk settings and may reflect growing numbers of incidents in care homes.
https://twitter.com/ADMBriggs/status/1349756643056234496?s=20
Of the 336k cases reached, 78% provided details of a close contact.
The fact that the percentage of people providing details barely changes over tiers, Christmas, lockdown etc shows how this simply can't reflect the genuine % of cases with a close contact.
The fact that the percentage of people providing details barely changes over tiers, Christmas, lockdown etc shows how this simply can't reflect the genuine % of cases with a close contact.

The % of cases reached within 24hrs by T&T (and therefore not passed on to local authority-led contact tracing systems) has dropped again this week to 71% - was 80% two weeks before.
Had wondered if drop last week was just a Christmas holiday effect but doesn't seem so.
Had wondered if drop last week was just a Christmas holiday effect but doesn't seem so.

A record 736,939 close contacts were identified.
That means in the week ending 6th Jan, over 1m cases or contacts were handled by T&T.
That means in the week ending 6th Jan, over 1m cases or contacts were handled by T&T.

Number of contacts per case remains pretty much the same - 2.2 overall and also for cases handled by the national team;
0.6 contacts per case for cases handled by local PHE Health Protection Teams.
0.6 contacts per case for cases handled by local PHE Health Protection Teams.
Percentage of those contacts reached has remained consistently high at 93% even as the number of contacts climbs.
But, simply due to the high numbers it still means 54k contacts weren't reached.
But, simply due to the high numbers it still means 54k contacts weren't reached.

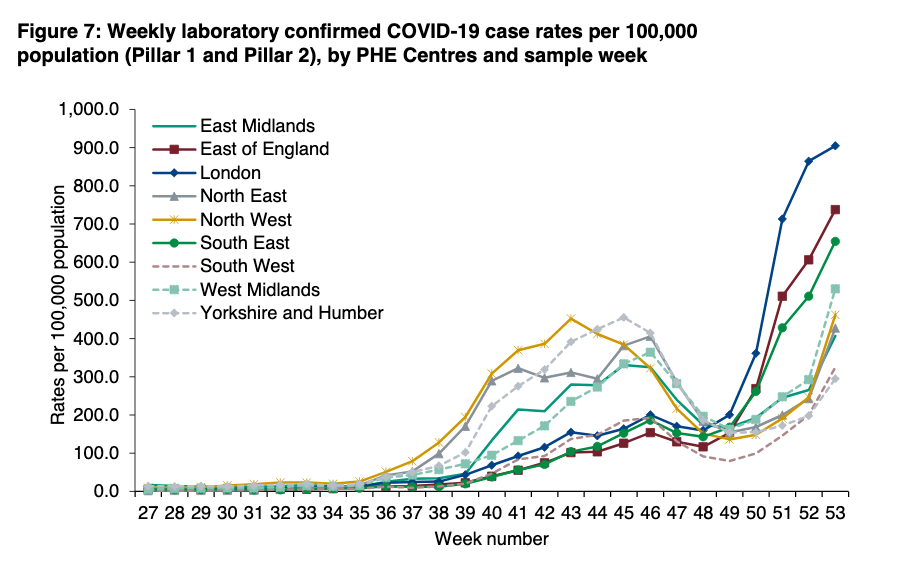
And as ever, there's geographic variation in percentage of cases reached.
With colleagues at @HealthFdn we wrote about this last year and are digging into the data again at the moment.
With colleagues at @HealthFdn we wrote about this last year and are digging into the data again at the moment.

Finally, whilst the time taken to reach the case has got longer, the time to reach contacts once they've been identified remains good, with 97% reached within 24 hrs.

It remains so important that T&T contributes performs: that test results are quick and cases/ contacts are reached, plus that people can afford to get tested and isolate when required.
The wider COVID picture remains really tough.
The wider COVID picture remains really tough.
https://twitter.com/ADMBriggs/status/1349756613905801217?s=20
Wk 32 T&T @felly500 @trishgreenhalgh @deb_cohen @martinmckee @carolecadwalla @mgtmccartney @ADPHUK
@Jeanelleuk @fascinatorfun @profchrisham @petermbenglish @HPIAndyCowper @Davewwest @HSJEditor @KateAlvanley @IndependentSage @nedwards_1 @chrischirp @SamanthaJonesUK
@Jeanelleuk @fascinatorfun @profchrisham @petermbenglish @HPIAndyCowper @Davewwest @HSJEditor @KateAlvanley @IndependentSage @nedwards_1 @chrischirp @SamanthaJonesUK
@ewanbirney @TimHarford @devisridhar @FurberA @andrewleedr @kieran_walshe @DrChadborn @Dr_D_Robertson
• • •
Missing some Tweet in this thread? You can try to
force a refresh