This week's @PHE_uk COVID surveillance report's just out.
Most recent week covered is 11th-17th Jan.
Case numbers may have peaked but hospital situation remains critical & deaths continue to rise, with large regional variation.
We're not out of this yet. Please stay 💪.
🧵
Most recent week covered is 11th-17th Jan.
Case numbers may have peaked but hospital situation remains critical & deaths continue to rise, with large regional variation.
We're not out of this yet. Please stay 💪.
🧵
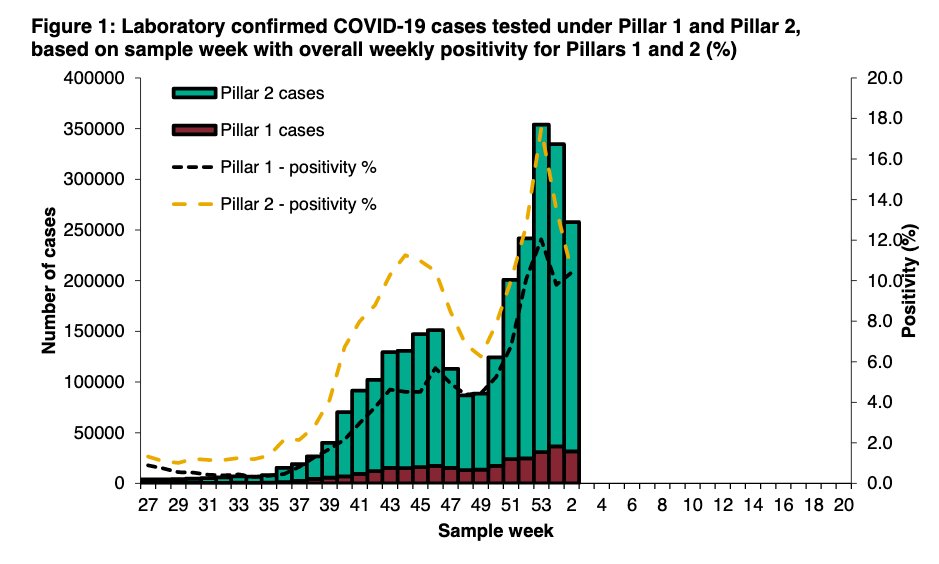
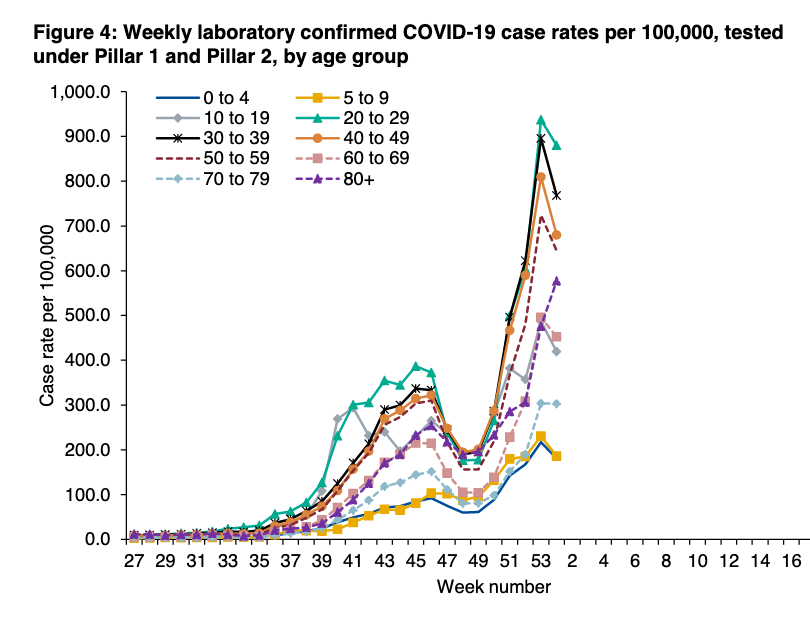
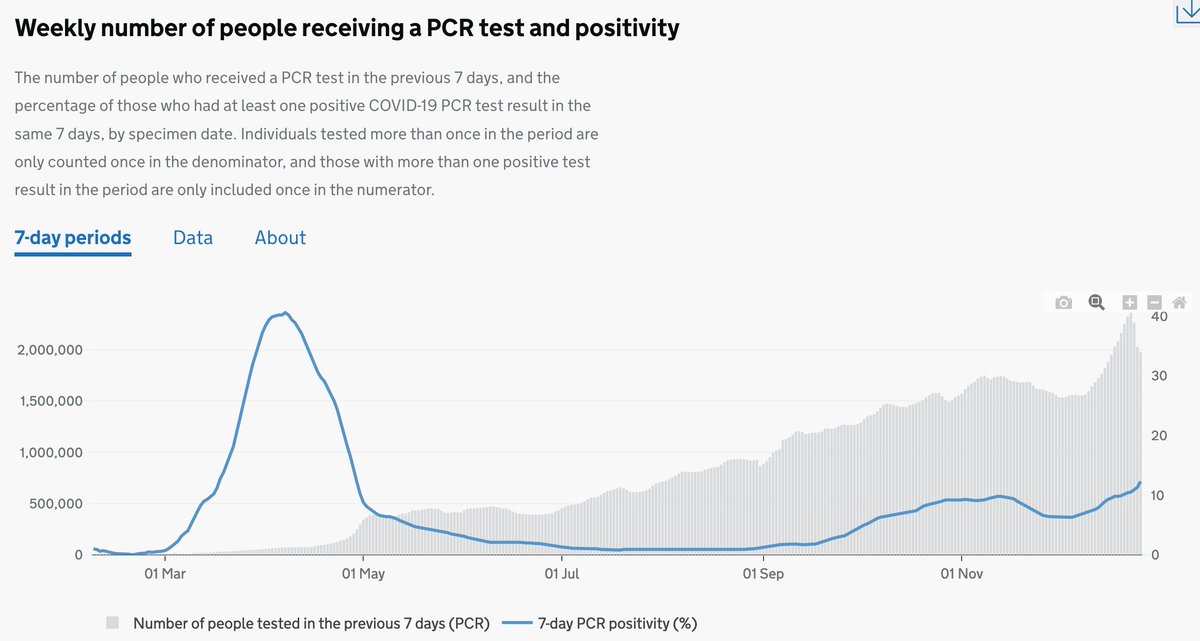
For two weeks in a row there are decrease in number of cases.
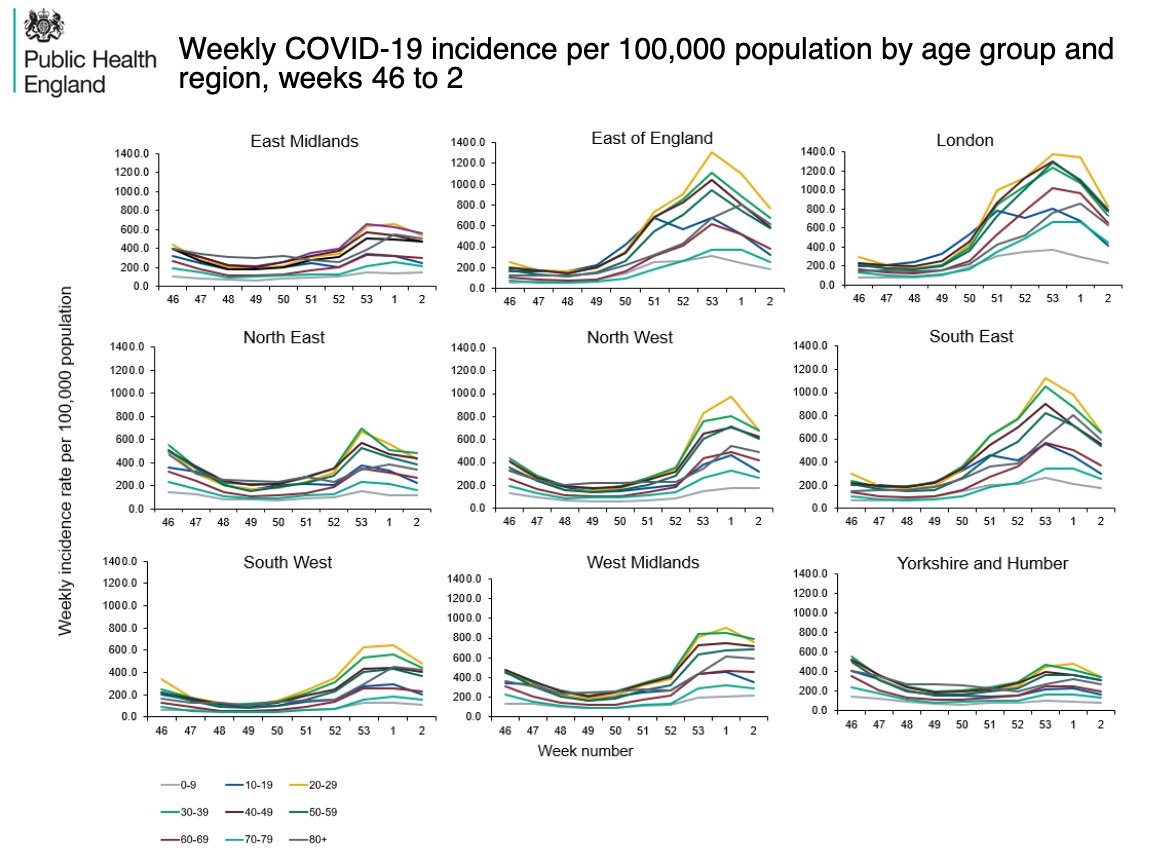
It seems fairly clear that with lockdown, infection rates are declining in all regions. Importantly (compared with last week) this now includes those aged 80+.
It seems fairly clear that with lockdown, infection rates are declining in all regions. Importantly (compared with last week) this now includes those aged 80+.
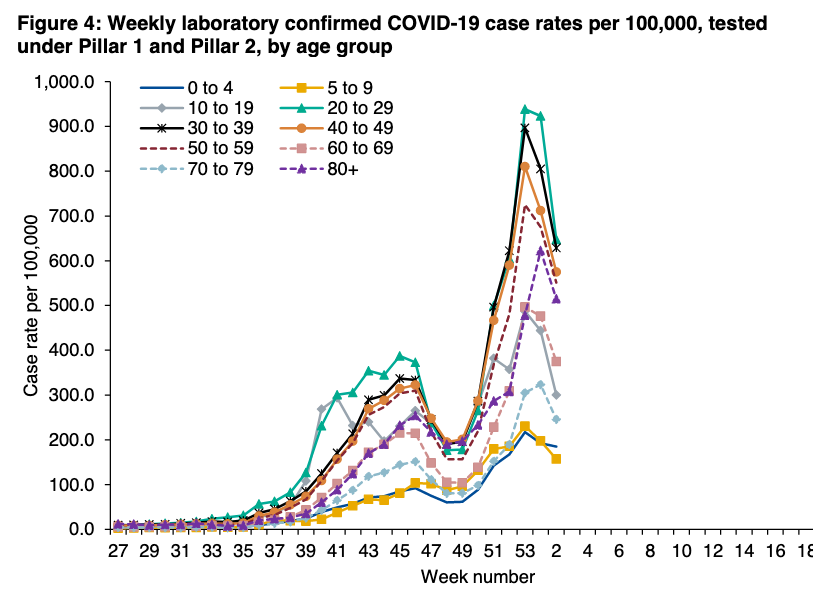
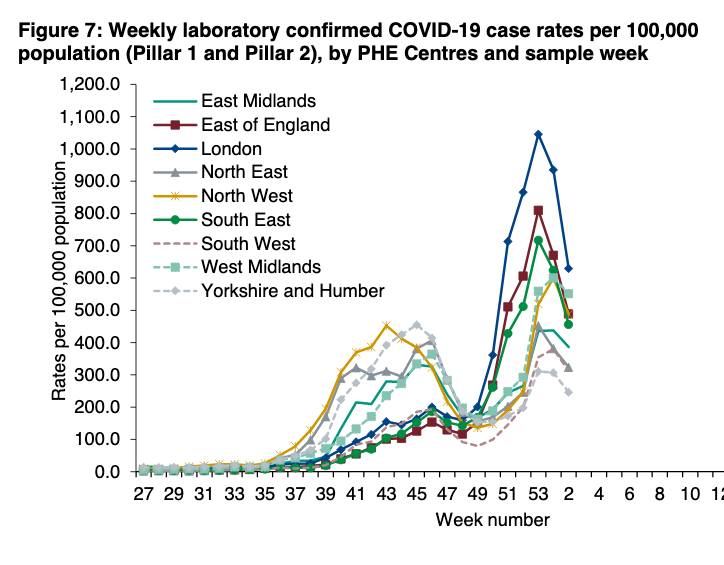
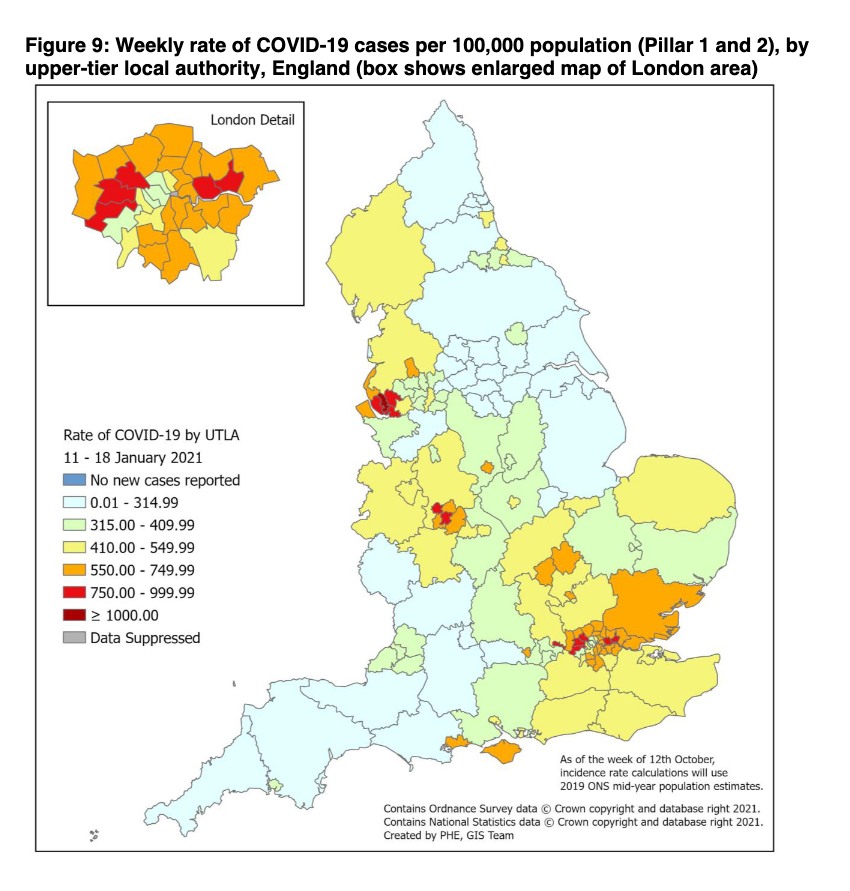
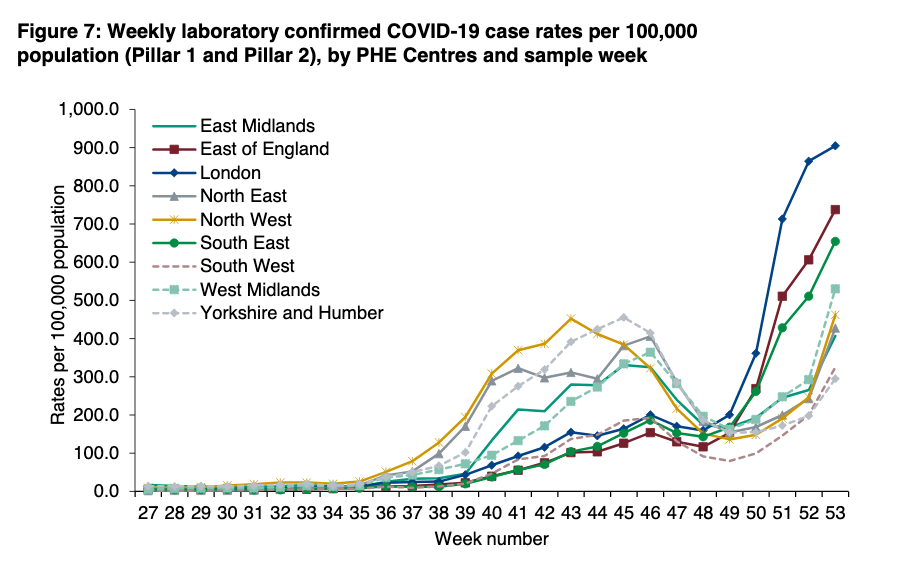
In some regions, particularly those with high case rates in this wave, infection rates are coming down fairly quickly.
In other regions & ages, there is little shift in some age groups. For example, see age 40-60yrs in East and West Mids.
This is *despite* being under lockdown.
In other regions & ages, there is little shift in some age groups. For example, see age 40-60yrs in East and West Mids.
This is *despite* being under lockdown.
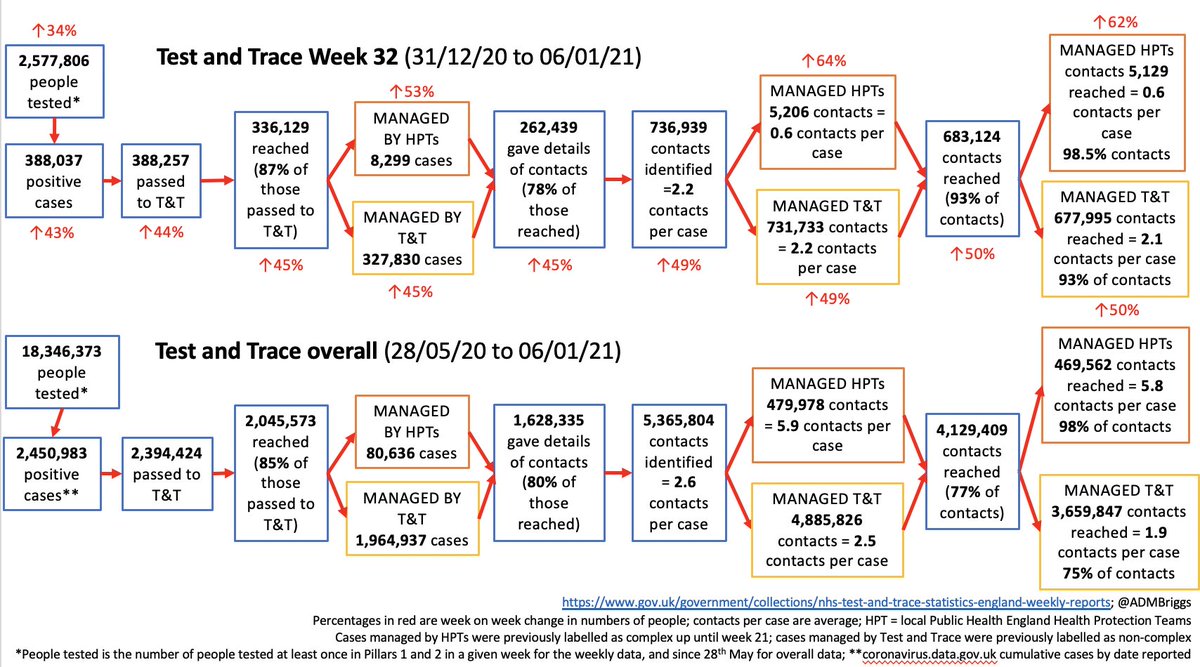
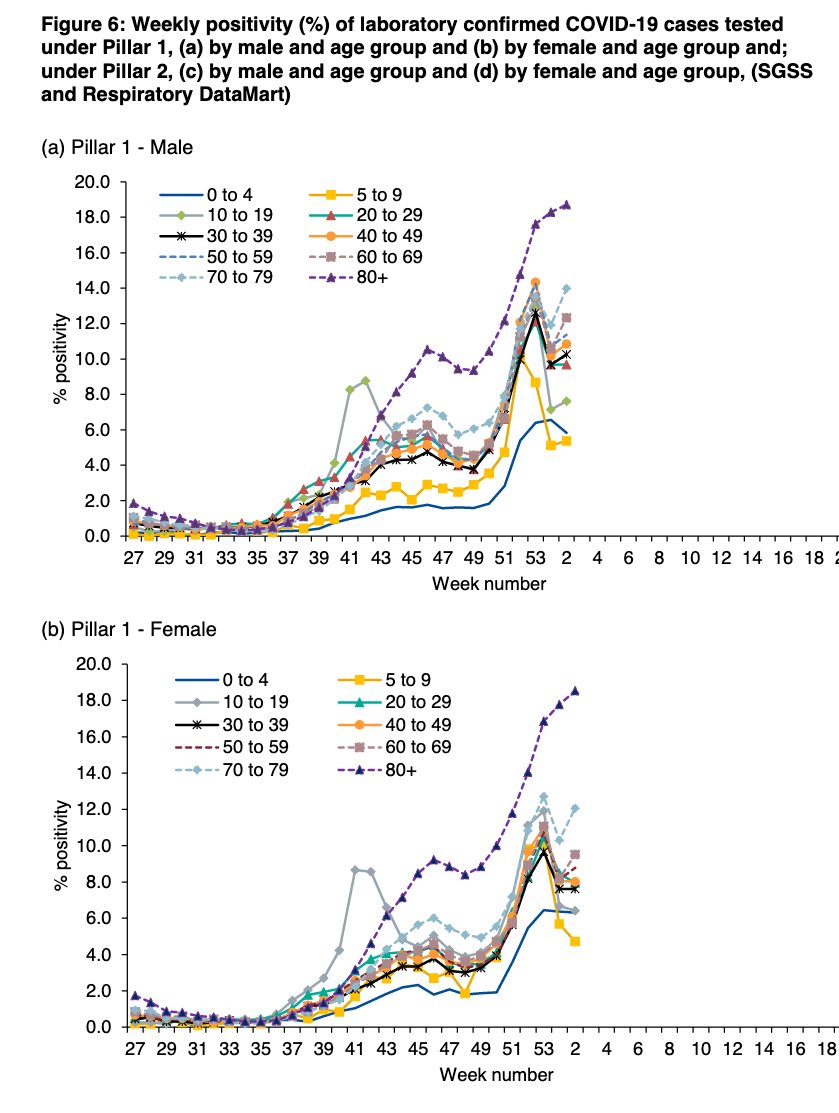
Also worth noting that positivity rate in pillar 1 - the percentage of PCR tests done in NHS and PHE labs that come back positive - has gone up this week.
This will, in part, be a reflection of thousands of people still being admitted to hospital + outbreaks (note age 80+).
This will, in part, be a reflection of thousands of people still being admitted to hospital + outbreaks (note age 80+).

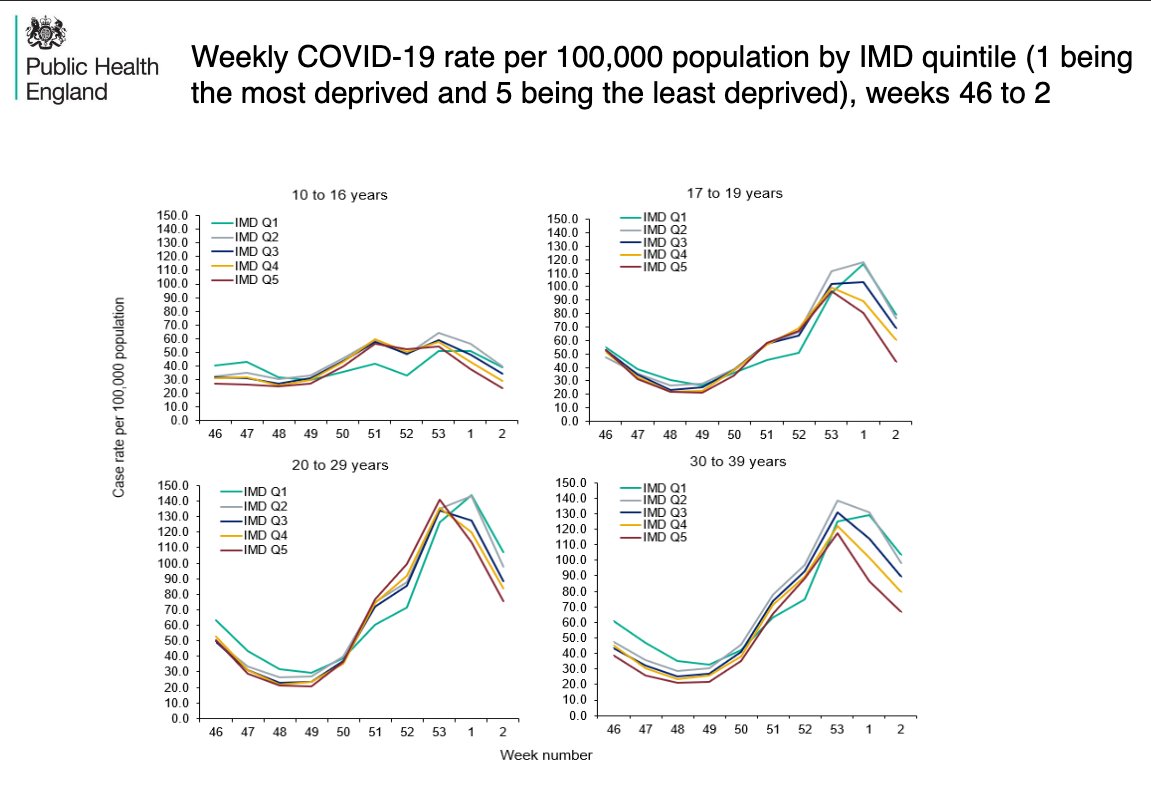
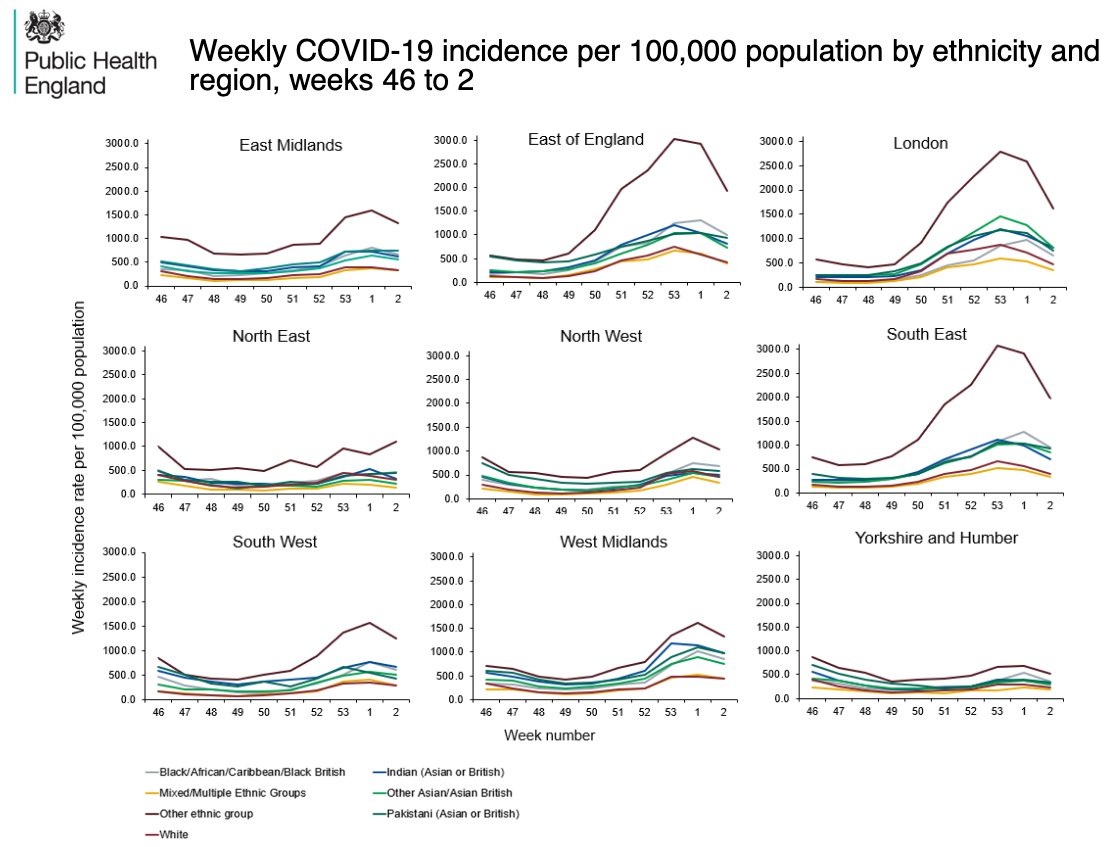
As infection rates begin to fall, differences by deprivation in young adults, and by ethnicity remain.
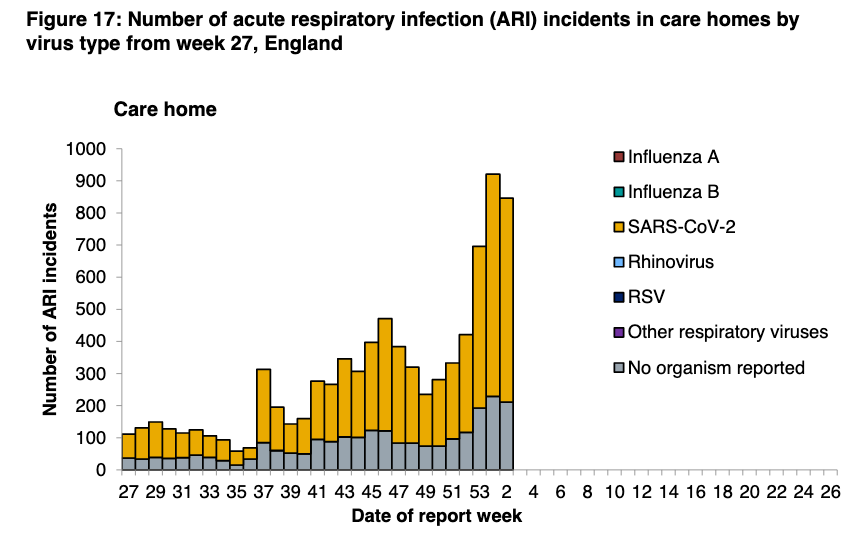
Slight fall in the number of incidents in care homes reported to PHE this week, which is great news.
This goes alongside the reported fall in case rates all ages including those aged over 80yrs.
This goes alongside the reported fall in case rates all ages including those aged over 80yrs.
But we know that number of deaths among care home residents with COVID jumped 46% wk ending 15th Jan, with total deaths now more than each of last 2yrs.
As deaths lag 2-3 weeks behind infection, it's desperately sad that we should expect these to rise.
theguardian.com/world/2021/jan…
As deaths lag 2-3 weeks behind infection, it's desperately sad that we should expect these to rise.
theguardian.com/world/2021/jan…
And in fact, we might reasonably expect *fewer* deaths among care home residents at the moment than usual, let alone the same amount or more.
(links to datasets here through previous tweet here)
(links to datasets here through previous tweet here)
https://twitter.com/ADMBriggs/status/1350081730875699202?s=20
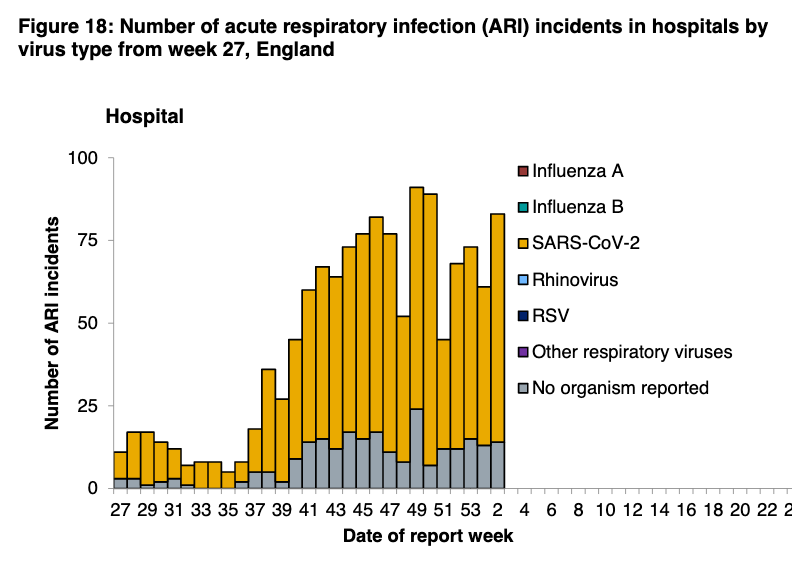
Step increase in incidents seen in hospitals but note scale is *one tenth* of that used in care homes chart.
To be honest, I think it's fairly remarkable how few hospital incidents are reported given the that around 1/3 of all current adult inpatients have COVID.
To be honest, I think it's fairly remarkable how few hospital incidents are reported given the that around 1/3 of all current adult inpatients have COVID.
Increase in incidents in schools this week, especially those for children with special educational needs - those schools are more likely to have children in school.
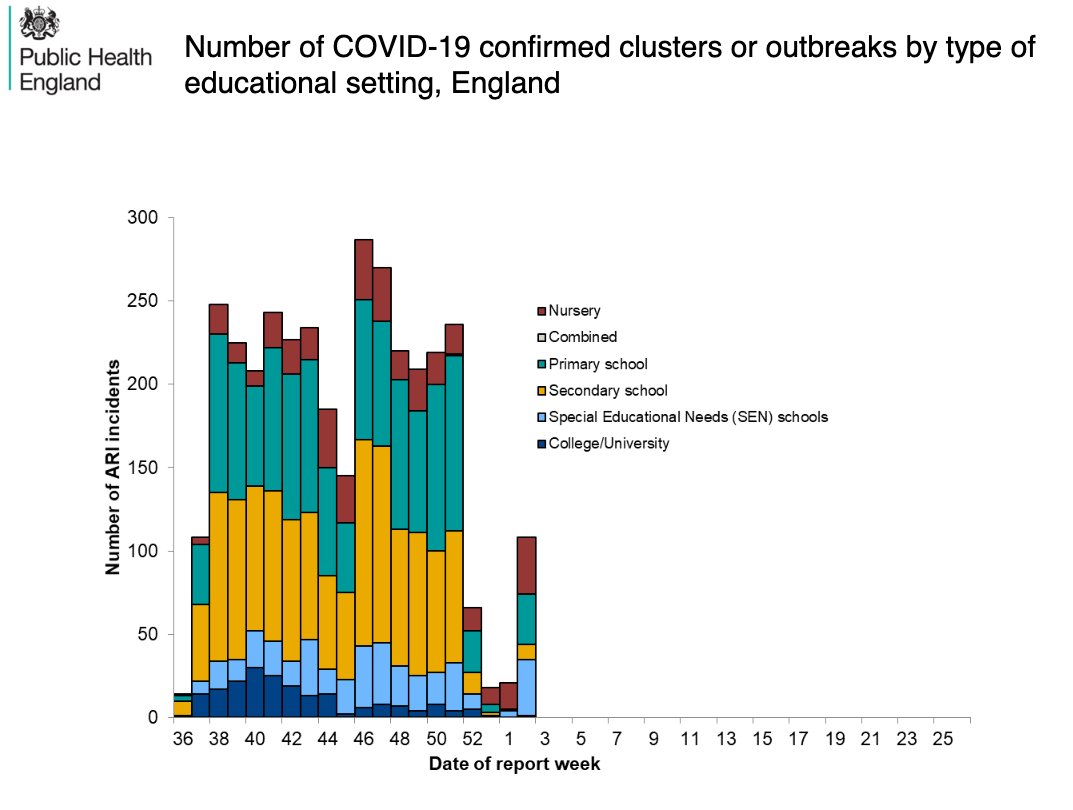
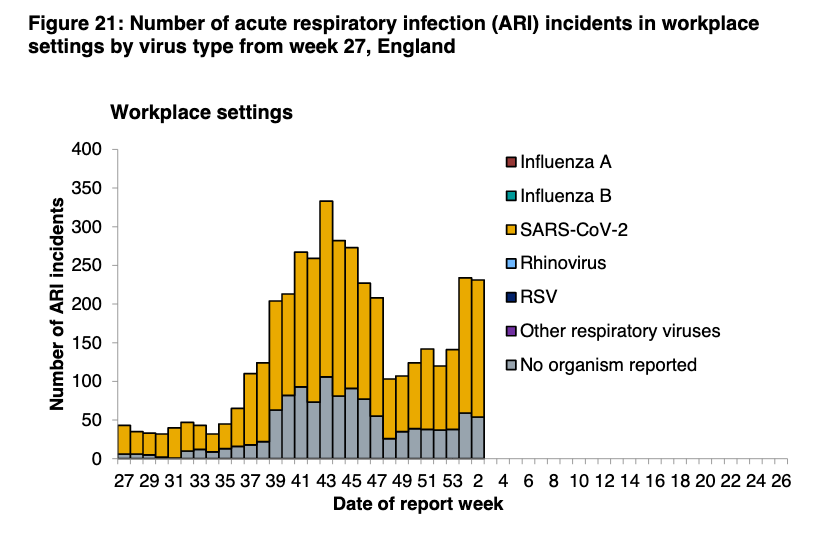
Little change in workplace settings.
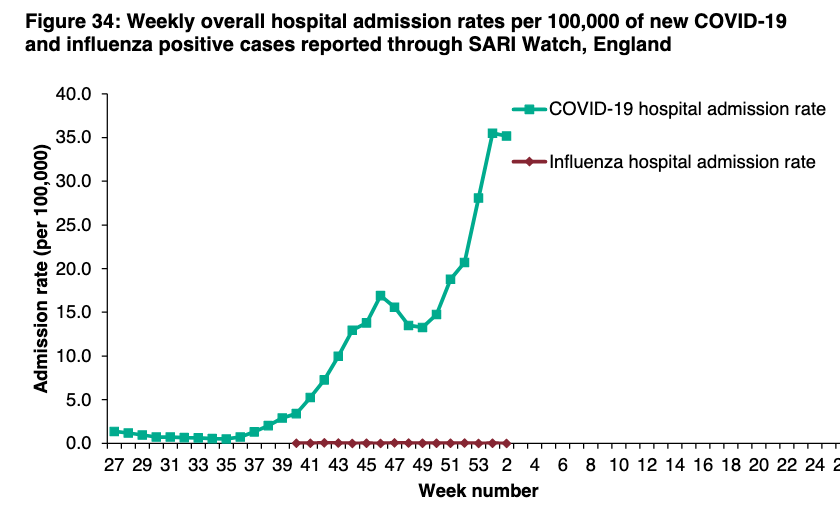
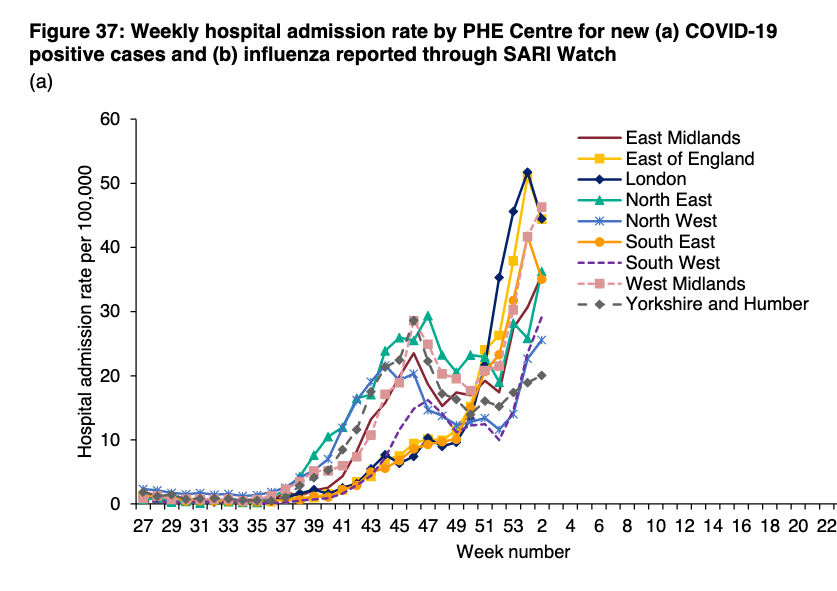
Potentially beginning to see an overall slow down in hospital admission rate.
But this actually only London, South East and East of Eng.
*Everywhere else* it is still rising.
But this actually only London, South East and East of Eng.
*Everywhere else* it is still rising.
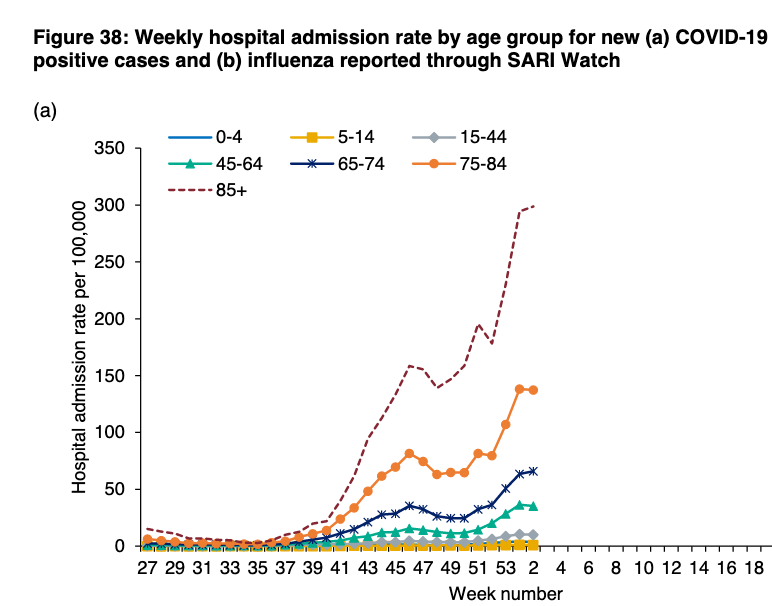
And as mentioned earlier about rising case rates in over 80yr olds last week. Their admission rates are still rising as other ages plateau and fall.
Hopefully next week we should see their admission rates begin to fall.
Hopefully next week we should see their admission rates begin to fall.
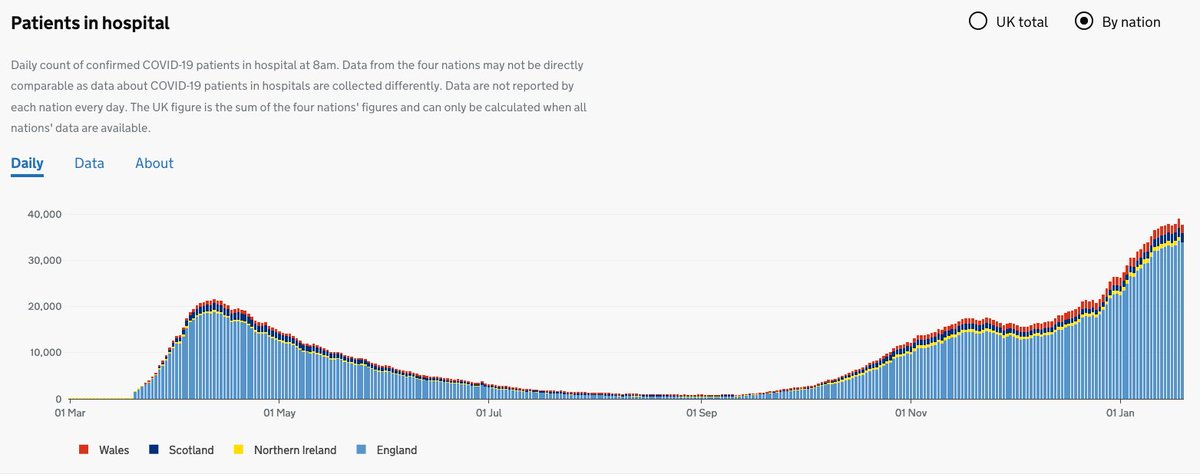
And because stay can be lengthy, the number patients in hospital with COVID is still rising.
Well over double the November peak.
Well over double the November peak.
ICU admissions also lags behind hospital admissions, where again it's still rising everywhere except London, East of England, and South East, plus also potentially stalling in N West.
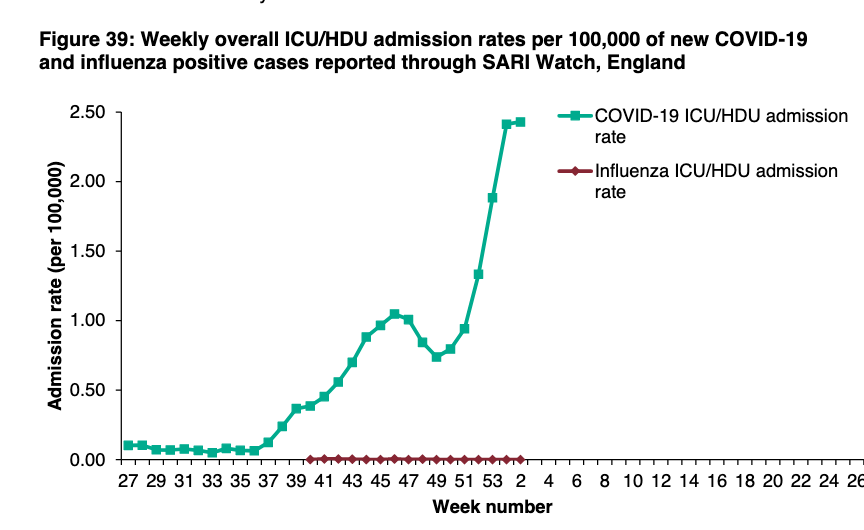
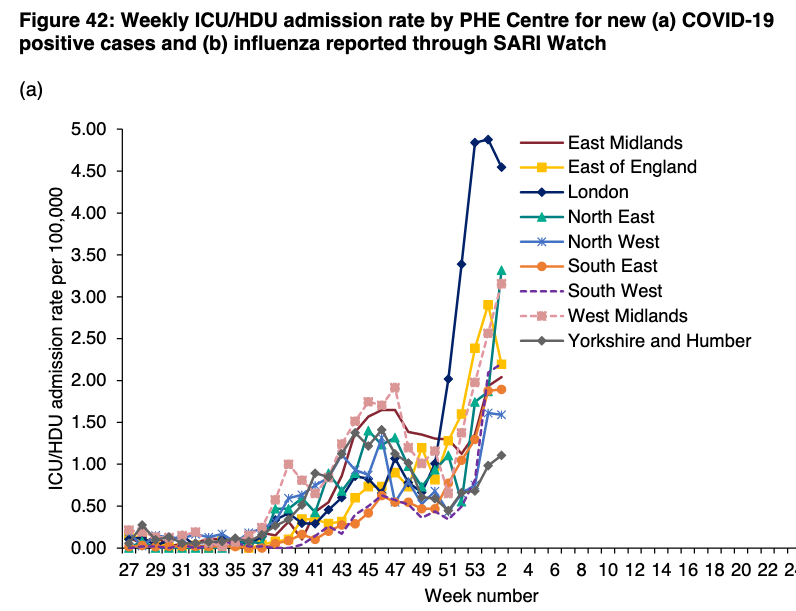
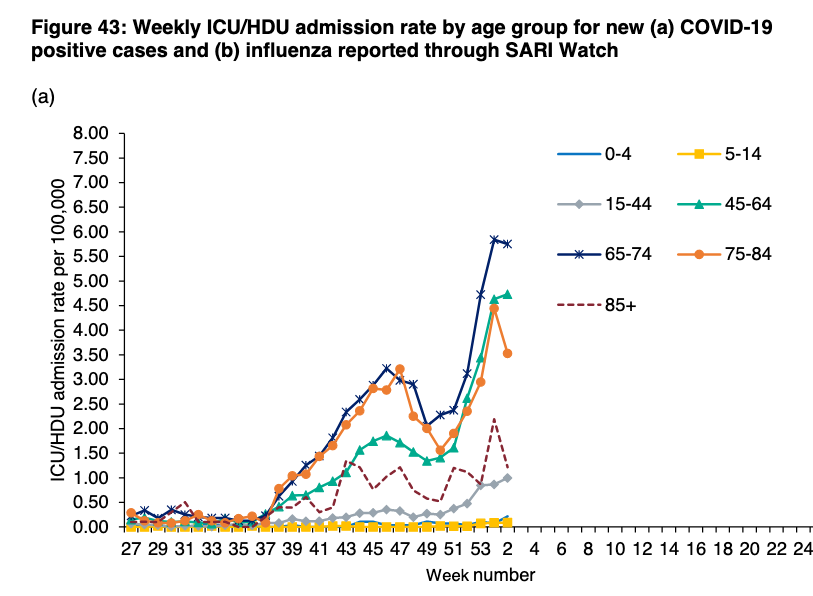
And as ever, worth remembering that ICU patients are on average, much younger.
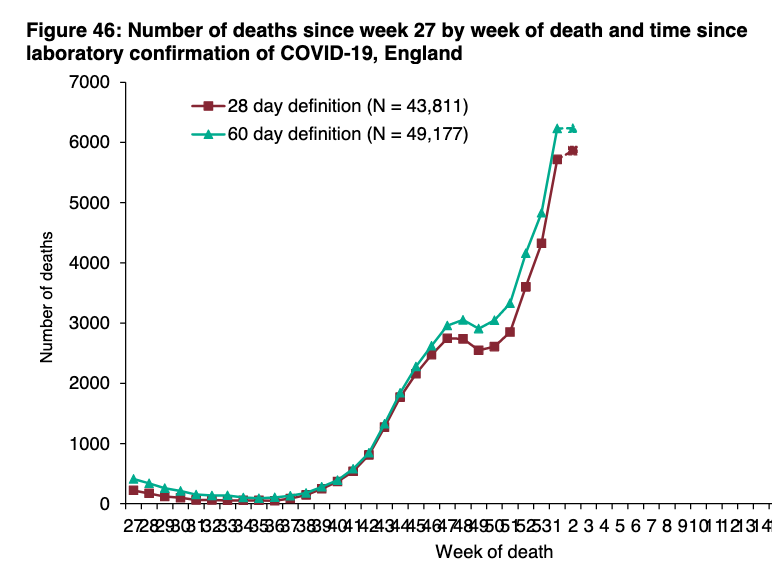
Deaths then lag a further week and will continue to go up for at least the next week (note, most recent week will increase following delayed notifications).
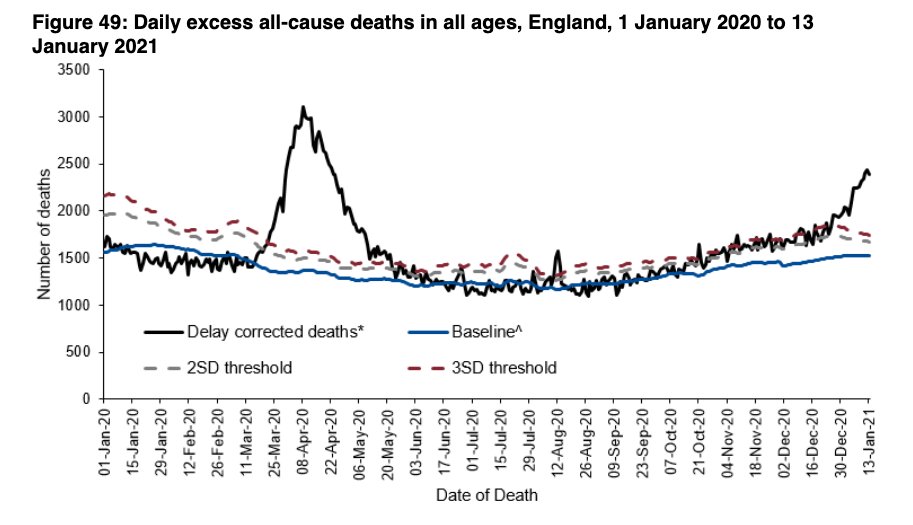
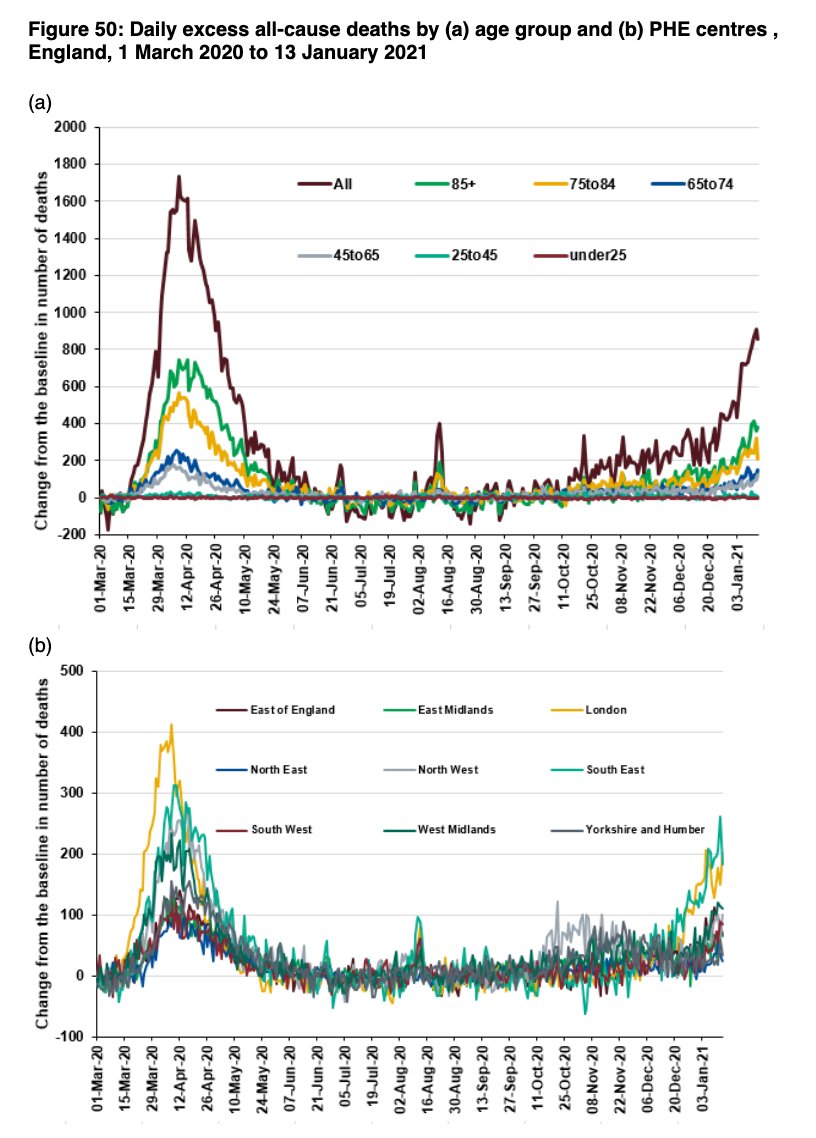
And this peak's excess mortality now becoming abundantly and upsettingly clear.
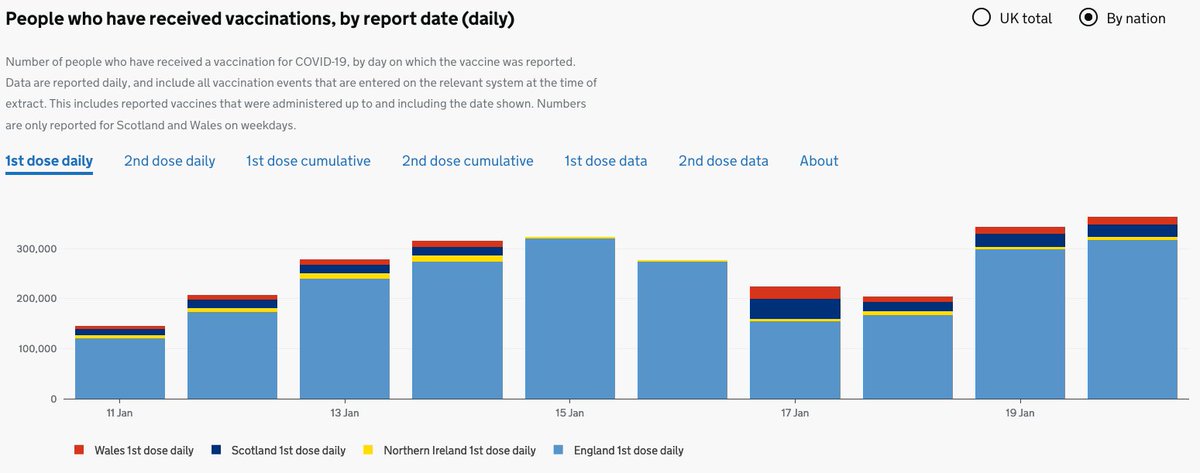
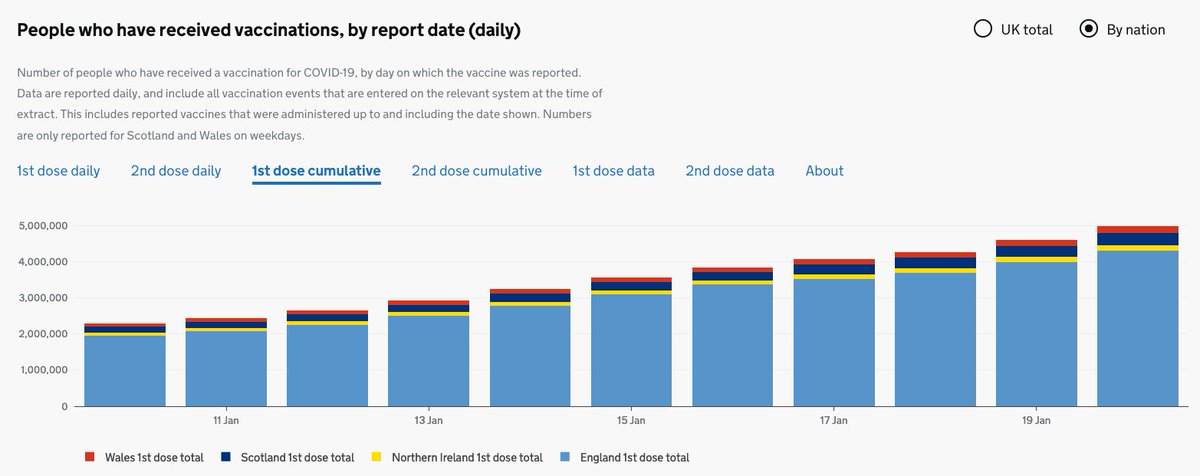
An among all this, vaccination roll-out continues at a pretty incredible pace (the logistics underpinning this are fairly eye-watering).
Vaccinations should really help regarding severe infections, but transmission may still occur, and young people still end up in ICU.
Vaccinations should really help regarding severe infections, but transmission may still occur, and young people still end up in ICU.
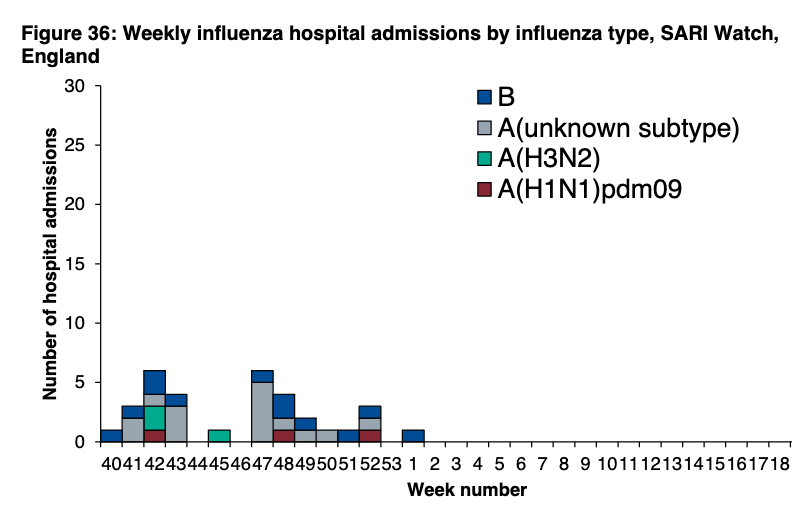
(there remains no flu).
So there's hope that lockdown has meant that new infections may have peaked, but hospitals are still bursting at the seams and *thousands* are dying every day.
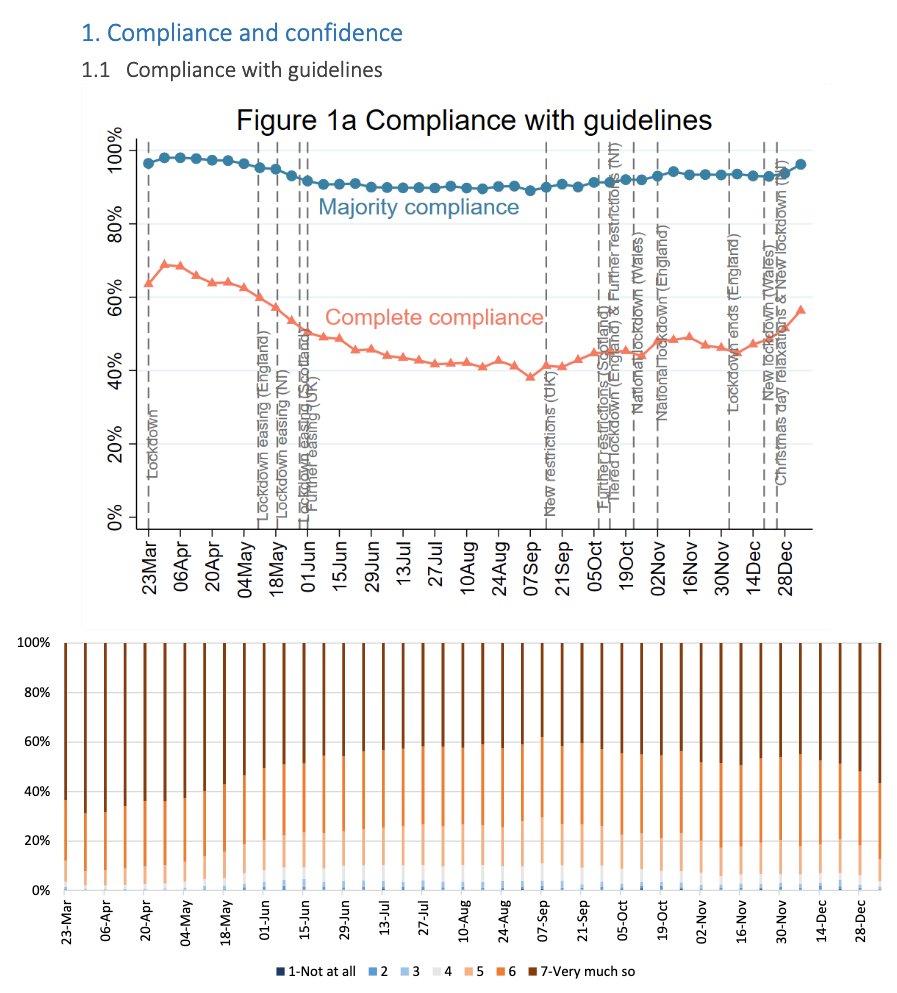
Vaccines provide hope, but it remains critical to follow lockdown rules and only go out if absolutely necessary.
Vaccines provide hope, but it remains critical to follow lockdown rules and only go out if absolutely necessary.
And thankfully most people are doing just that - in fact, compliance is as high as it's ever been.
Thank you.
(data from most recent round of UCL COVID social study - covidsocialstudy.org/results)
Thank you.
(data from most recent round of UCL COVID social study - covidsocialstudy.org/results)
PHE surveil rpt @felly500 @deb_cohen @martinmckee @carolecadwalla @mgtmccartney @ADPHUK @Jeanelleuk
@fascinatorfun @profchrisham @petermbenglish @HPIAndyCowper @Davewwest @HSJEditor @KateAlvanley
@IndependentSage @nedwards_1 @SamanthaJonesUK @ewanbirney @FurberA @Dr_D_Robertson
@fascinatorfun @profchrisham @petermbenglish @HPIAndyCowper @Davewwest @HSJEditor @KateAlvanley
@IndependentSage @nedwards_1 @SamanthaJonesUK @ewanbirney @FurberA @Dr_D_Robertson
• • •
Missing some Tweet in this thread? You can try to
force a refresh