Better late than never.
Thursday's Test & Trace data covering 7th - 13th Jan.
⬆️people tested
⬇️cases
⬇️not enough contacts
🤷♂️people isolating
Summary in figure, detail in 🧵
gov.uk/government/pub…
Thursday's Test & Trace data covering 7th - 13th Jan.
⬆️people tested
⬇️cases
⬇️not enough contacts
🤷♂️people isolating
Summary in figure, detail in 🧵
gov.uk/government/pub…


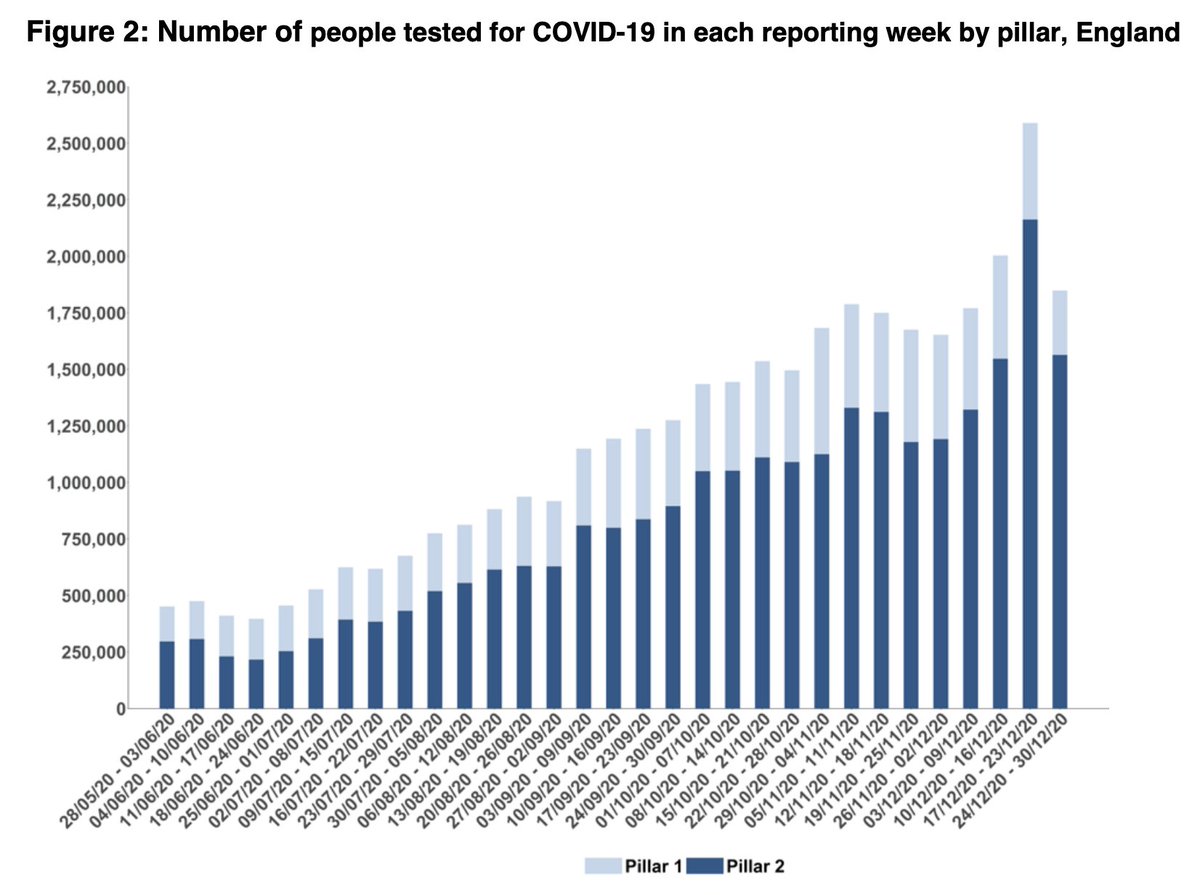
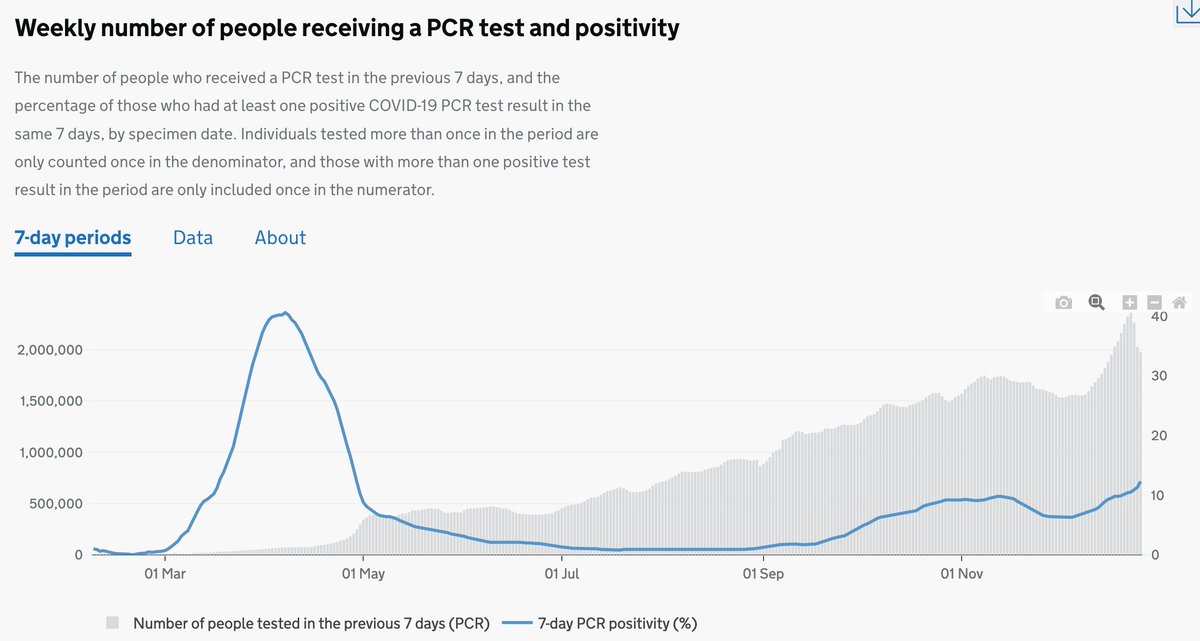
Big jump in number of people tested. Up 14% to 2.9m (>5% of English population in a single week).

This is partly due to a 20% increase (from 435k to 521k) in number of people tested in pillar 1.
These are NHS and PHE labs - generally used for hospital patients and more complex settings, with some of the increase because there are more people in hospital and more outbreaks.
These are NHS and PHE labs - generally used for hospital patients and more complex settings, with some of the increase because there are more people in hospital and more outbreaks.
The pillar two (community testing) is more difficult to interpret. A little under 300k additional people were tested, but this includes those using rapid lateral flow devices.
The number of LFDs used has doubled since previous wk to 972k, and number PCR tests is up 100k.
The number of LFDs used has doubled since previous wk to 972k, and number PCR tests is up 100k.


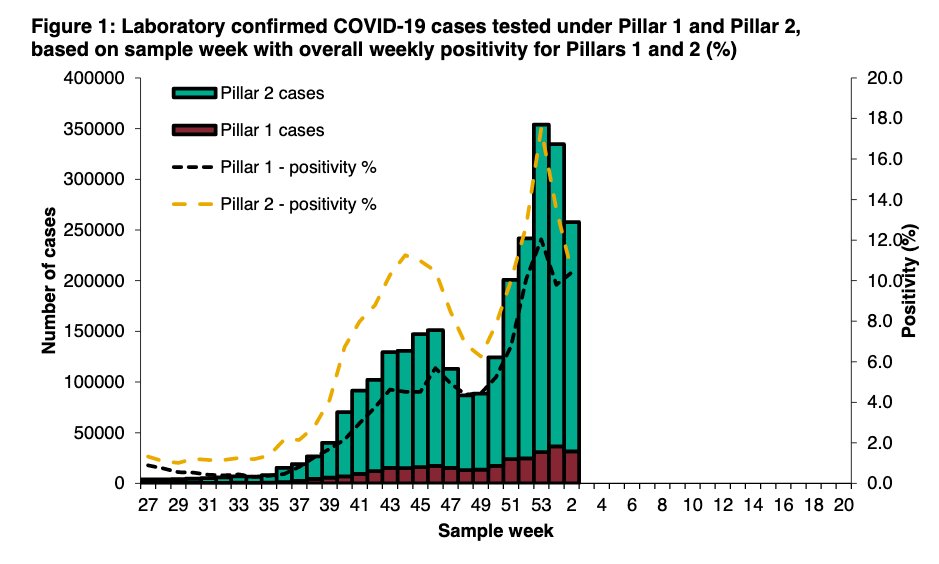
Because of rapid roll out of LFDs to lots of different pop'n groups, positivity rates (the percentage of people testing positive) isn't meaningful.
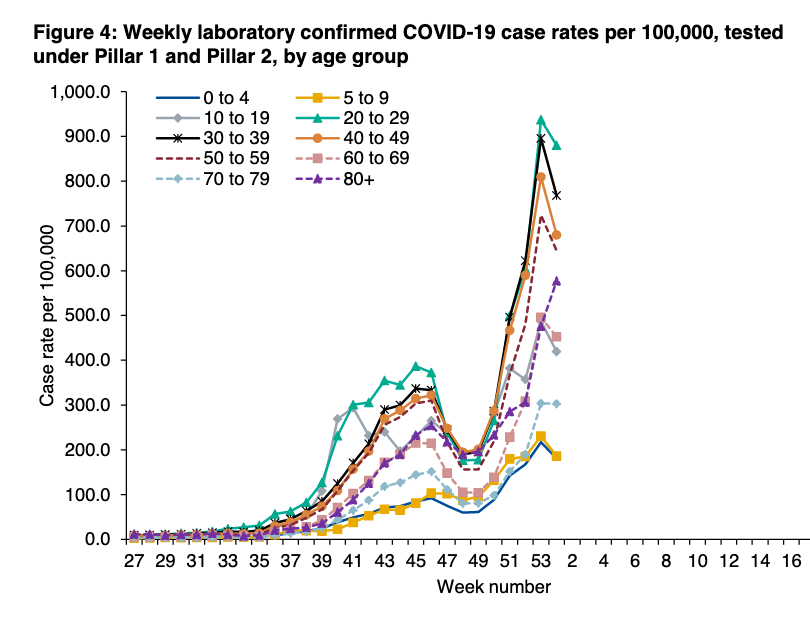
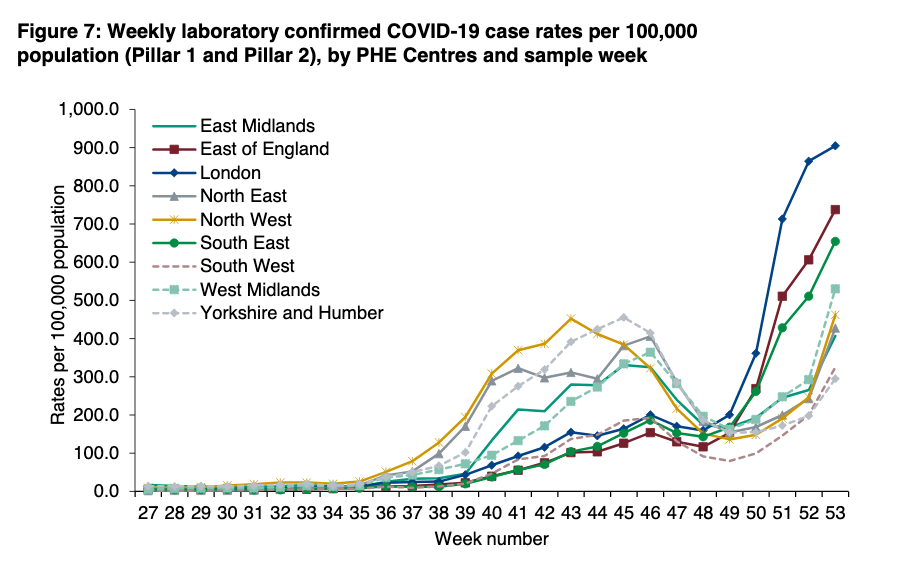
PHE data to 17th Jan suggests, however, that for pillar 2 PCR tests it is beginning to drop. Note for P1, it's not falling.
PHE data to 17th Jan suggests, however, that for pillar 2 PCR tests it is beginning to drop. Note for P1, it's not falling.
In future, it would be helpful to know number of individuals testing with LFDs each week (rather than number of tests done), as well as explicitly separating out symptomatic from asymptomatic (some asymptomatic testing - for example in care homes, still uses PCR).

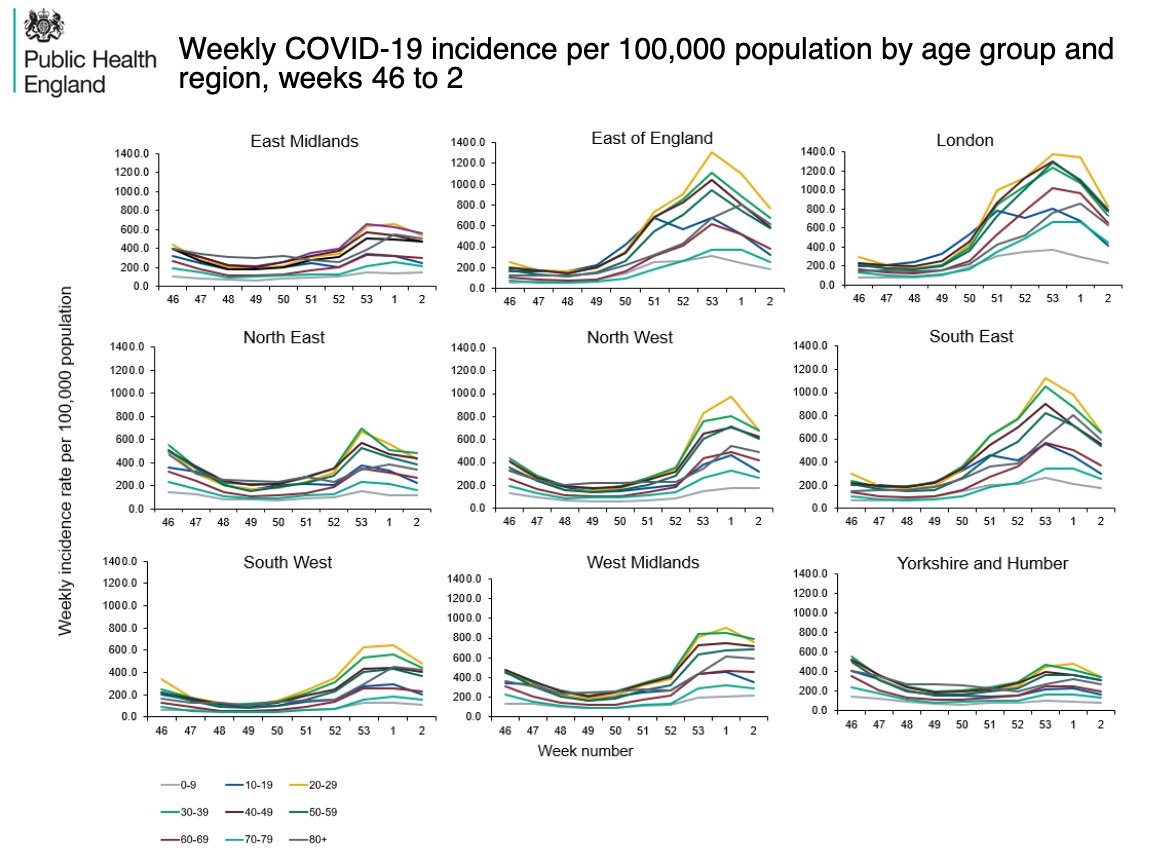
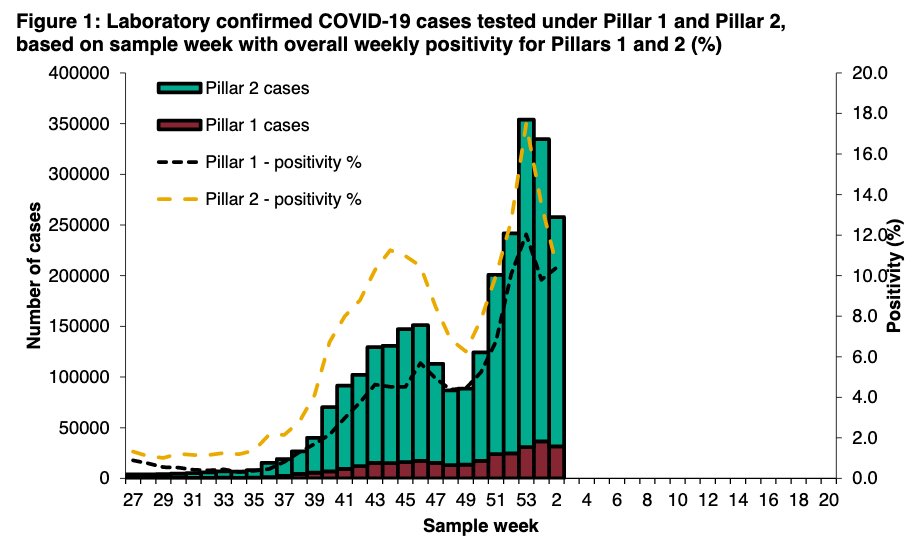
So this wk reports 331k cases, down 15% on last wk. But drop is all P2.
In P1, cases ⬆️11% to 52k.
P1 is those in clinical need, in hospital, plus some health & care staff - it suggests as community rates fall, there's still plenty of severe disease, with people going to hosp.
In P1, cases ⬆️11% to 52k.
P1 is those in clinical need, in hospital, plus some health & care staff - it suggests as community rates fall, there's still plenty of severe disease, with people going to hosp.

In general, time from taking a test to getting results has improved this week. But worth noting that for in-person tests the target is result w/i 24hrs & only 54% of tests achieve that.
So def room to improve but also worth noting this is based on a mind-numbing 2.1m tests.
So def room to improve but also worth noting this is based on a mind-numbing 2.1m tests.


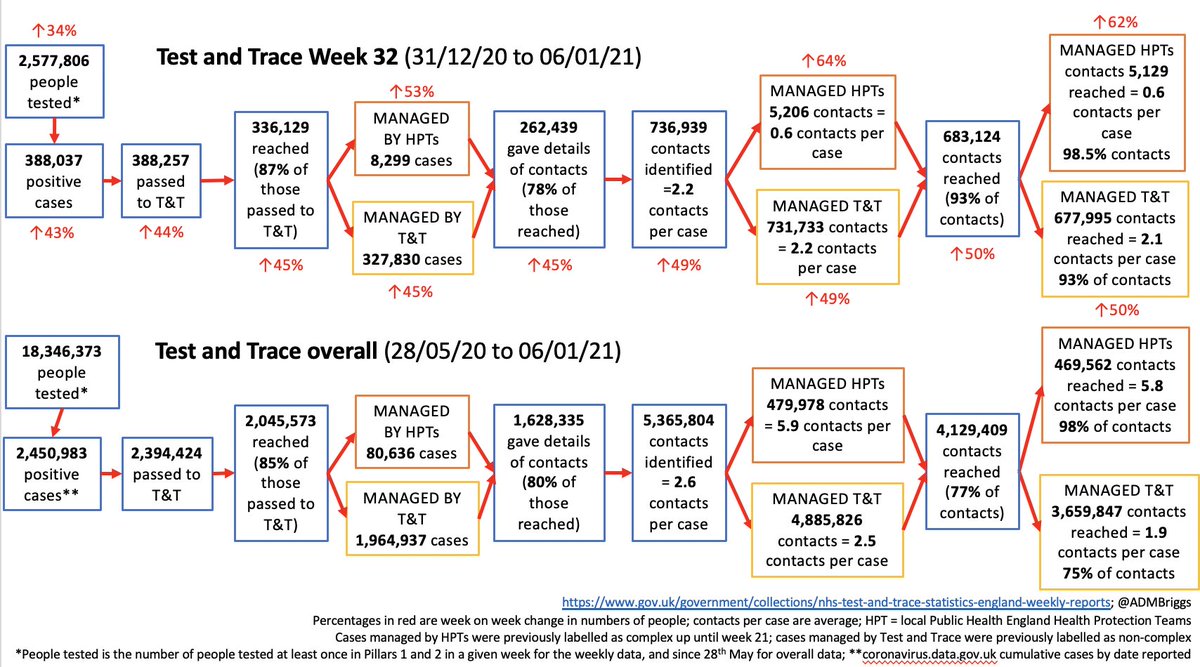
For contact tracing, T&T handled 351,567 cases, down 9% on he week before, and reached 87% of them.
This means 305k cases were reached but 42.5k weren't.
The 87% is pretty much on a par with normal.
This means 305k cases were reached but 42.5k weren't.
The 87% is pretty much on a par with normal.


There's been a rise in the past couple of weeks, however, in the numbers of cases handled by PHE health protection teams (more complicated cases/outbreaks), now at 12,585 up from 5,759 just two weeks before.
A disappointing 75% of cases - 228k - provided details of contact details.

And these 228k cases identified just 614k contacts - or 2.0 contacts per case, down from 2.5 at start of Dec.
Broken down by those handled by PHE health protection teams mean is just 0.2 contacts per case (median 8), and 2.1 contacts per case for those managed by T&T (median 2)
Broken down by those handled by PHE health protection teams mean is just 0.2 contacts per case (median 8), and 2.1 contacts per case for those managed by T&T (median 2)

We pick this up a bit in our @HealthFdn performance tracker this week.
I find it very hard to believe that avg contacts per case has barely budged through tiers/Christmas/lockdown.
Instead I think it has much more to do with implications of disclosure.
health.org.uk/news-and-comme…
I find it very hard to believe that avg contacts per case has barely budged through tiers/Christmas/lockdown.
Instead I think it has much more to do with implications of disclosure.
health.org.uk/news-and-comme…

For those handled by PHE health protection teams I find it a bit more believable - some people will be working in COVID secure environments, always in PPE etc with no contacts, and others are part of significant outbreaks (v low mean, higher median).
Percentage of contacts reached has remained very high.
570k (93%) reached, 44k not reached.
570k (93%) reached, 44k not reached.

And some positive news on timeliness. Percentage of cases reached within 24hrs has gone up a bit, meaning the overall speed of the time from case transferred to contact reached has improved.


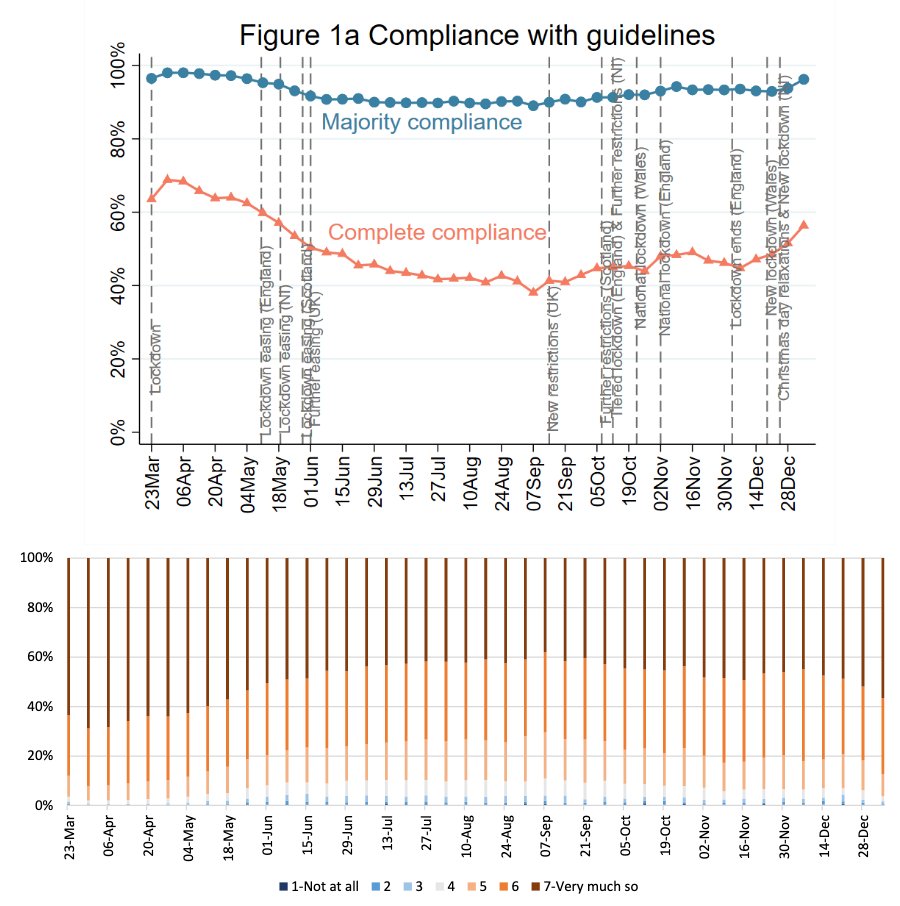
Finally, weekly reminder that these data tell us nothing about people's compliance with isolation.
It's something the majority of people are trying to do but not everybody has the £, social, or practical means available.
No-one should have to choose between isolation and keeping their job, paying bills, or being able to care for someone in need.
Fig=UCL COVID social study
No-one should have to choose between isolation and keeping their job, paying bills, or being able to care for someone in need.
Fig=UCL COVID social study
Wk 33 T&T @felly500 @trishgreenhalgh @deb_cohen @martinmckee @carolecadwalla @mgtmccartney @ADPHUK
@Jeanelleuk @fascinatorfun @profchrisham @petermbenglish
@HPIAndyCowper @Davewwest @HSJEditor @KateAlvanley
@IndependentSage @nedwards_1 @chrischirp @SamanthaJonesUK
@Jeanelleuk @fascinatorfun @profchrisham @petermbenglish
@HPIAndyCowper @Davewwest @HSJEditor @KateAlvanley
@IndependentSage @nedwards_1 @chrischirp @SamanthaJonesUK
@ewanbirney @TimHarford @devisridhar @FurberA @andrewleedr @kieran_walshe @DrChadborn @Dr_D_Robertson
• • •
Missing some Tweet in this thread? You can try to
force a refresh