Latest @PHE_uk COVID surveillance report now out. Covers 18th-24th Jan.
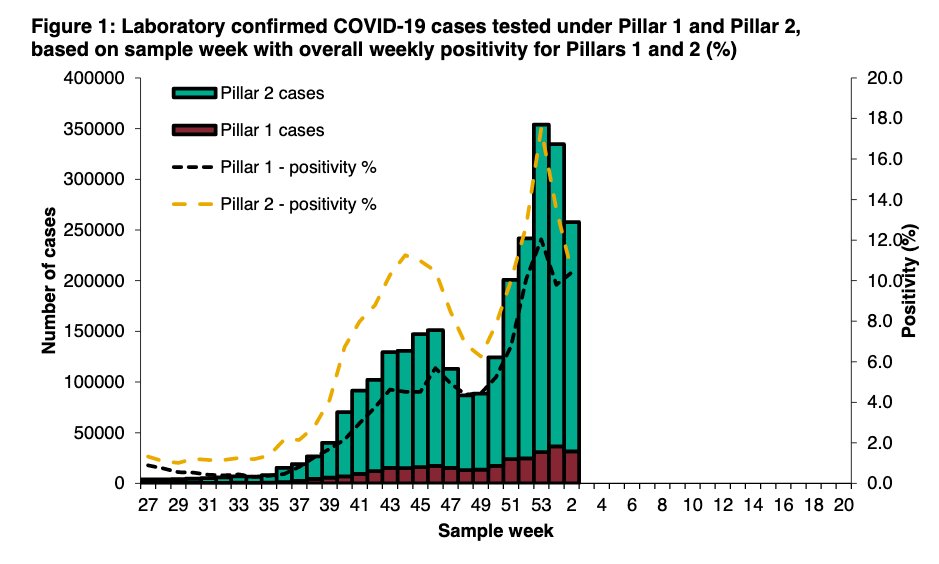
Cases have peaked, as have hospitalisations in some regions.
But hospital occupancy remains as high as ever and deaths are still rising. Please continue to take care. 🧵
gov.uk/government/sta…
Cases have peaked, as have hospitalisations in some regions.
But hospital occupancy remains as high as ever and deaths are still rising. Please continue to take care. 🧵
gov.uk/government/sta…

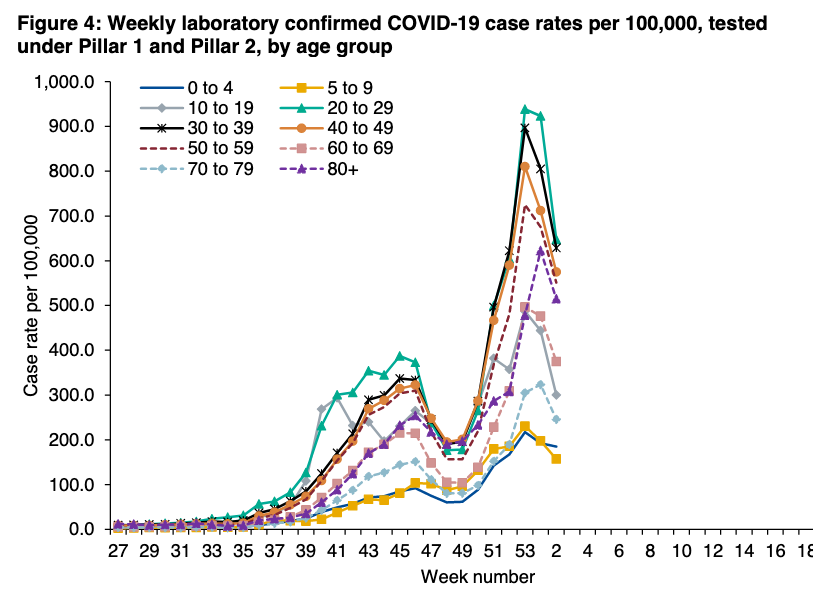
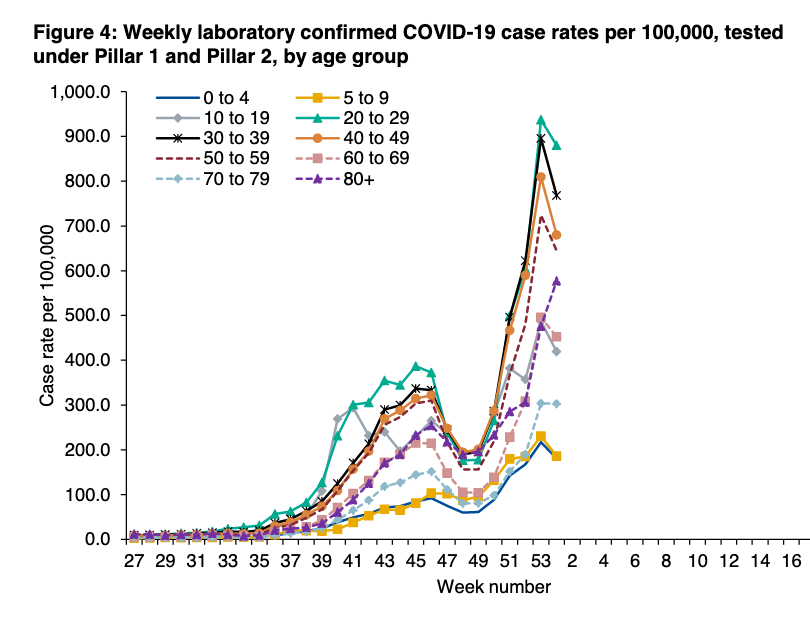
Recorded case rates are falling in *all* age groups. And almost as quickly as the rose. This is a good thing.
The @ONS COVID infection survey is due to update tomorrow which will be helpful to see how closely the PHE data reflect community prevalence in the survey.
The @ONS COVID infection survey is due to update tomorrow which will be helpful to see how closely the PHE data reflect community prevalence in the survey.

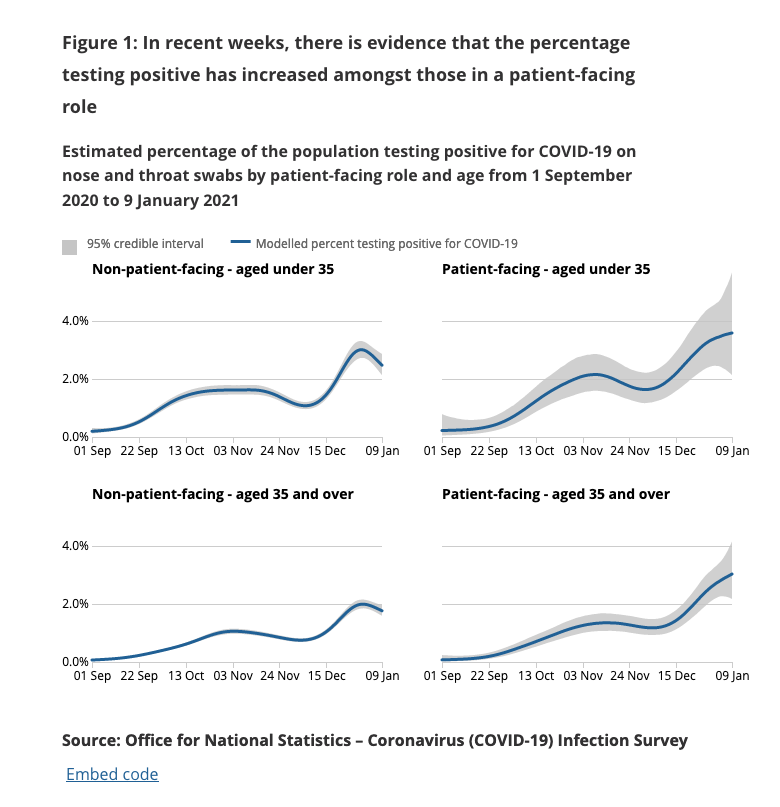
Also the % of PCR tests that are positive (positivity %) in pillar 2 is also reassuringly falling.
However, not in pillar 1 for most ages. Pillar 1 includes NHS or PHE lab tests for health care workers and those in clinical need.
However, not in pillar 1 for most ages. Pillar 1 includes NHS or PHE lab tests for health care workers and those in clinical need.

This is partly explained because there are a lot of very unwell people still. But also may be partly due to health and care workers getting COVID.
Yesterday's @ONS survey release up to 9th Jan showing higher infection rates in patient-facing jobs may support this idea.
Yesterday's @ONS survey release up to 9th Jan showing higher infection rates in patient-facing jobs may support this idea.
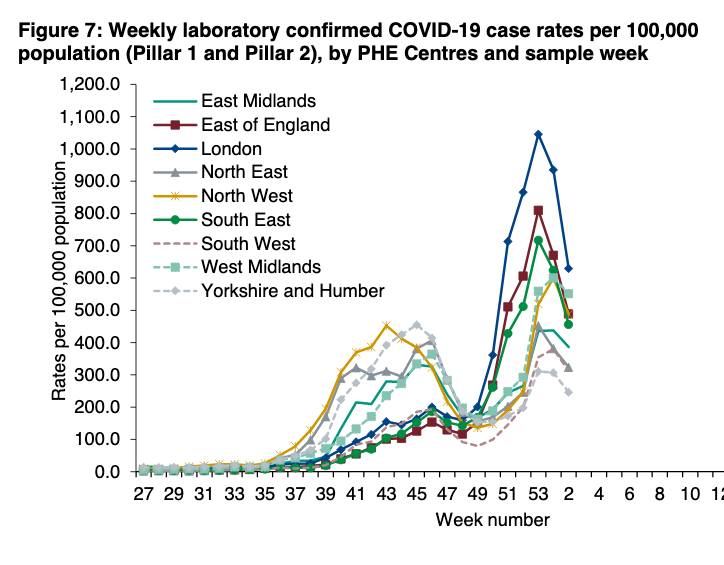
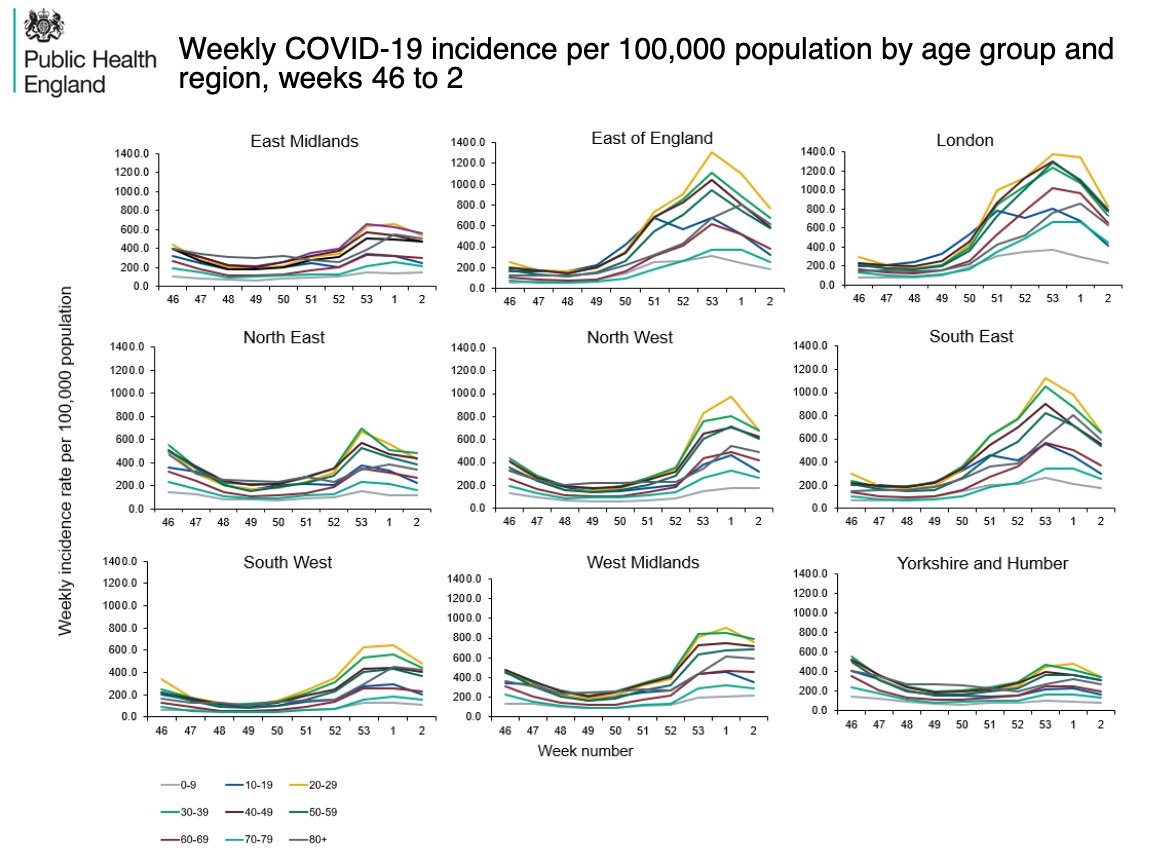
Infection rates are also now falling across all regions which is also very positive news.
But they do seem to be falling more slowly for some ages than others, e.g. age 80+ where other age groups are overtaking as case rates drop.
But they do seem to be falling more slowly for some ages than others, e.g. age 80+ where other age groups are overtaking as case rates drop.


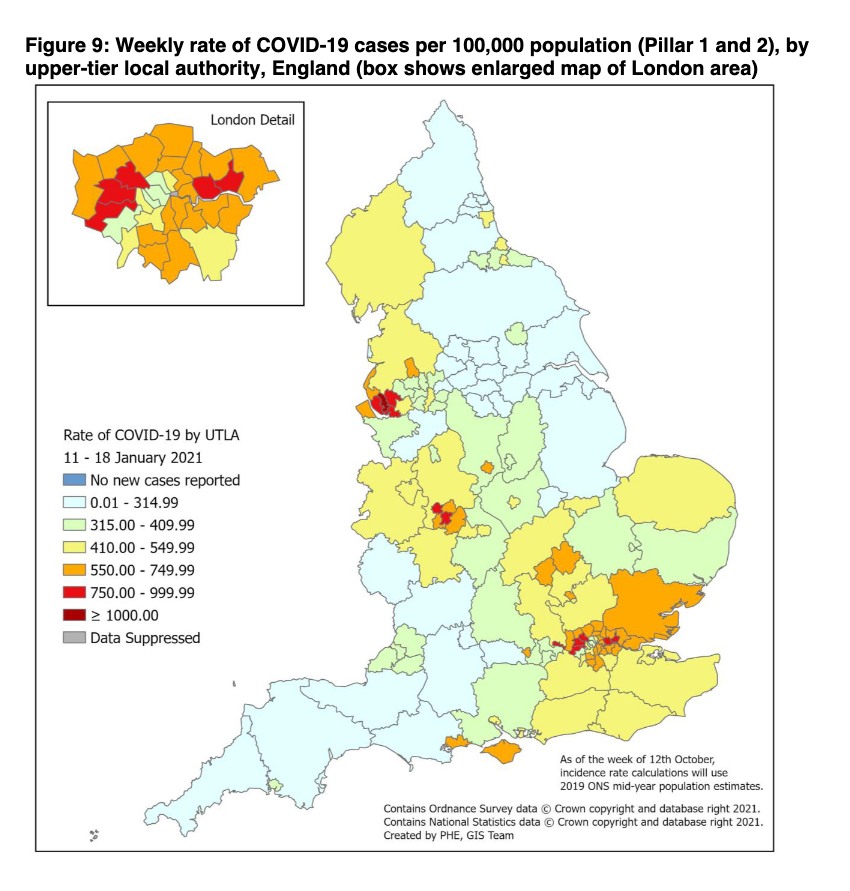
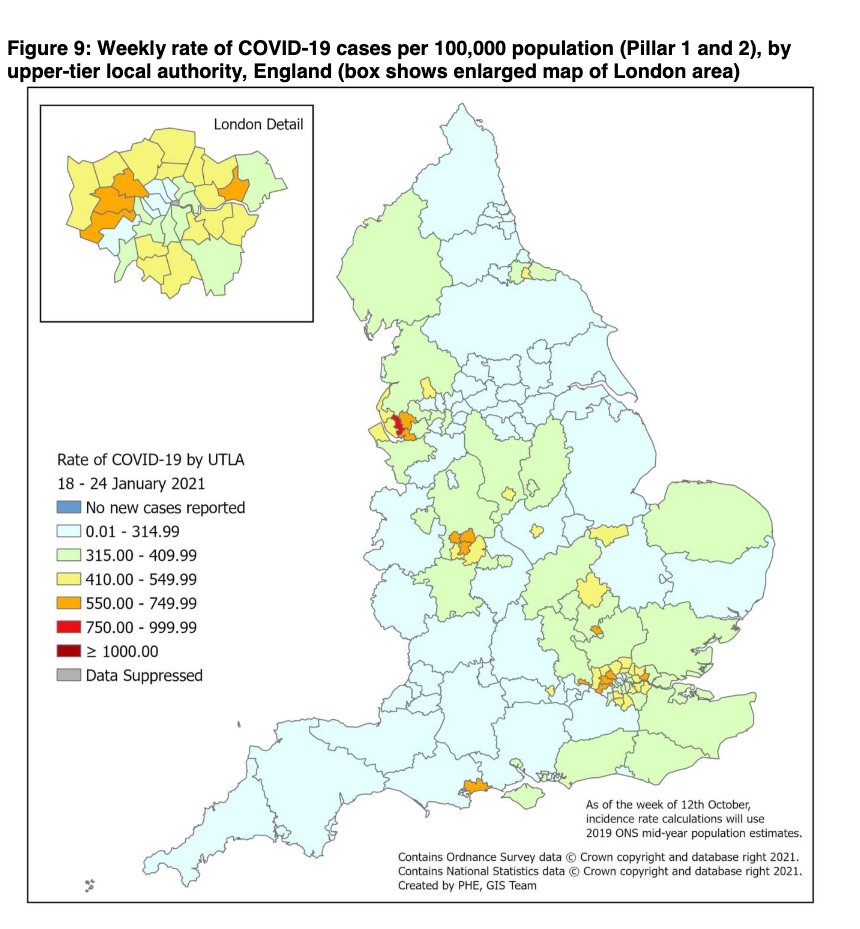
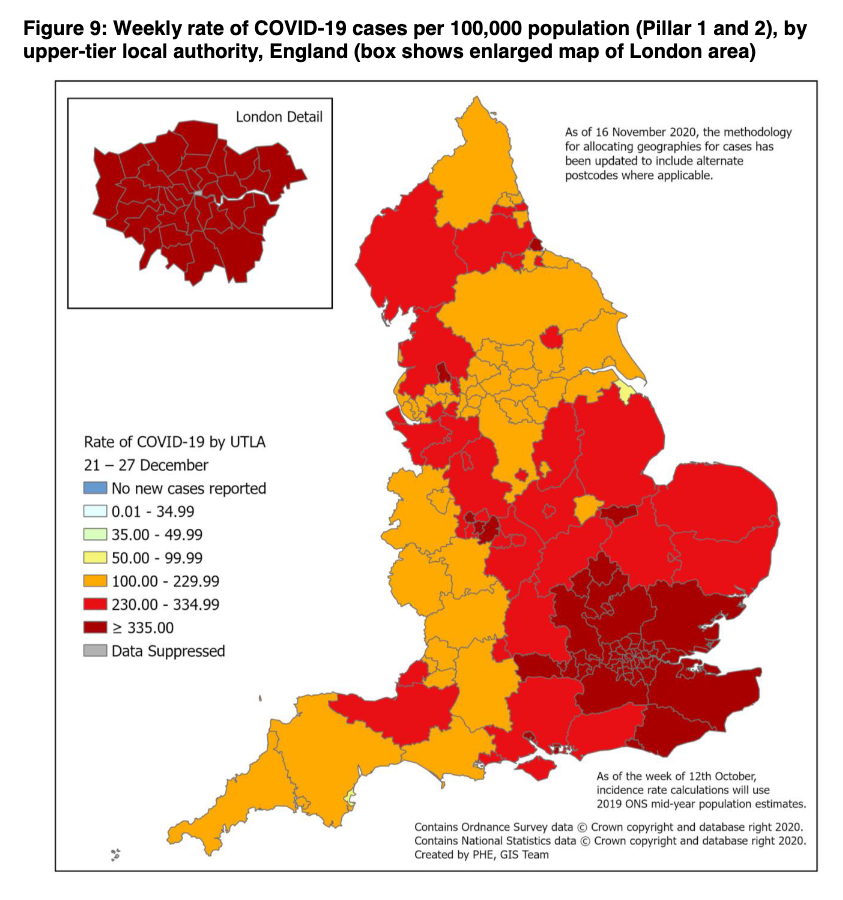
The map by Upper Tier Local Authority is looking much healthier. BUT note:
-still some areas of really high case rates, and
-that everything coloured blue is up to 315 cases per 100,000 per week.
Just three weeks ago there was only one category higher than this.
-still some areas of really high case rates, and
-that everything coloured blue is up to 315 cases per 100,000 per week.
Just three weeks ago there was only one category higher than this.
Still big differences by ethnicity and deprivation. But again, case rates falling in all groups.


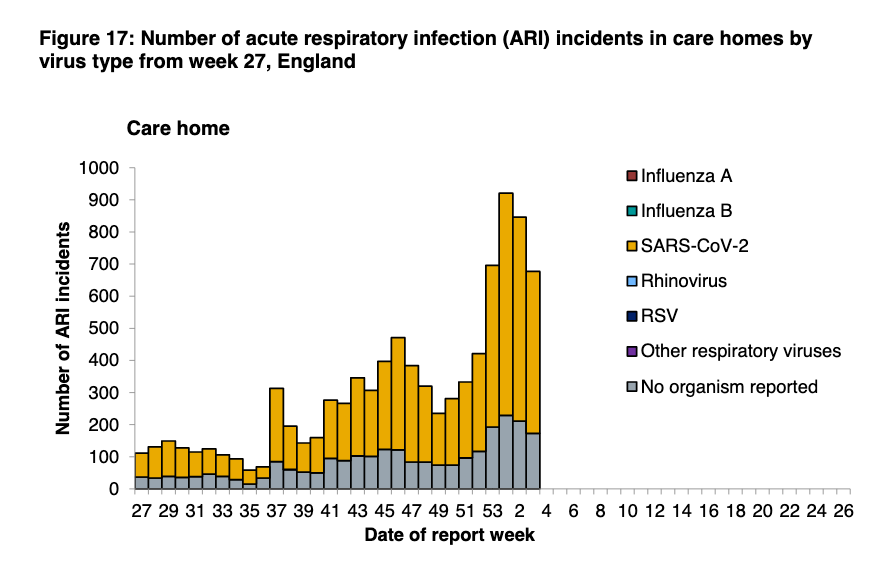
Really good to see the fall in the number of incidents in care homes reported to PHE dropping again. Hopefully the vax is having a role.
But numbers are still generally v high: over 700 incidents reported with over 500 having a link to a known case of COVID.
But numbers are still generally v high: over 700 incidents reported with over 500 having a link to a known case of COVID.
Number of hospital incidents has remained reassuringly static week on week (as have incidents in workplaces)


And so have incidents in schools.
But as with last week, note the over-representation of SEN schools which remain largely open and where social distancing is really hard if not impossible.
But as with last week, note the over-representation of SEN schools which remain largely open and where social distancing is really hard if not impossible.

On the face of it, hospital admissions look to have peaked - and for all ages, including 80+.
BUT this is not the case in West and East Mids, and Yorkshire and Humber. Regional differences are still very stark.
BUT this is not the case in West and East Mids, and Yorkshire and Humber. Regional differences are still very stark.


And hospital admissions peaking is just the first step to freeing up hospital beds.
People stay for a while - the number of hospitalised patients is still double that of the first wave peak.
Numbers will fall, but it'll take months to get back to anywhere near normality.
People stay for a while - the number of hospitalised patients is still double that of the first wave peak.
Numbers will fall, but it'll take months to get back to anywhere near normality.

ICU bed admissions looks to also have just about peaked nationally.


But again this hides variation by region *and* age.
ICU bed use is generally younger people who will often need to stay for a long time.
And at best, admissions are only plateauing for 45-75y/o, and still rising in parts of North, Yorks and Humber, and Midlands.
ICU bed use is generally younger people who will often need to stay for a long time.
And at best, admissions are only plateauing for 45-75y/o, and still rising in parts of North, Yorks and Humber, and Midlands.


With the lag between infection and death, death rates are still going up and will hopefully peak v soon.
Much has been made of passing the awful milestone of 100,000 people dying from COVID in the UK. But there will still be many thousands more.
Much has been made of passing the awful milestone of 100,000 people dying from COVID in the UK. But there will still be many thousands more.

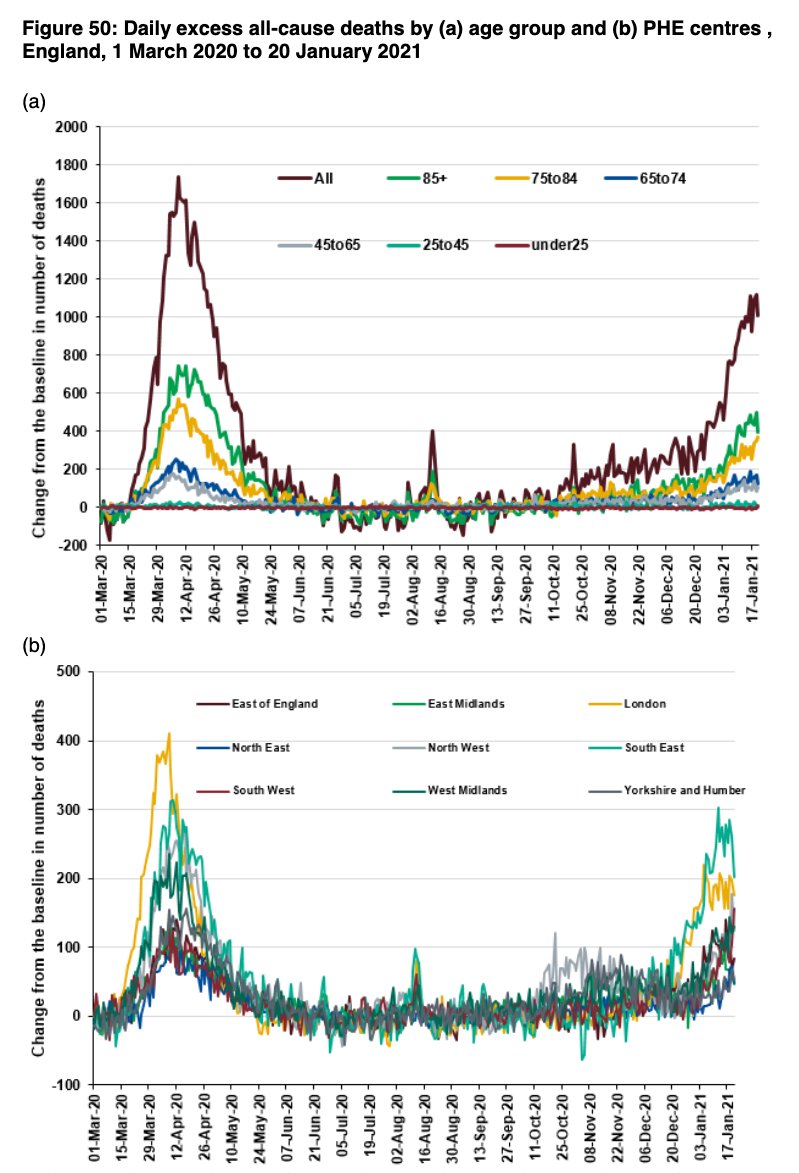
Finally, excess mortality continues to grow in all age groups over 45 yrs.

Whilst hospital and ICU occupancy remains high, it remains crucial to follow lockdown rules, get tested if you have symptoms, and ask friends, neighbours, your local gov if you need help.
There's light. Cases have peaked and vaccine roll-out continues at an incredible pace.
There's light. Cases have peaked and vaccine roll-out continues at an incredible pace.

PHE surveil rpt @felly500 @deb_cohen @martinmckee @carolecadwalla @mgtmccartney @ADPHUK @Jeanelleuk
@fascinatorfun @profchrisham @petermbenglish @HPIAndyCowper @Davewwest @HSJEditor @KateAlvanley
@IndependentSage @nedwards_1 @SamanthaJonesUK @ewanbirney @FurberA @Dr_D_Robertson
@fascinatorfun @profchrisham @petermbenglish @HPIAndyCowper @Davewwest @HSJEditor @KateAlvanley
@IndependentSage @nedwards_1 @SamanthaJonesUK @ewanbirney @FurberA @Dr_D_Robertson
• • •
Missing some Tweet in this thread? You can try to
force a refresh