Latest Test & Trace data - 14-20th Jan.
-Cases and tests down (except rapid lateral flow device use increasing).
-T&T turnaround times & contact tracing either similar or improving.
TL,DR: probably not great for RTs, but good for tackling COVID.
🧵
gov.uk/government/pub…
-Cases and tests down (except rapid lateral flow device use increasing).
-T&T turnaround times & contact tracing either similar or improving.
TL,DR: probably not great for RTs, but good for tackling COVID.
🧵
gov.uk/government/pub…

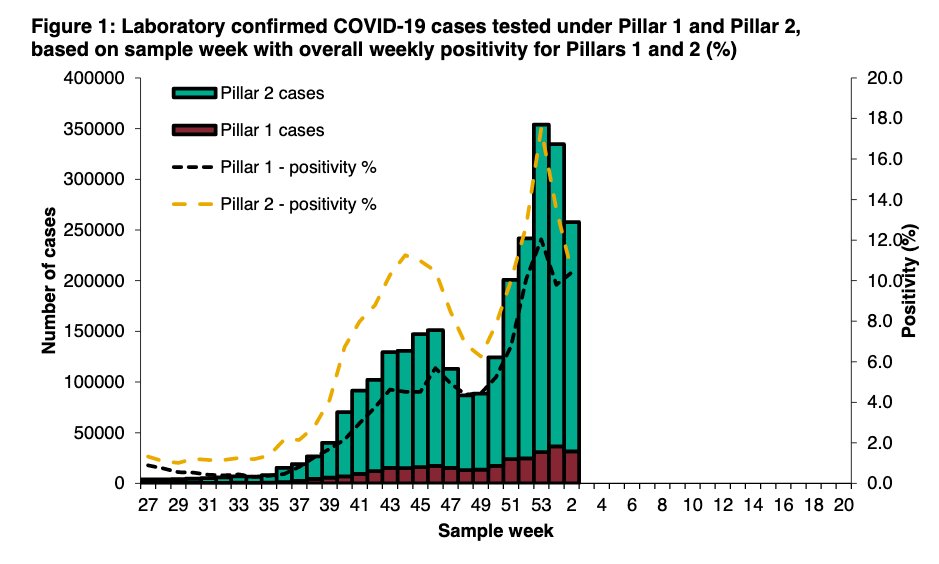
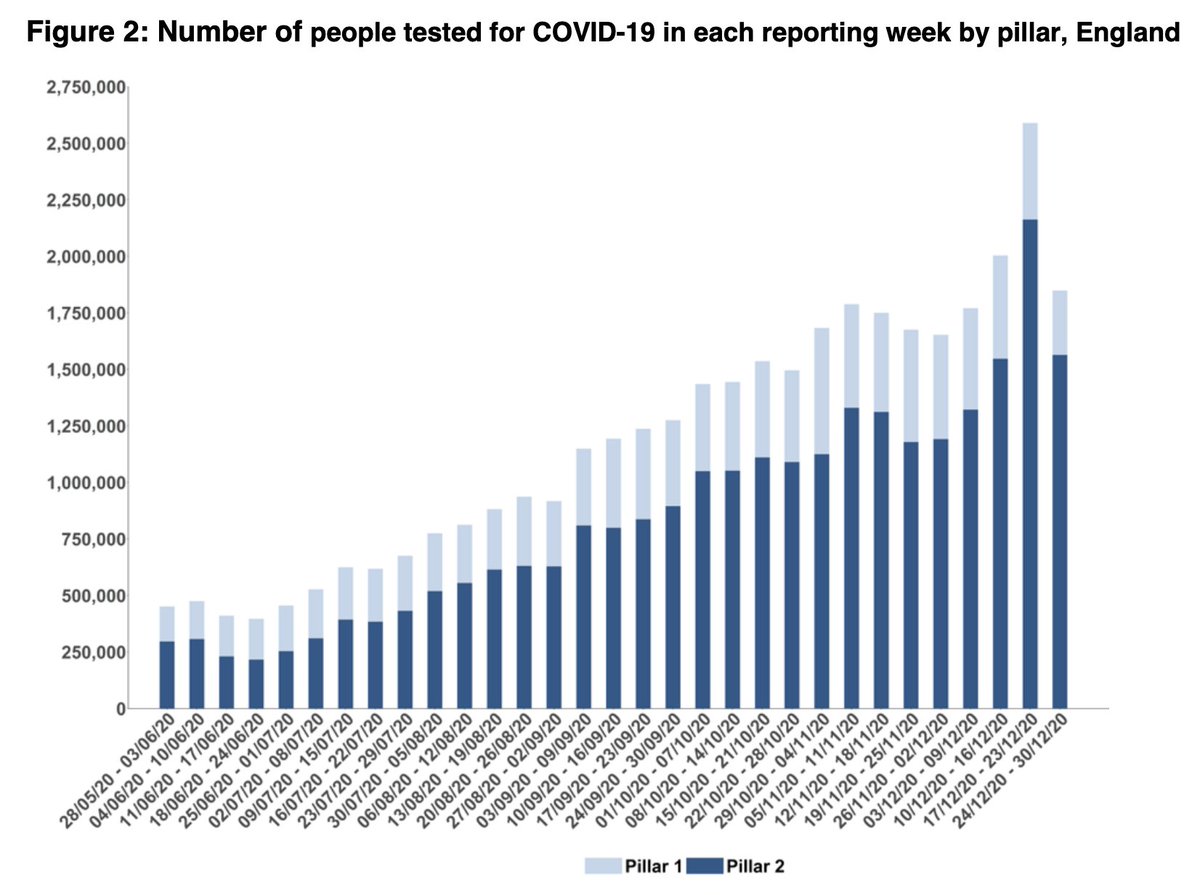
As case rates fall, so are the numbers of people getting tested - down 5% on last week.


In pillar 2 - community testing - the number of rapid LFD tests being used continues to rise, 1.3m tests used and 12.8k people tested positive (972k tests last week with 14.3k positive).
Whereas the number of P2 PCR tests was down 17%.
Whereas the number of P2 PCR tests was down 17%.


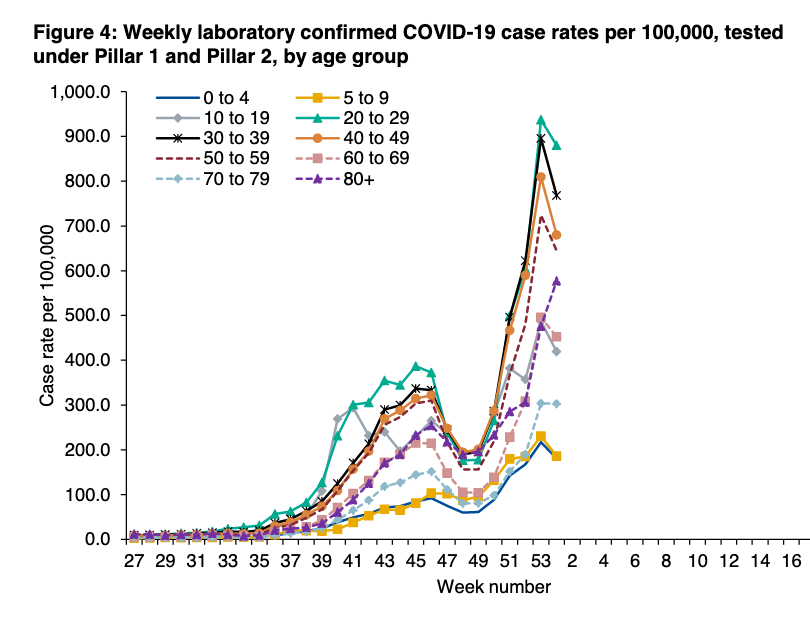
Positivity not meaningful for LFD tests, but for PCR tests in pillar 2, it's falling fast. For pillar 1 (hospital/health care workers), positivity isn't falling so much.
More in this thread
More in this thread
https://twitter.com/ADMBriggs/status/1354832349964464133?s=20
As before, it would be helpful to know number of individuals testing with LFDs each week (rather than number of tests done), as well as explicitly separating out symptomatic from asymptomatic (some asymptomatic testing - for example in care homes, still uses PCR).

Really good to see test turnaround time continuing to improve.
Still a bit of a way to go to reach 80% of in-person test results within 24hrs, but getting closer.
Still a bit of a way to go to reach 80% of in-person test results within 24hrs, but getting closer.


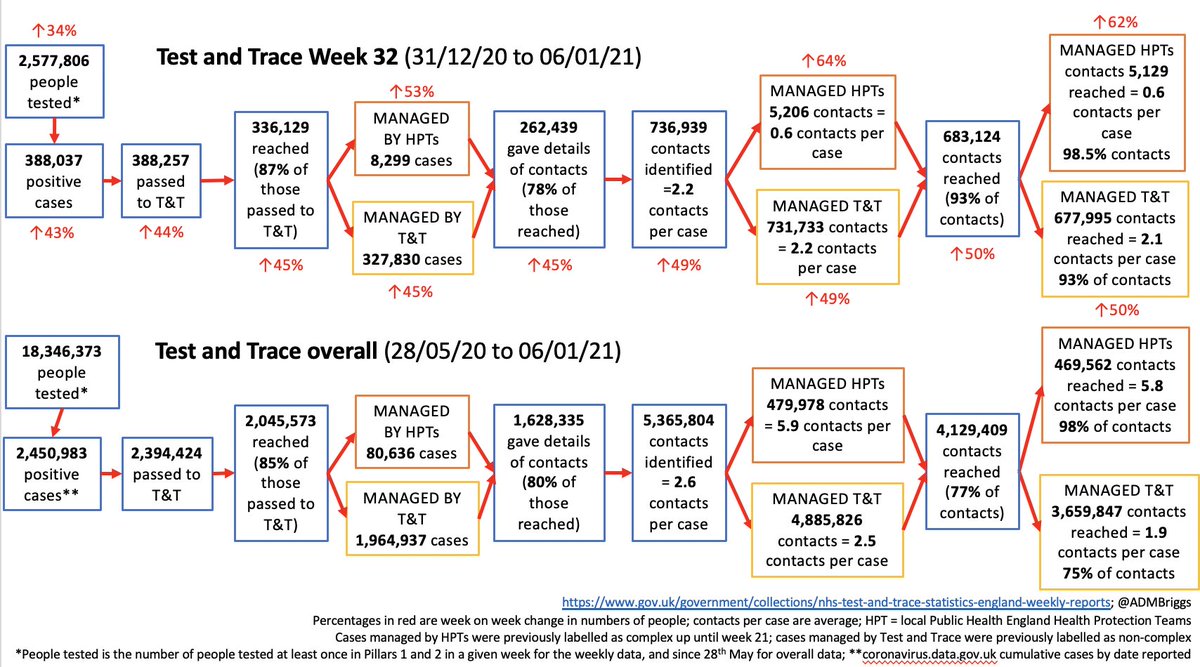
For contact tracing, of 275,351 cases transferred to the system, 86% were reached (similar to recent weeks)
This means 38,768 cases weren't reached of which 4,577 didn't provide contact details (I still struggle with the idea that this many people don't give contact details)
This means 38,768 cases weren't reached of which 4,577 didn't provide contact details (I still struggle with the idea that this many people don't give contact details)

Of the cases, 74% (175,508 cases) provided details of contacts.

Identifying 470,950 close contacts - 23% fewer than last week which reflects fewer cases being handled.

The number of contacts per case is the same as last week at 2.0 overall and 2.1 for cases handled by the national team.
This still feels far too low, as discussed last week.
This still feels far too low, as discussed last week.
https://twitter.com/ADMBriggs/status/1353470140608819202?s=20
Percentage of those contacts reached has remained fairly high at 93% (both overall, and for contacts handled by the national team).
That means 439k contacts were reached, and 32k weren't of which half didn't have contact details.
That means 439k contacts were reached, and 32k weren't of which half didn't have contact details.

For the time taken for all this, alongside better test turnaround times, the time taken to reach contacts from when the case is transferred is also slightly better this week.
But still definitely room for improvement.
But still definitely room for improvement.


None of this tells us about willingness to get tested in the first place or compliance with isolation.
We know from surveys that these are really important issues, and they'll remain unresolved until people are confident they will get the support they need if testing positive.
We know from surveys that these are really important issues, and they'll remain unresolved until people are confident they will get the support they need if testing positive.
Wk 33 T&T @felly500 @trishgreenhalgh @deb_cohen @martinmckee @carolecadwalla @mgtmccartney @ADPHUK
@Jeanelleuk @fascinatorfun @profchrisham
@petermbenglish @HPIAndyCowper @Davewwest @HSJEditor
@KateAlvanley @IndependentSage @nedwards_1 @chrischirp
@SamanthaJonesUK
@Jeanelleuk @fascinatorfun @profchrisham
@petermbenglish @HPIAndyCowper @Davewwest @HSJEditor
@KateAlvanley @IndependentSage @nedwards_1 @chrischirp
@SamanthaJonesUK
@ewanbirney @TimHarford @devisridhar @FurberA @andrewleedr @kieran_walshe @DrChadborn
@Dr_D_Robertson
@Dr_D_Robertson
• • •
Missing some Tweet in this thread? You can try to
force a refresh