1. I typically focus exclusively on crypto options but GME's wild moves last week led me to take a look into its options chain. This analysis only looks at GME options data up to Jan 29, 2021 and does not cover today’s move.

***None of this information is investing advice!!***
2. Let’s start by taking a look at the realized vol for GME. Clearly we can see it has shot upwards near multi-year highs. Furthermore, we can see the vol of vol in the past followed a mean-reverting process right up until January 2021. ImageImage
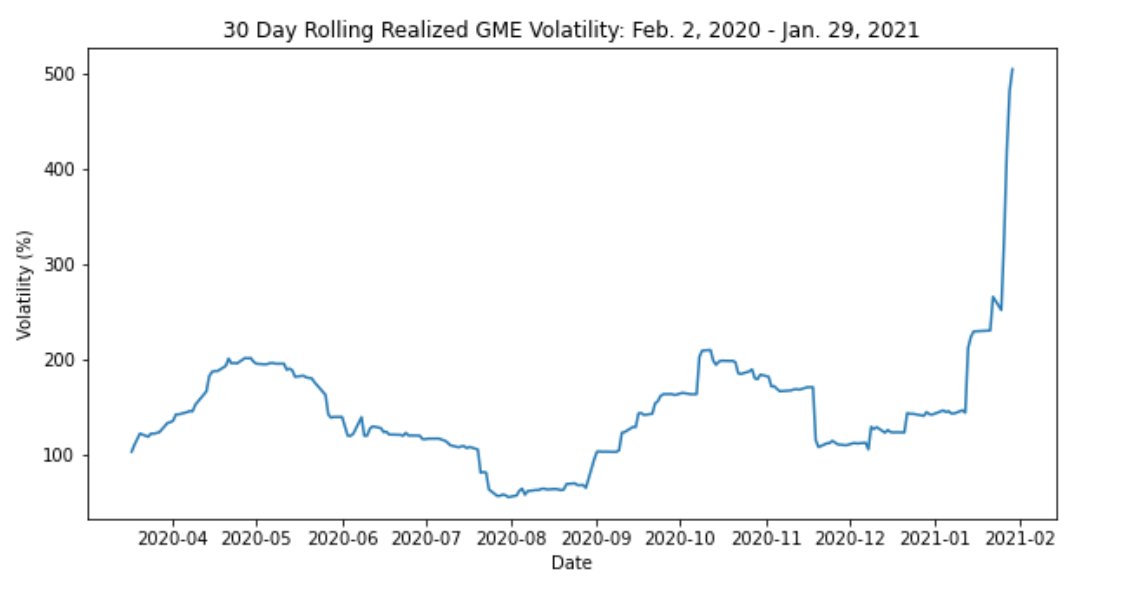
3. Tricky to say whether it’ll mean-revert in the near future- if we see a crash in GME's price we could see vol & vvol stay near these high levels. Regardless, I would be very surprised if we don't see vols mean-revert over the next few weeks (vols usually don't stay that high).
4. Interestingly, even up until mid Jan, 30 day GME RV was trading nearly 20 vol points higher than 1 month ATM IV. In most cases we’d expect the opposite - IV tends to be higher than RV because the market usually prices higher vol in the future. Image
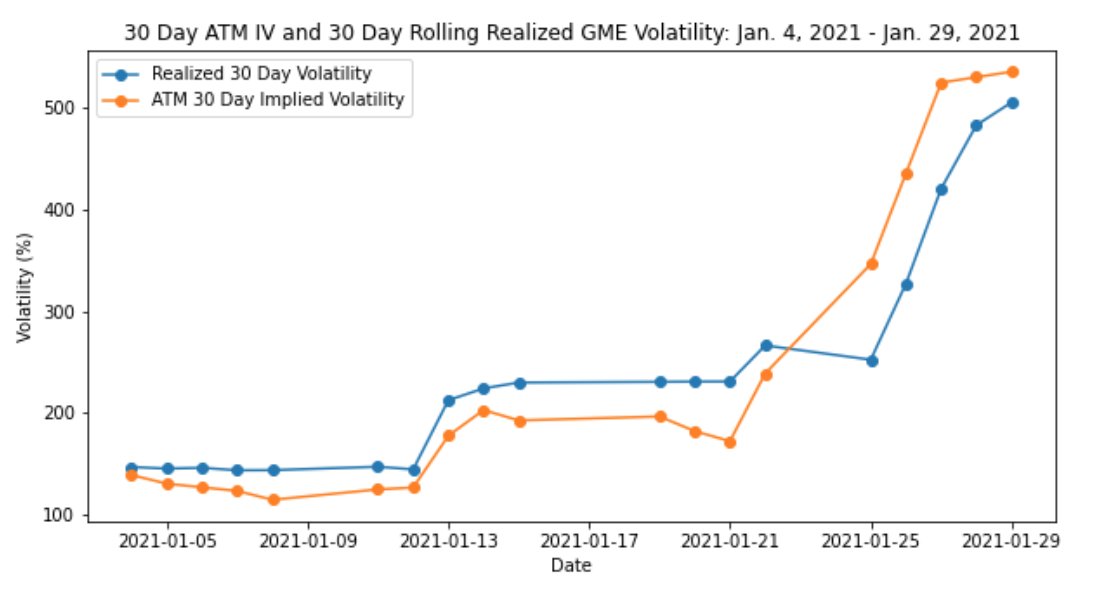
5. In other words, for most of January, option markets were pricing in lower future realized vol. However, after Jan. 25th, this relationship reversed and IV spiked massively higher (right after GME jumped from $65 -> $96 overnight).
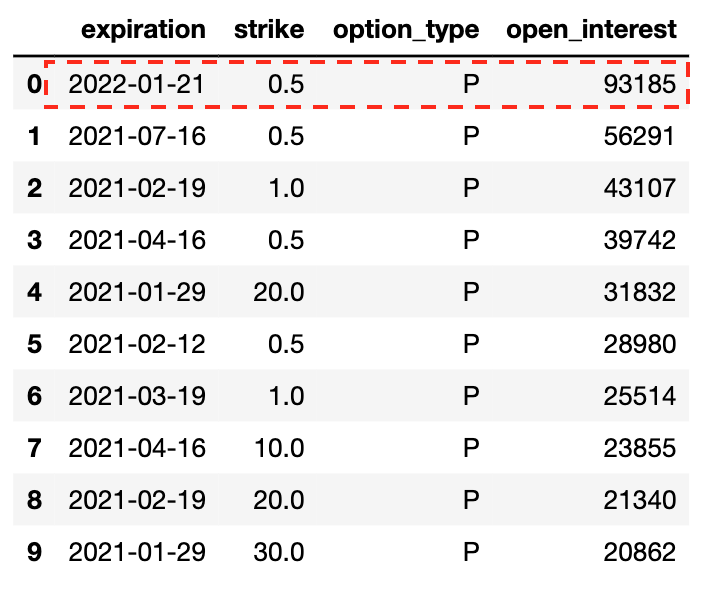
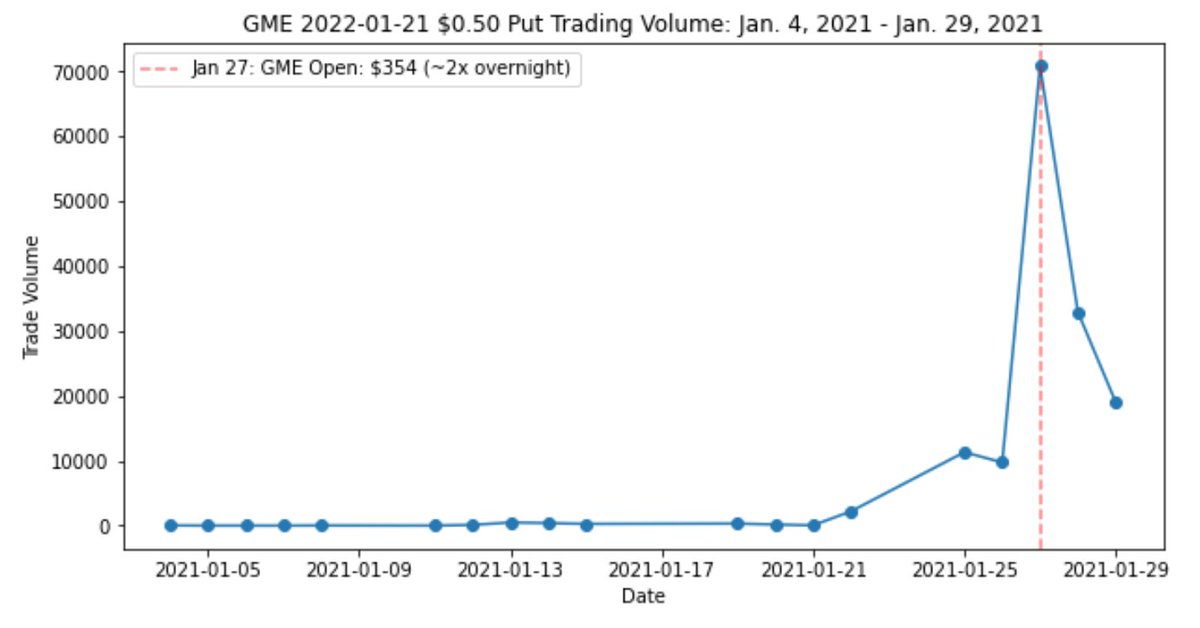
6. Let’s now take a look at open interest and trade volumes. Despite the massive run up in GME’s price, at the beginning of Jan. 29, we can see the highest OI was in a low strike put - specifically the $0.5 Jan 2022 put. Image
7. Similar story for trade volumes - the teeny option had the highest volume for this day. We can see some large volumes in deep OTM calls but the overall flow was dominated by puts. I’d guess most of the put volume is from ppl buying puts from MMs rather than ppl selling puts. Image
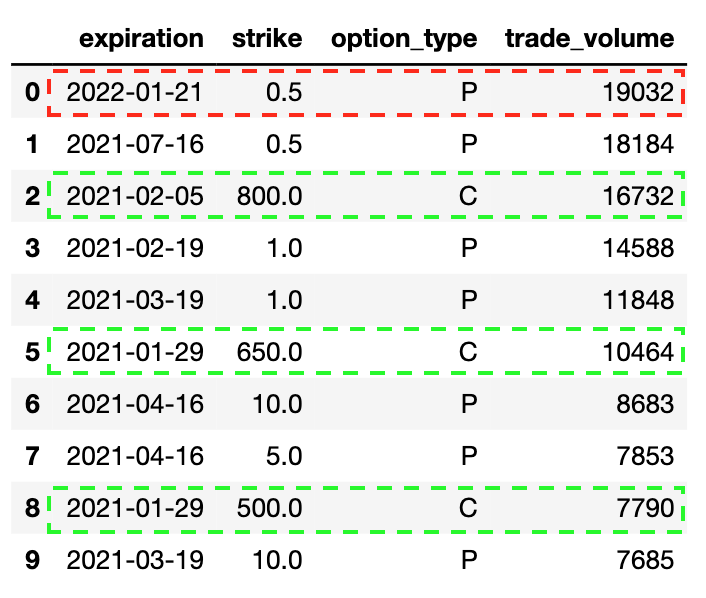
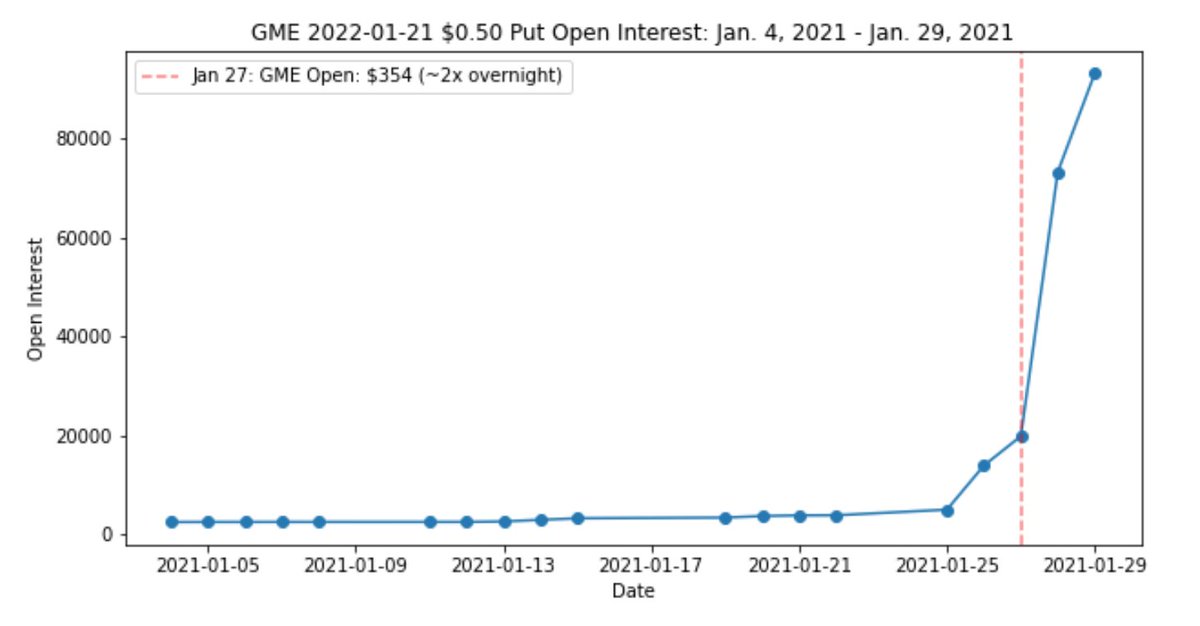
8. I'm thinking someone is betting on a major repricing of risk here (ie: huge gap downwards). Below are the plots showing the overall OI and volume flows for this particular option over the past month. ImageImage
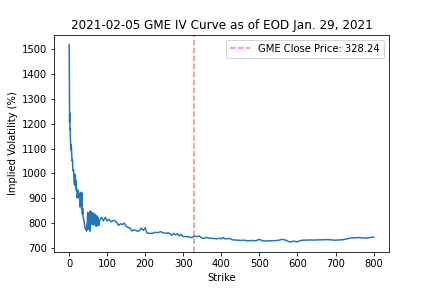
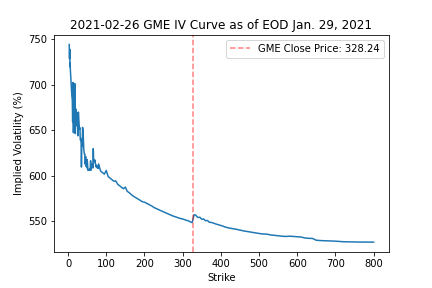
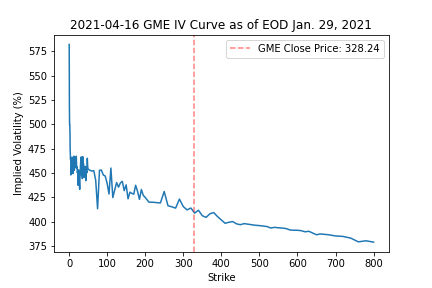
9. We can also look at some IV skew plots to see how MMs are pricing vol...
10. Here's some short-dated options ( < 1 month): ImageImageImageImage
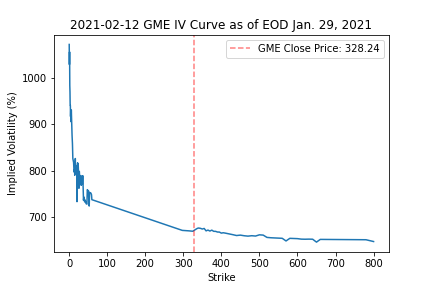
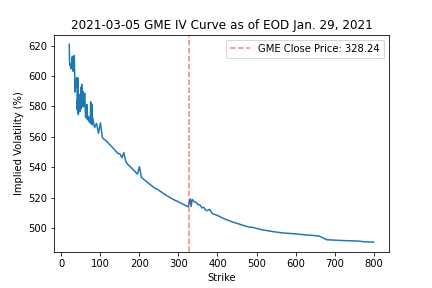
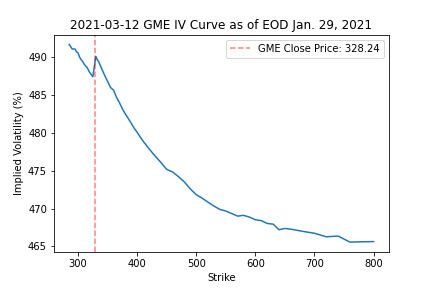
11. Mid-dated options (2-3 months): ImageImageImageImage
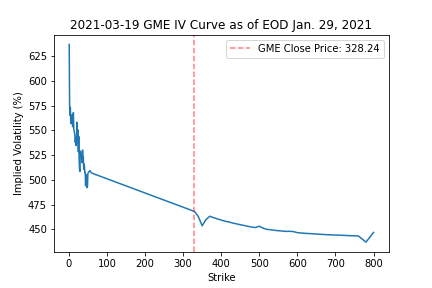
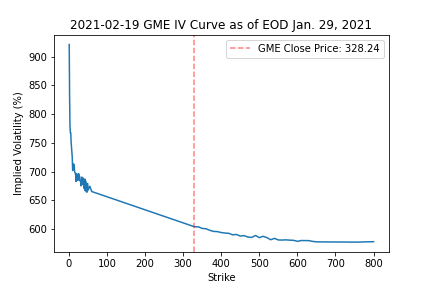
12. And lastly some longer-dated options (3 months - 2 years): ImageImageImageImage
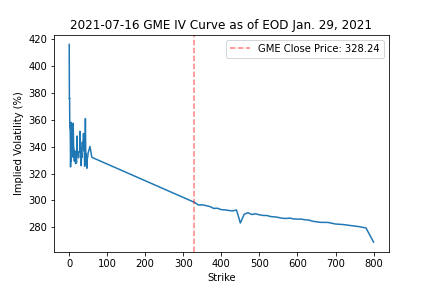
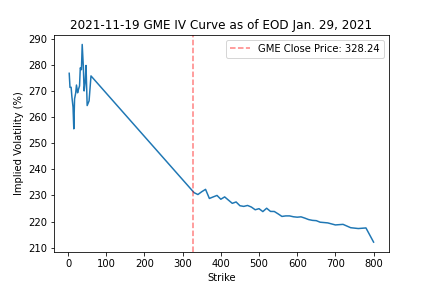
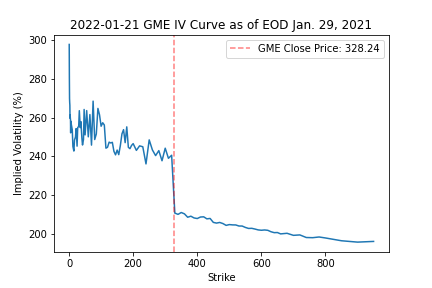
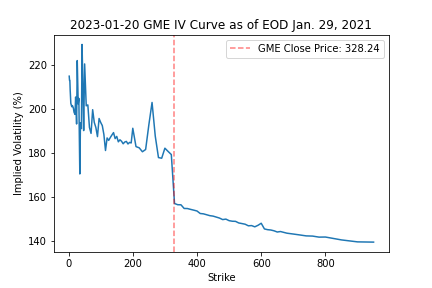
13. All across the board, the vol skew is massively higher for puts than calls. It seems MMs are desperately bidding put IV to compensate themselves for the risk they’re taking by making markets for these downside options.
14. Recall, selling puts loses $ when asset prices go down - hence MMs are justifiably terrified of downward jumps. As a result, buying puts outright may not actually give the protection you need against a collapse in price if you’re paying too much in vol.
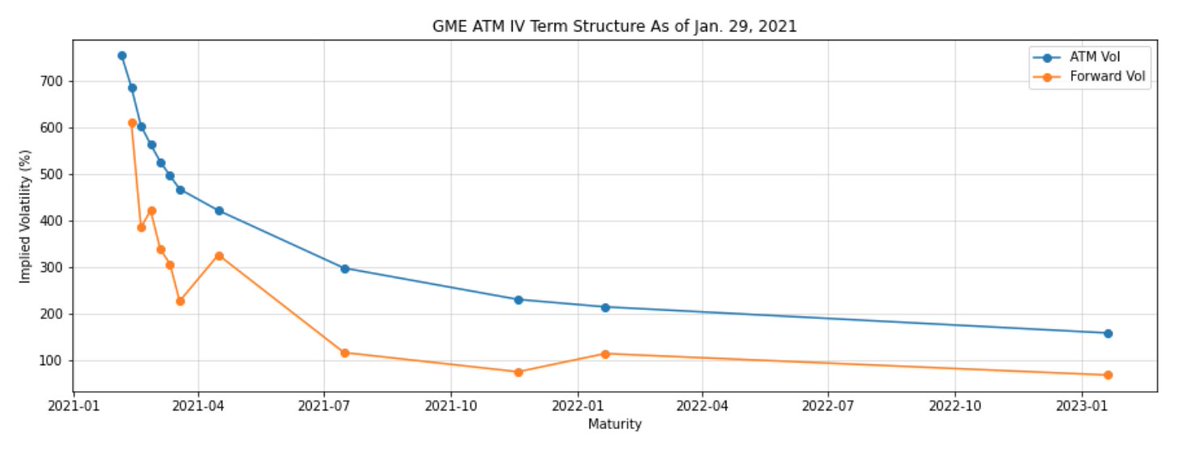
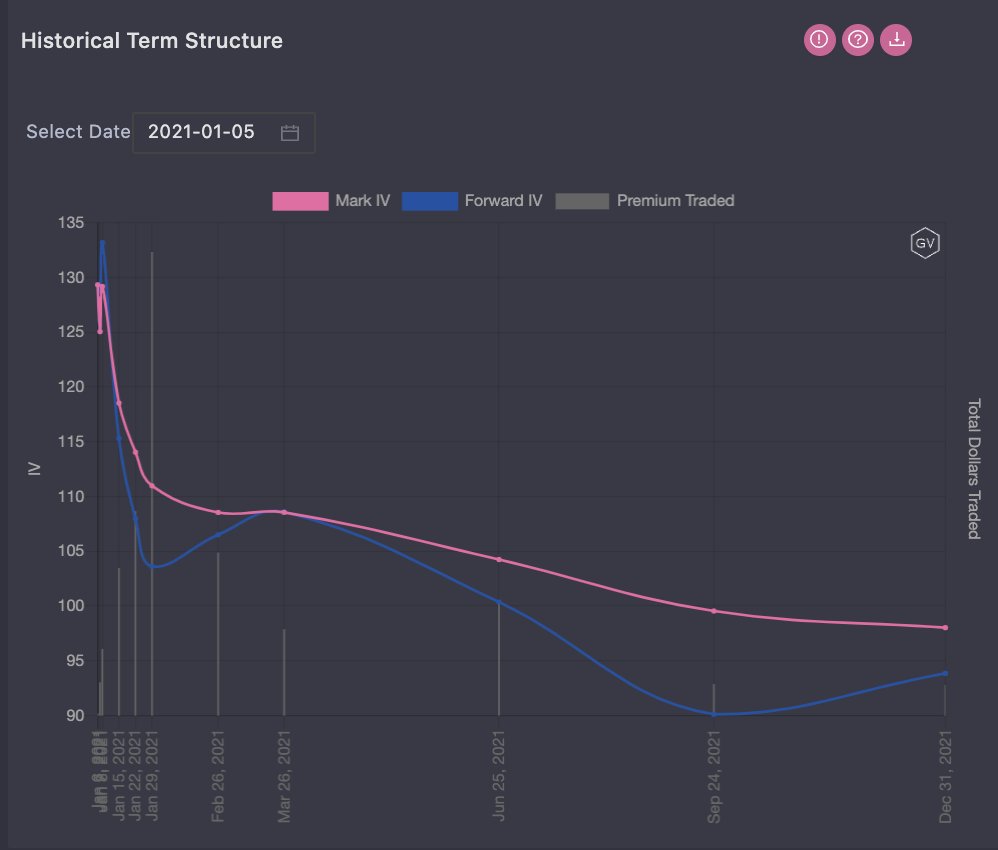
15. Here’s the ATM IV term structure. It reminds me of BTC a few weeks ago when its vol term structure was inverted as shown by @GenesisVol's plot. Forward vols for GME are suggesting lower vol across the curve which may be good opportunities for short vol positions. ImageImage
16. From a trading perspective I’m still thinking of how to approach this. Although the vol skew for selling puts is attractive there’s still a lot of downward jump risk. If we sell puts, I’d imagine the delta-hedging would need to be very aggressive.
17. For downside directional trades, I’m thinking a put spread or even selling a 1x2 ratio put spread could work for a major leg down. For upside, a potentially cheaper way than just buying calls could be a risk-reversal -- selling an OTM put and buying an OTM call.
18. The nice thing with the RR is we sell expensive put IV and buy cheaper upside vol so we may even be able to get paid to take on this position. However, the standard RR leaves us exposed to downside jump risk which may result in poor risk/reward in this situation.
19. Although headlines suggest bullish moves ahead for GME, option markets don’t seem to agree. Not saying it can’t happen but successful option MMs like Citadel have an edge trading against the market. Something to consider before holding the line w/ deep OTM calls…
20. Would be happy to get some insights, suggestions, or feedback from the experts:
@Ksidiii
@OrthoTrading
@darshanvaidya
@SinclairEuan
@cmsholdings
@ShreyasChari
@mgnr_io

• • •

Missing some Tweet in this thread? You can try to force a refresh
 

Keep Current with Samneet Chepal

Samneet Chepal Profile picture

Stay in touch and get notified when new unrolls are available from this author!

Read all threads

This Thread may be Removed Anytime!

PDF

Twitter may remove this content at anytime! Save it as PDF for later use!

Try unrolling a thread yourself!

how to unroll video
  1. Follow @ThreadReaderApp to mention us!

  2. From a Twitter thread mention us with a keyword "unroll"
@threadreaderapp unroll

Practice here first or read more on our help page!

More from @samchepal

26 Jan
1. I’ve been looking at how tradfi markets are pricing options for public co’s with large exposures to crypto relative to the BTC options market on @DeribitExchange. For this analysis, I focused on @MicroStrategy (MSTR) and Marathon Group (MARA).
2. First, it’s worthwhile exploring how MSTR and MARA trade w.r.t BTC. Ever since MSTR’s buying spree, we’ve seen its beta relative to BTC shift within the +0.6 to +1.0 range. Similarly, we can see MARA is more volatile with a beta of +1.0 to +3.0 in the past few months.
3. In this analysis I'm going to use the rolling 60 day beta values:

- MSTR Beta: 0.76
- MARA Beta: 1.94

In other words, for a 1% increase in BTC we should expect MSTR and MARA to increase by 0.76% and 1.94% respectively.
Read 17 tweets
15 Jan
1. This legendary $36k call trade led me down a rabbit hole into the world of higher order option greeks to analyze this trade using past historical data. This was a good learning opportunity and I wanted to share some stuff I've been exploring.
2. The $36k JAN-29-2021 calls began trading on @DeribitExchange on Oct. 31, 2020 and had an initial delta of around 3%. At this time, BTC’s index price was trading around $13.5k. On this date, it seemed like a long shot that prices could do a ~3x within 90 days.
3. My guess is the buyer of these calls was trading a re-pricing of risk as opposed to speculating that the price of BTC would actually be >= $36k on Jan 29/2021 (one thing we can say with confidence is they were smart and used @tradeparadigm to avoid massive slippage).
Read 24 tweets
30 Dec 20
1. Congrats to the @opyn_ team for launching V2 - very exciting! I’m happy that the new V2 dashboard has a clean layout with greeks and implied vols for each respective option. It’s also a pleasant surprise to see the prices are closely in line with @DeribitExchange's options.
2. Many folks in this space use options to make directional bets on the underlying price of an asset ie: if we’re bullish or bearish we can buy a call or put respectively. Things get interesting when we move beyond simply trading the direction of where BTC or ETH is going...
3. Unlike futures, with options we can make bets on the underlying volatility of an asset. This style of trading is commonly referred to as “vol trading” which is a slightly more advanced strategy used by sophisticated retail traders and institutions such as @ledger_prime.
Read 24 tweets
26 Dec 20
1. Huge thanks to the devs at @RealHxro for helping me pull data for TIX contracts - really grateful for the responsive team! This is one of the first times I've been able to build out relatively liquid vol curves not only for BTC/ETH but also for alts such as LINK, UNI, and YFI.
2. As a refresher, TIX contracts can be thought of as "cash-or-nothing" options. Here's a thread explaining the details of how these products work.
3. Pricing these options is fairly straightforward as it requires us to only look at the second term of the BSM model. In this case, N(d) represents the prob of option expiring ITM and multiplying by the payoff (K) gives us the EV of this bet. Math from @EGHaug's great book.
Read 17 tweets
19 Dec 20
1. The recent rise in BTC spot and implied volatility has led me to re-read @SinclairEuan's book, “Positional Options Trading”. I found the chapter on volatility positions quite interesting with some useful parallels for crypto vol markets.
2. If we're shorting IV, ideally we want a strike with the largest vol premium. Although deep OTM puts tend to have the highest IV, we need to sell a lot of these options b/c their vega is low. As a result, selling these teeny options in size based only on high IV is dangerous.
3. Another method is to “sell options with the greatest dollar premium over what the option would be worth if it were priced with ATM IV". This allows us to quantify how much of the premium in dollars we are collecting in terms of skew.
Read 10 tweets
12 Dec 20
1. To stay in the game all option market-makers must actively manage their greeks. One of the challenging tasks is aggregating the portfolio vega across different maturities. While we can aggregate the delta/gamma/theta fairly easily, vega is trickier to manage. Let’s see why…
2. Suppose we’re a market-maker trading on @tradeparadigm with a book of three options:

Option A: Maturity = 30 days
- Short 100 contracts
- Vega = 3

Option B: Maturity = 60 days
- Long 50 contracts
- Vega = 6

Option C: Maturity = 90 days
- Long 50 contracts
- Vega = 10
3. An initial (but likely incorrect) approach to aggregate the portfolio vega exposure would be:

- Option A: -100 x 3 = -300
- Option B: 50 x 6 = + 300
- Option C: 50 x 10 = + 500

Portfolio Vega = A + B + C = +500
Read 14 tweets

Did Thread Reader help you today?

Support us! We are indie developers!


This site is made by just two indie developers on a laptop doing marketing, support and development! Read more about the story.

Become a Premium Member ($3/month or $30/year) and get exclusive features!

Become Premium

Too expensive? Make a small donation by buying us coffee ($5) or help with server cost ($10)

Donate via Paypal Become our Patreon

Thank you for your support!

Follow Us on Twitter!