1/ WHERE COULD BE THE TOP OF THIS BULLRUN?
Before we begin our analysis, lets understand what's happening currently.
After hitting 42K, BTC has entered a HTF triangle with a 30% drawdown. This was the first major dip of this bullrun. Right now we've broken out $BTC #Bitcoin
Before we begin our analysis, lets understand what's happening currently.
After hitting 42K, BTC has entered a HTF triangle with a 30% drawdown. This was the first major dip of this bullrun. Right now we've broken out $BTC #Bitcoin

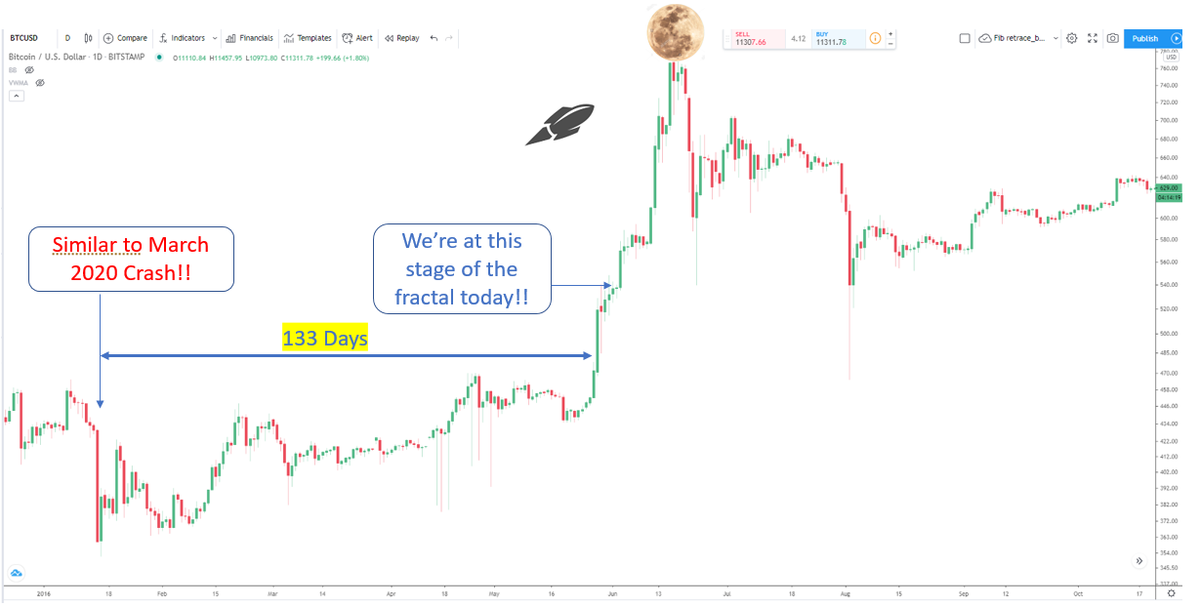
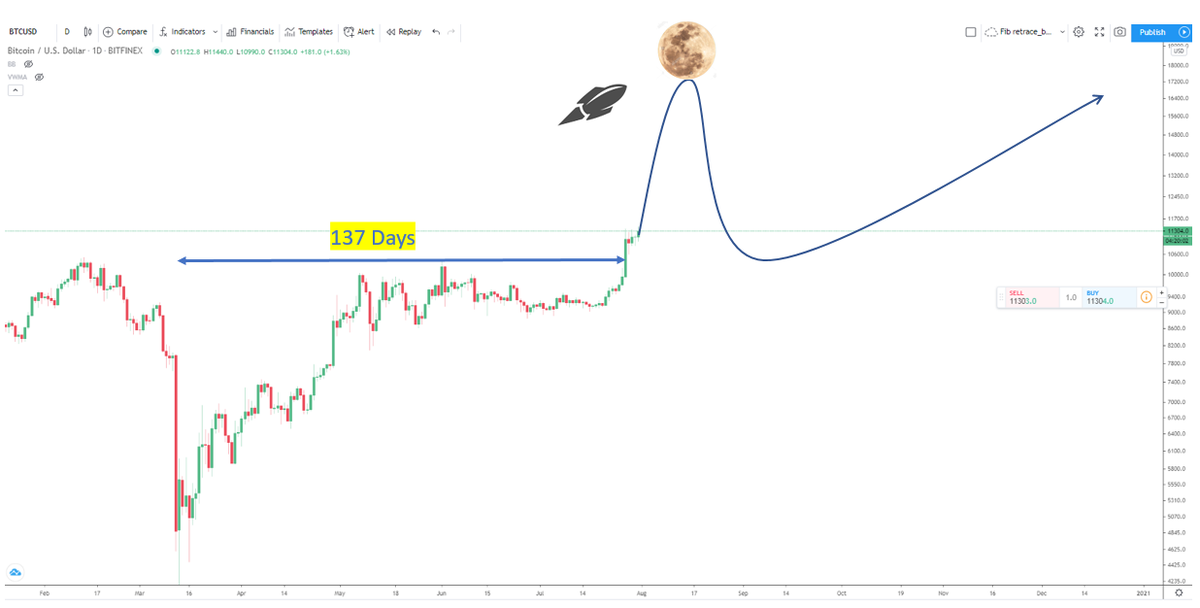
2/ of this triangle & price is steadily rising. So whats next?
In order to understand this, we'll compare the 2021 bullrun with 2017 & 2013
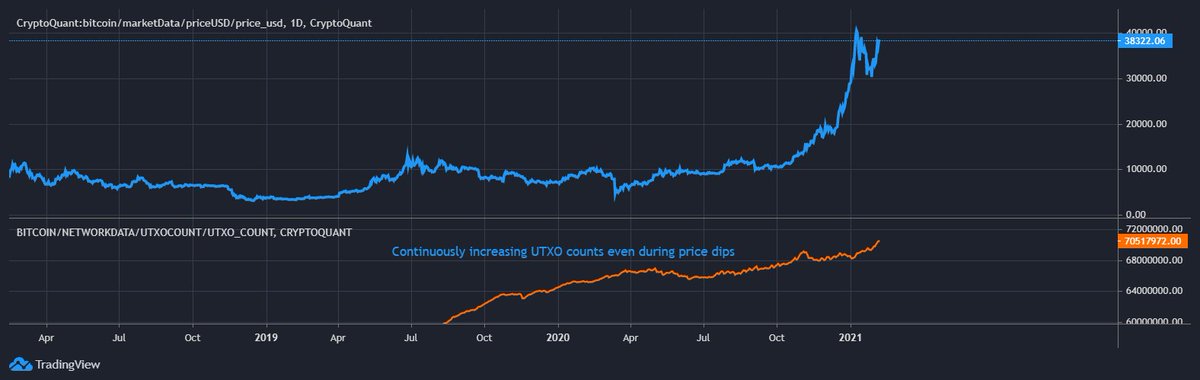
1st metric for comparison is : UTXO count. UTXO counts are one of the major determiners of HODLing behavior of investors. If UTXO counts
In order to understand this, we'll compare the 2021 bullrun with 2017 & 2013
1st metric for comparison is : UTXO count. UTXO counts are one of the major determiners of HODLing behavior of investors. If UTXO counts
3/ keep rising, it usually means people are HODLing rather than spending or selling their BTC. During a bullrun, UTXOs in general would rise but we can try to break it down further to check if anything peculiar is happening in 2021 which was similar to 2013 or 2017.
$BTC #BTC
$BTC #BTC
4/ UTXO trend of 2021 Bullrun
In 2021, UTXO has been constantly increasing, even during the price dips. During the recent dip from 42K (30% drawdown), UTXOs actually rose instead of falling, which means, investors are HODLing strong even when there is a dip in price
$BTC #BTC
In 2021, UTXO has been constantly increasing, even during the price dips. During the recent dip from 42K (30% drawdown), UTXOs actually rose instead of falling, which means, investors are HODLing strong even when there is a dip in price
$BTC #BTC
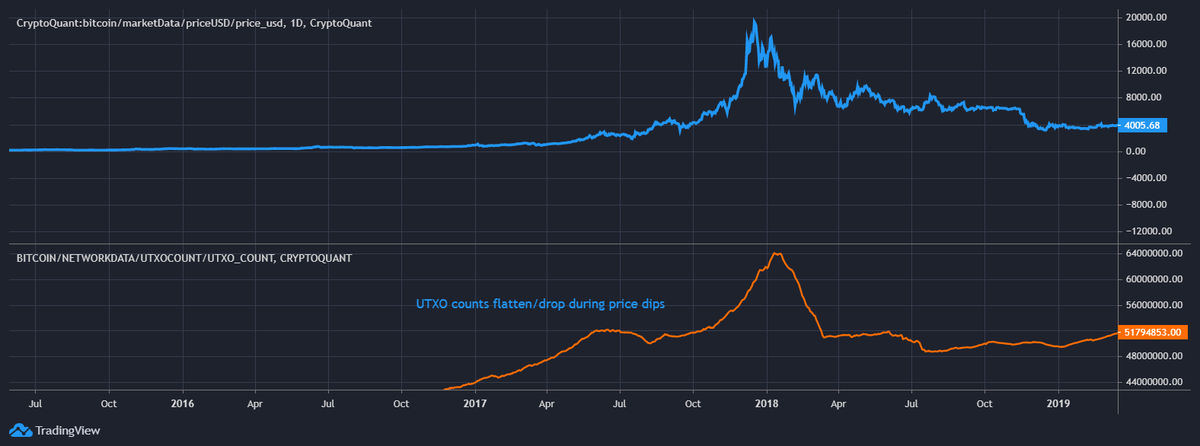
5/ UTXO trend of 2017 Bullrun
Now lets compare the UTXO trend during 2017 bullrun. In 2017, UTXOs were falling during price dips, meaning HODLing wasn’t as strong as in 2021. There were more weak hands and the investor confidence wasn’t as high as in 2021.
$BTC #BTC #Bitcoin
Now lets compare the UTXO trend during 2017 bullrun. In 2017, UTXOs were falling during price dips, meaning HODLing wasn’t as strong as in 2021. There were more weak hands and the investor confidence wasn’t as high as in 2021.
$BTC #BTC #Bitcoin
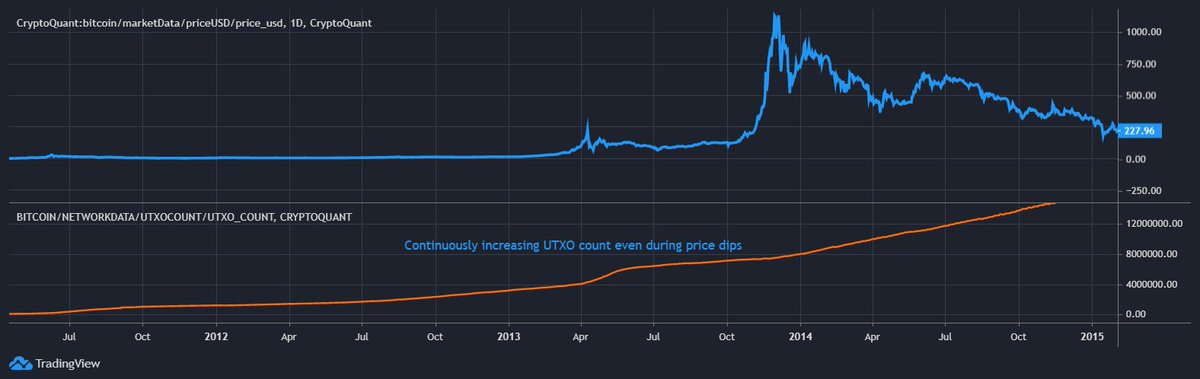
6/ UTXO trend of 2013 Bullrun
During the 2013 bullrun, UTXOs showed similar trend to what is happening now in 2021. Even during major price dips, UTXOs kept on increasing, thus signaling more strong hands in 2013 & 2021 than in 2017.
During the 2013 bullrun, UTXOs showed similar trend to what is happening now in 2021. Even during major price dips, UTXOs kept on increasing, thus signaling more strong hands in 2013 & 2021 than in 2017.
7/ Since HODLing behaviour is one of the major characteristics of a bullrun, it would be safe to assume that 2021 is more closely following 2013 bullrun rather than 2017.
$BTC #BTC #Bitcoin #2021Megabullrun
$BTC #BTC #Bitcoin #2021Megabullrun
8/ Now, lets use another metric for comparison: MVRV ratio
This ratio is one of the widely used metric to value the network and is a good proxy to understand the investor behavior.
Lets try to compare the MVRV ratios of 2013 and 2021.
$BTC #BTC #bitcoin
This ratio is one of the widely used metric to value the network and is a good proxy to understand the investor behavior.
Lets try to compare the MVRV ratios of 2013 and 2021.
$BTC #BTC #bitcoin
9/ Below are the 2013 & 2021 charts with MVRV comparison
2013 Bullrun began around 14th Feb’2012 when price dipped to 4$. MVRV ratio back then was 0.8. 2021 bullrun began around 10th March’2020, with a dip to 4K$. The MVRV ratio was 0.7, very close to that in 2013
#BTC #Bitcoin
2013 Bullrun began around 14th Feb’2012 when price dipped to 4$. MVRV ratio back then was 0.8. 2021 bullrun began around 10th March’2020, with a dip to 4K$. The MVRV ratio was 0.7, very close to that in 2013
#BTC #Bitcoin
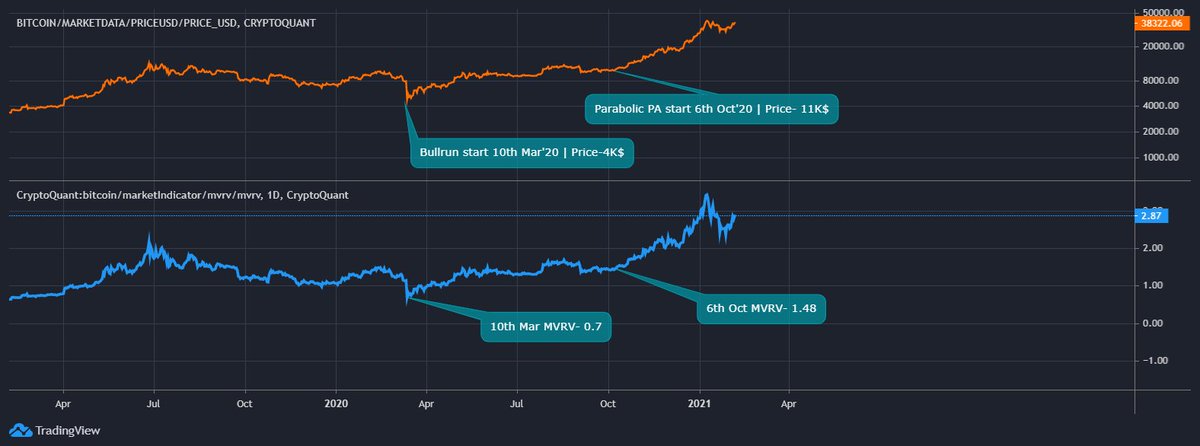
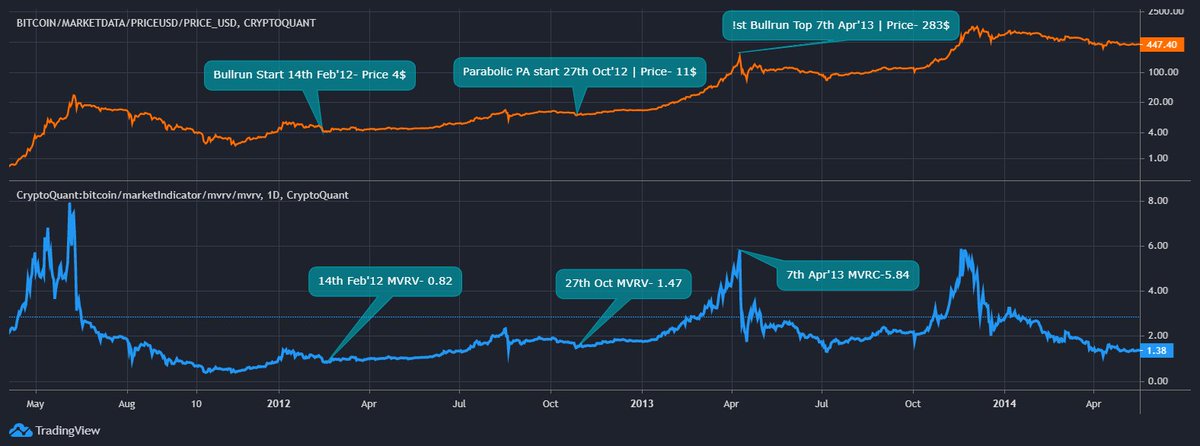
10/ 2013 parabolic run started around 27th October’2013. Price was 11$ and MVRV ratio was 1.47. 2021 parabolic run started around 6th Oct’ 2020. Price was 11K$ & MVRV was 1.48. Do you see the pattern now?
2021 bullrun has been strikingly similar to 2013 in both UTXOs & MVRV trend
2021 bullrun has been strikingly similar to 2013 in both UTXOs & MVRV trend
11/ Also, the prices in 2021 is a close factor of 1000 when compared to 2013.
So what does this mean for 2021 price peak?
Lets try to understand that by superimposing the price action chart of 2013 on the one for 2021.
So what does this mean for 2021 price peak?
Lets try to understand that by superimposing the price action chart of 2013 on the one for 2021.
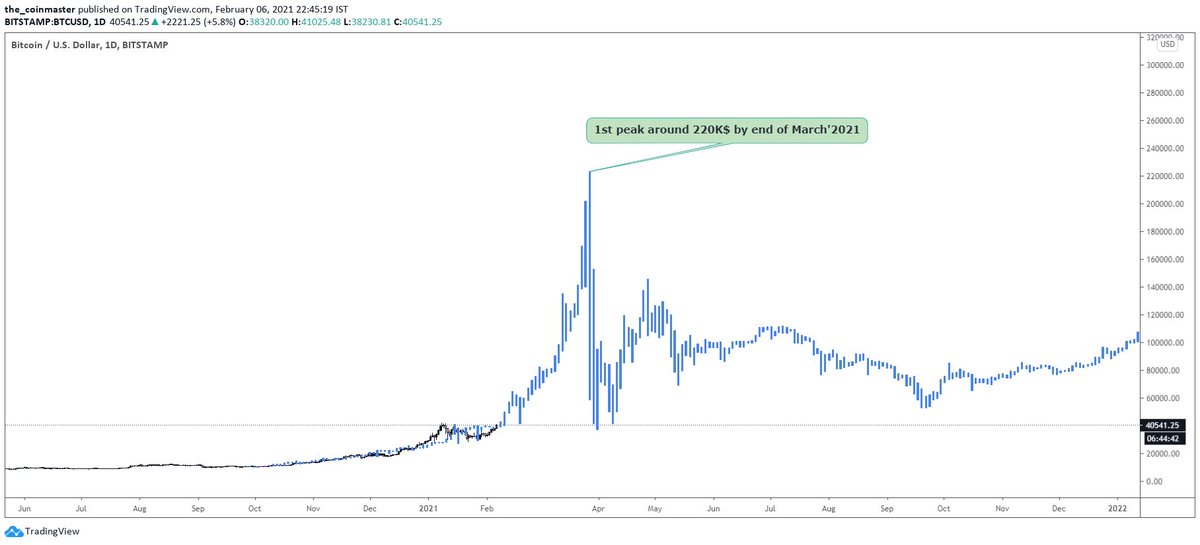
12/ As per the above chart, the top of the 2021 bullrun is around 220K$. While we need to closely track if price actually follows this trend, but if it follows to a fair extent we might top around April to May timeframe.
But is this the final top of this run?
$BTC #BTC #Bitcoin
But is this the final top of this run?
$BTC #BTC #Bitcoin
13/ One more thing to note in the 2013 run was that there was a double top. One in April and another in December. So when could we expect the second and the final top of this bullrun?
14/ If we stretch the projection of the 2013 price action on 2021 bullrun, we get the below chart. The first top at 220k$ in March’2021 and the second one at around 1million $ in July’2022. There will be a long period of consolidation in between.
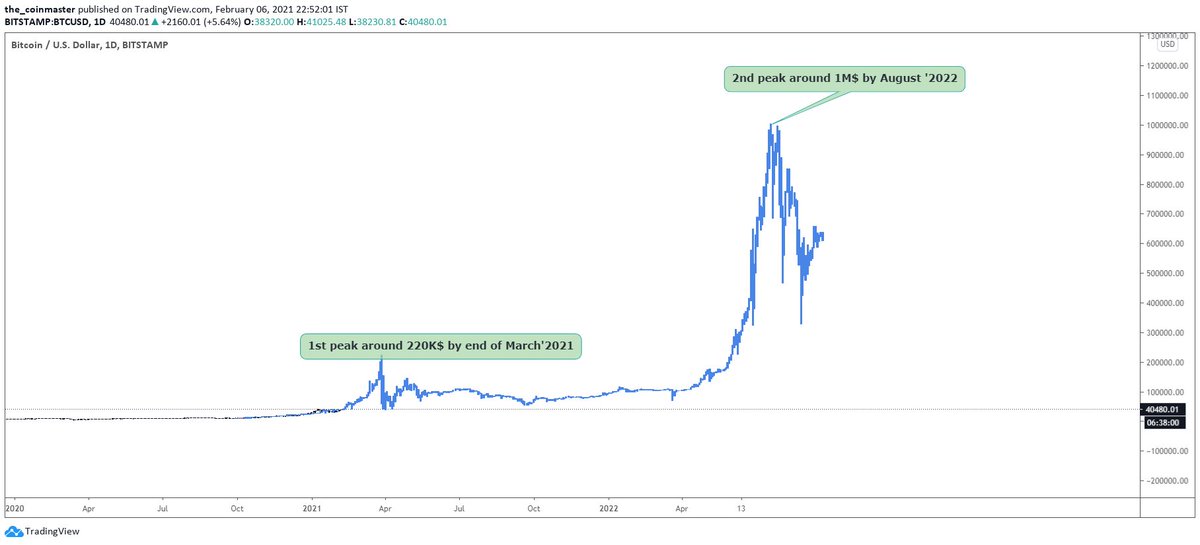
15/ While it is too early to predict the second top and timelines, the above analysis helps in making an educated guess of the top of this run.
While a million dollar BTC by Jul'22 seems like a wild idea, the growing interest among institutions to use $BTC as a reserve asset
While a million dollar BTC by Jul'22 seems like a wild idea, the growing interest among institutions to use $BTC as a reserve asset
16/ to fetch higher yields might just be the rocket fuel needed to get us there.
For more detailed explanation, please read the full post on my Substack & subscribe to receive weekly updates.
coinmaster.substack.com/p/bitcoin-wher…
$BTC #BTC #Bitcoin #2021Megabullrun
For more detailed explanation, please read the full post on my Substack & subscribe to receive weekly updates.
coinmaster.substack.com/p/bitcoin-wher…
$BTC #BTC #Bitcoin #2021Megabullrun
• • •
Missing some Tweet in this thread? You can try to
force a refresh