This week's @PHE_uk COVID surveillance report is now out. Covers 1-7 Feb.
It's going in the right direction but still pockets of high case rates & hospitals are still far from getting back to anything like 'normal'.
Pls keep going, it's getting better.🧵
gov.uk/government/sta…
It's going in the right direction but still pockets of high case rates & hospitals are still far from getting back to anything like 'normal'.
Pls keep going, it's getting better.🧵
gov.uk/government/sta…

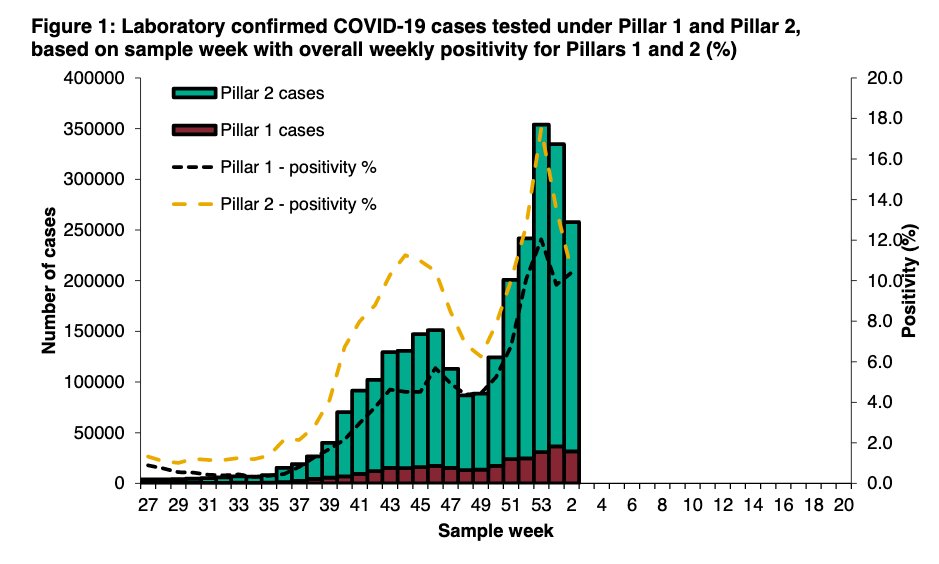
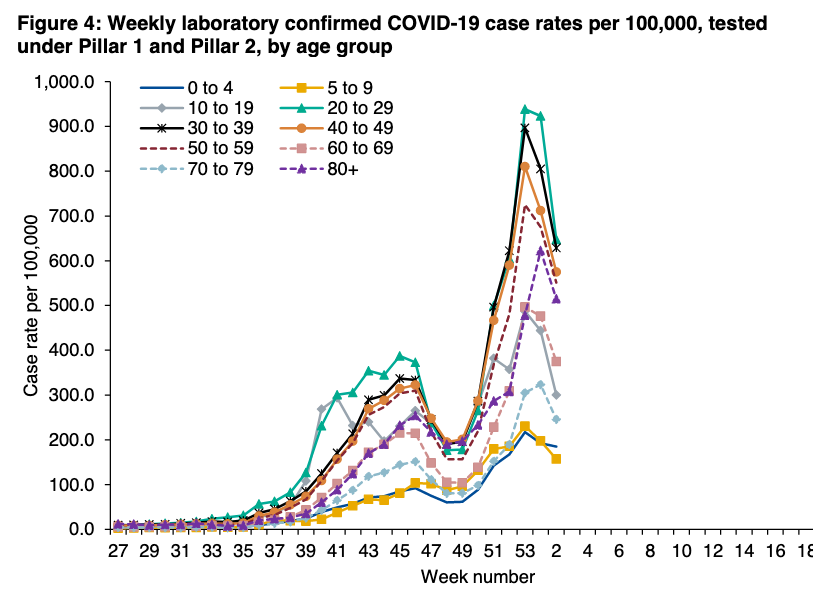
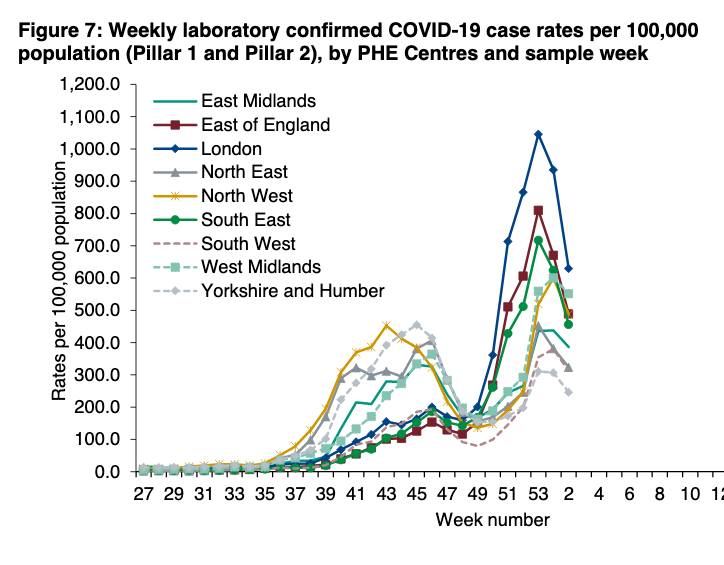
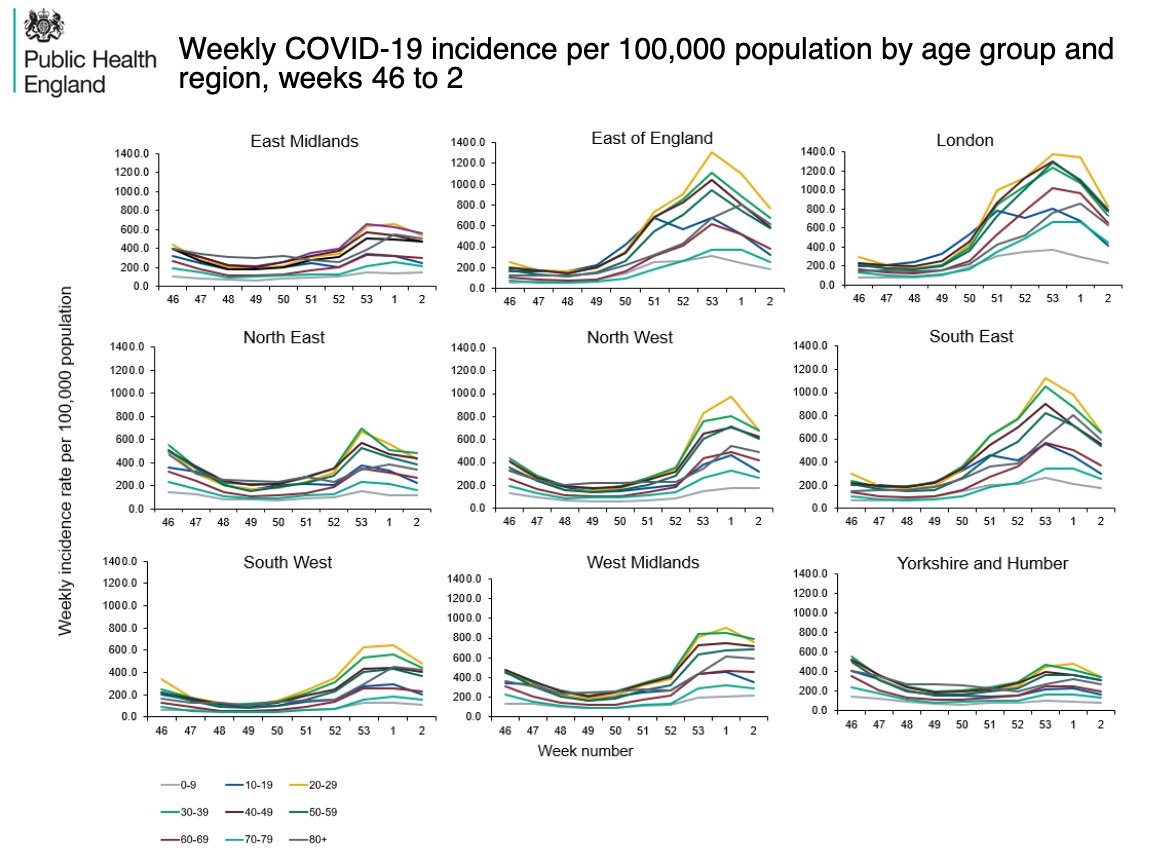
Case rates and positivity rates (percentage of tests coming back positive) continue to decline in all ages and everywhere.
The steep decline in 20-49yr olds is really striking.
The steep decline in 20-49yr olds is really striking.


The figures of age by region show how in some regions, the decline by age isn't so prominent.
For example, 80+ in NE and West Mids.
For example, 80+ in NE and West Mids.

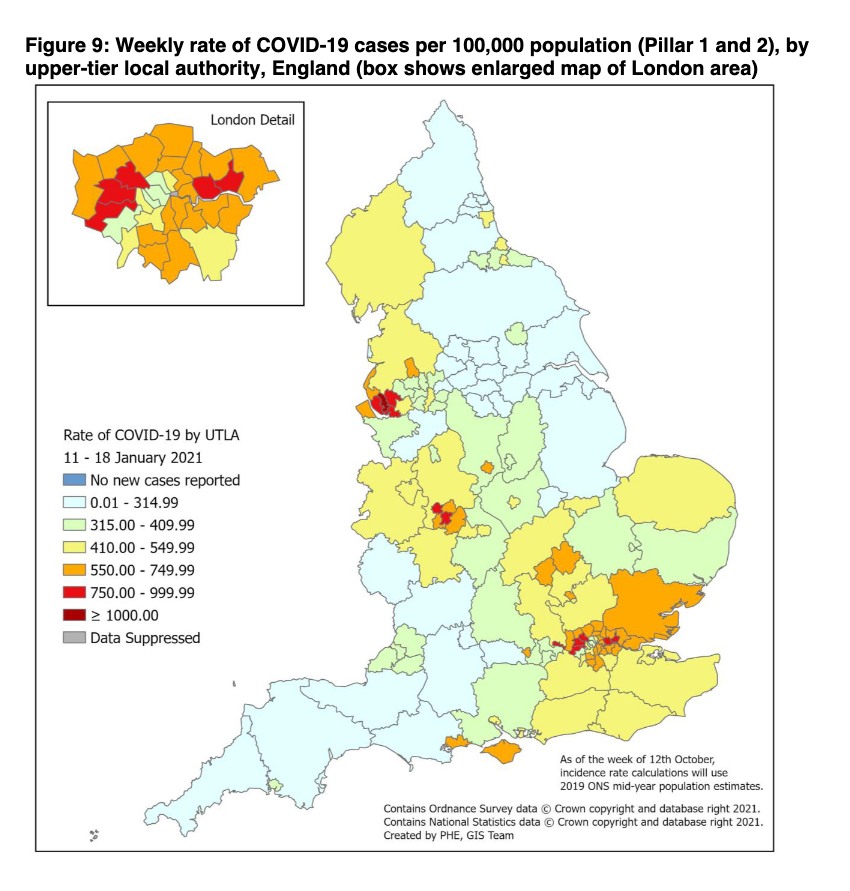
Still some local authorities with persistently high case rates despite lockdown.
More genomic testing may become useful to see if there's anything going on with different variants.
More genomic testing may become useful to see if there's anything going on with different variants.

Really helpful new graph separating PCR & LFD (rapid lateral flow devices used for people without symptoms) tests.
PCR positivity and use going down, number of people using LFD going up quickly (and will continue to rise).
Thanks @statsgeekclare and colleagues if this is you!
PCR positivity and use going down, number of people using LFD going up quickly (and will continue to rise).
Thanks @statsgeekclare and colleagues if this is you!

Overall picture of differences by ethnicity masks significant differences at the regional level.


And differences by deprivation group persist as case rates fall.

Great to see continued decline in numbers of COVID incidents/outbreaks in care homes reported to PHE health protection teams.

Number of outbreaks in educational settings has stayed the same, however (although note different scale compared with care home outbreak numbers).

Big drop in hospital outbreaks. Just 28 linked to a known case of COVID in a wk across the country is remarkable.
Well done NHS infection control teams plus staff doing the necessary infection control processes. PPE & cleaning work, + regular testing is also likely contributing
Well done NHS infection control teams plus staff doing the necessary infection control processes. PPE & cleaning work, + regular testing is also likely contributing

And finally, a welcome drop in outbreaks in workplace settings.

Hospital admission rates have now clearly peaked in all regions and ages (although still not back to admission rates seen during Nov peak)


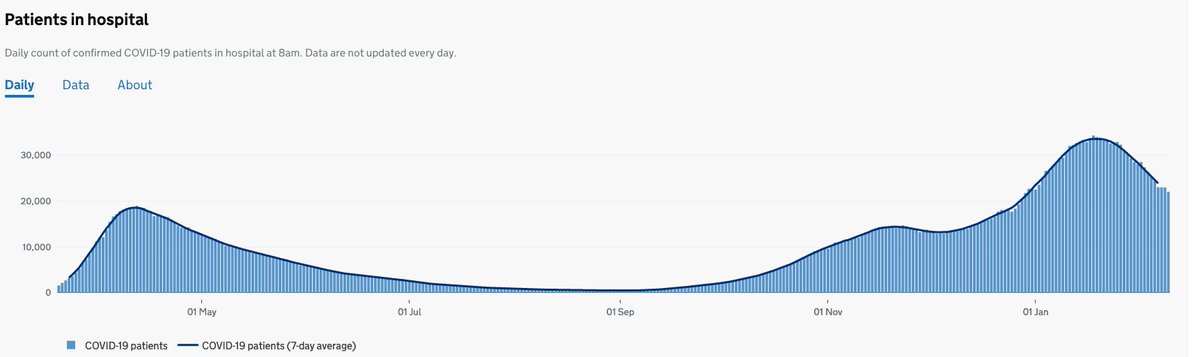
And this is now translating into meaningful falls in the number or people in hospital, but note there are *still* more people in hospital with COVID than the first wave peak.
ICU admissions have also peaked in all regions & ages (although still looking high in EoE & not falling as fast as elsewhere).
There will still be repatriation of ICU pts as well as moving of people to ICU from wards so admission rates and occupancy will fall slowly.
There will still be repatriation of ICU pts as well as moving of people to ICU from wards so admission rates and occupancy will fall slowly.


And whilst deaths have peaked, excess mortality remains really high.


So in summary, things are going in the right direction, but still pockets of high case rates, excess mortality remains upsettingly high, and there's still some way to go before hospitals are back to anything close to normal.
And huge numbers of people are getting vaccinated.
And huge numbers of people are getting vaccinated.

The *vast* majority of people are trying to do the right thing.
As ever - please do ask for help if you need it whilst in lockdown or isolating. Friends, family, neighbours, local government community teams (on your local gov website), and charities.
As ever - please do ask for help if you need it whilst in lockdown or isolating. Friends, family, neighbours, local government community teams (on your local gov website), and charities.
PHE surveil rpt @felly500 @deb_cohen @martinmckee @carolecadwalla @mgtmccartney @ADPHUK @Jeanelleuk
@fascinatorfun @profchrisham @petermbenglish @HPIAndyCowper @Davewwest @HSJEditor @KateAlvanley
@IndependentSage @nedwards_1 @SamanthaJonesUK @ewanbirney @FurberA @Dr_D_Robertson
@fascinatorfun @profchrisham @petermbenglish @HPIAndyCowper @Davewwest @HSJEditor @KateAlvanley
@IndependentSage @nedwards_1 @SamanthaJonesUK @ewanbirney @FurberA @Dr_D_Robertson
T&T thread will be late this week, but will try and get to it by the end of the weekend.
• • •
Missing some Tweet in this thread? You can try to
force a refresh