I have updated my Tesla forecast and charts. 🤓
For those who don't want to read the whole 69-tweet thread:
slides 1-3 summarize the headline numbers & metrics
slides 4-20 are a bunch of pretty $TSLA charts (don't miss them!)
slides 21-69 are my detailed forecast model
1 of 69
For those who don't want to read the whole 69-tweet thread:
slides 1-3 summarize the headline numbers & metrics
slides 4-20 are a bunch of pretty $TSLA charts (don't miss them!)
slides 21-69 are my detailed forecast model
1 of 69
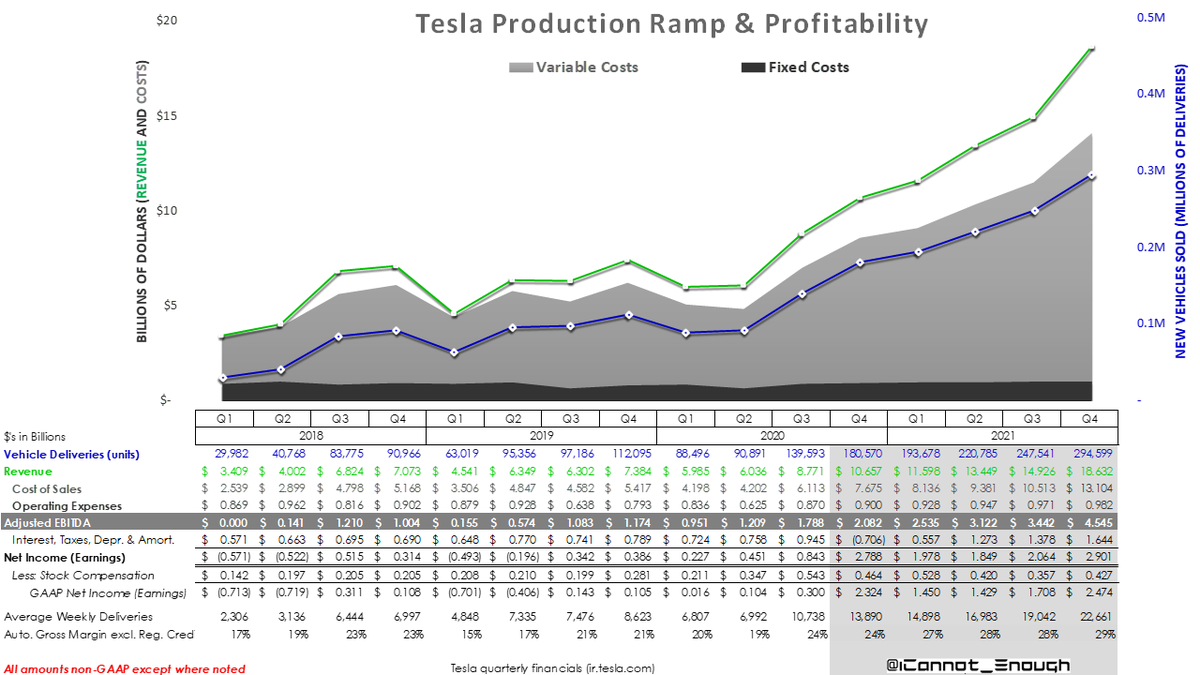
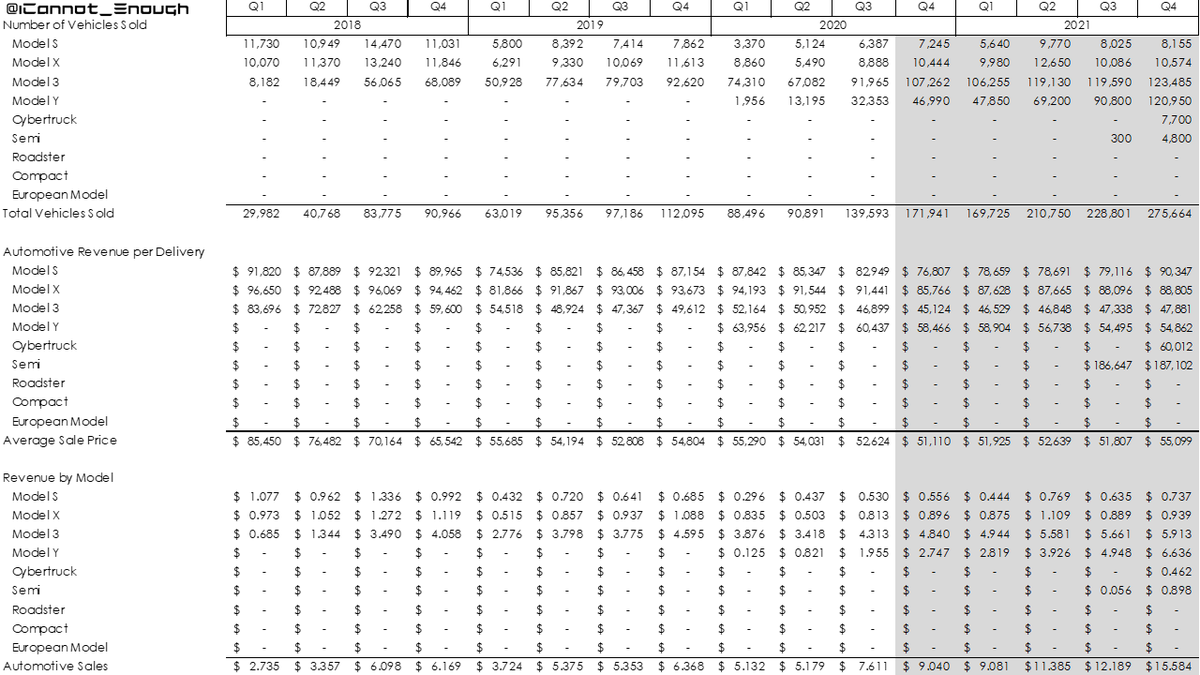
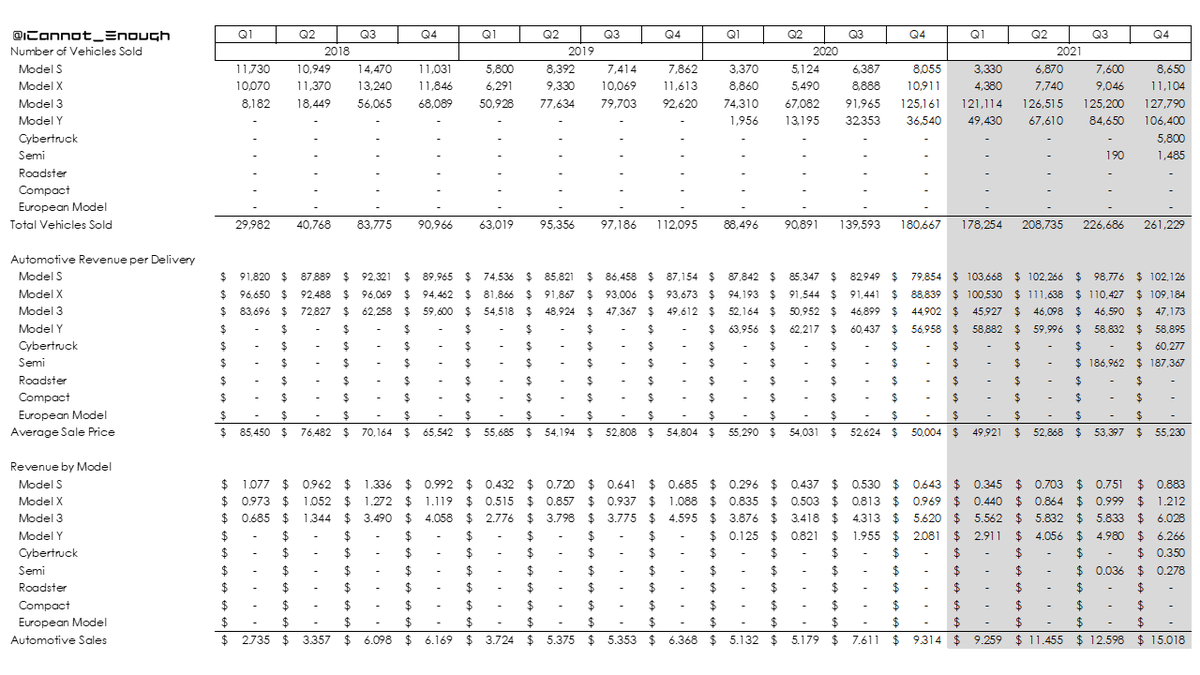
I'm forecasting 178,254 deliveries in Q1 and almost 875K deliveries for 2021. That's 75% deliveries growth YOY.
Model S Plaid deliveries will be low in Q1, but ASP will be high. Most of 2021's growth will be Model Y.
I don't expect many Semi or Cybertruck deliveries.
2 of 69
Model S Plaid deliveries will be low in Q1, but ASP will be high. Most of 2021's growth will be Model Y.
I don't expect many Semi or Cybertruck deliveries.
2 of 69
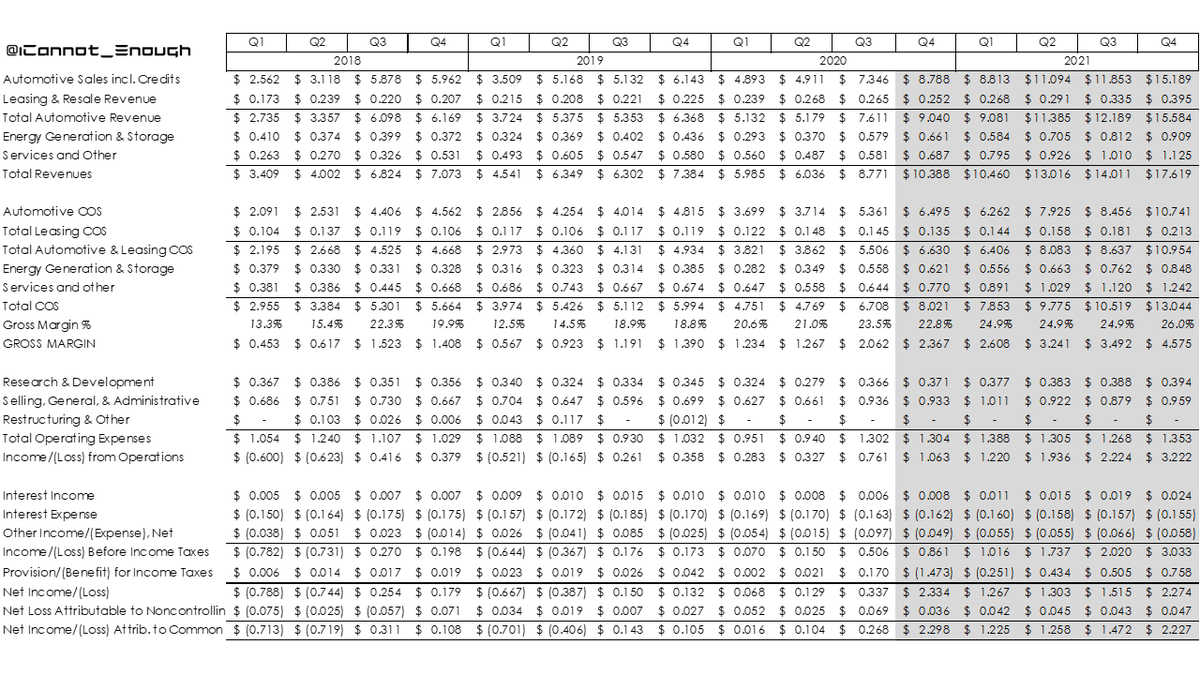
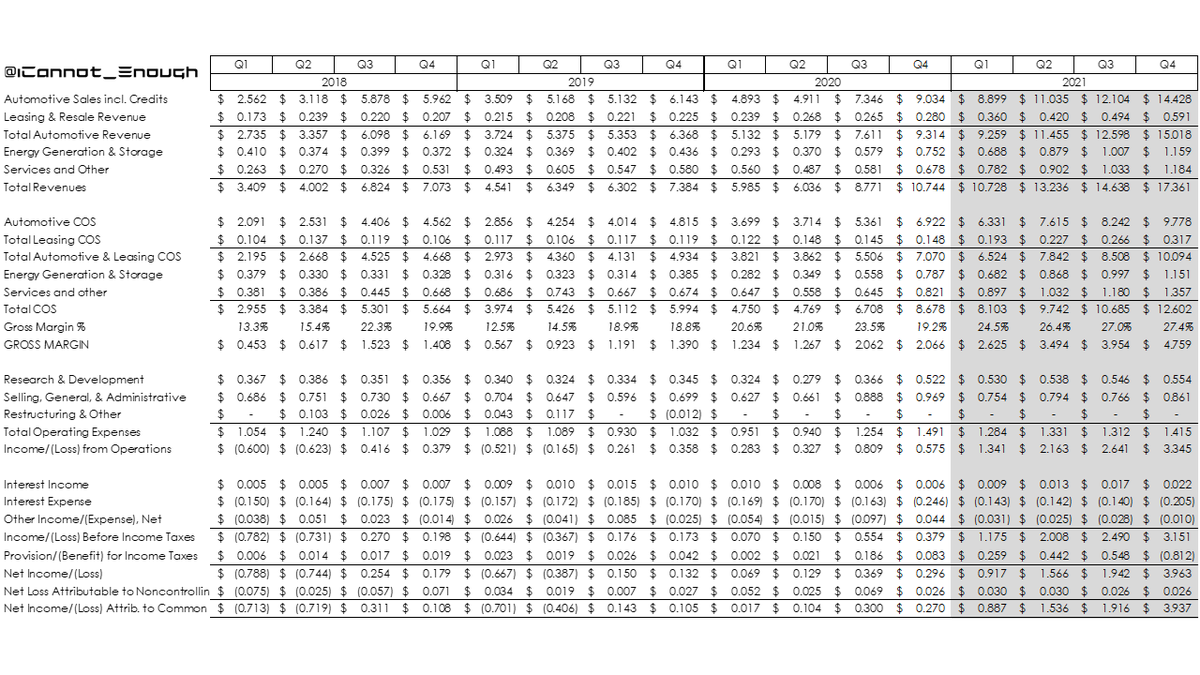
Plaid S & X, growing Model Y sales mix, and increasing sales of FSD should improve total Automotive gross margin and thus profitability.
I have pushed the deferred tax asset to Q4 but have low confidence that's when it will occur. I just have to forecast it somewhere.
3 of 69
I have pushed the deferred tax asset to Q4 but have low confidence that's when it will occur. I just have to forecast it somewhere.
3 of 69
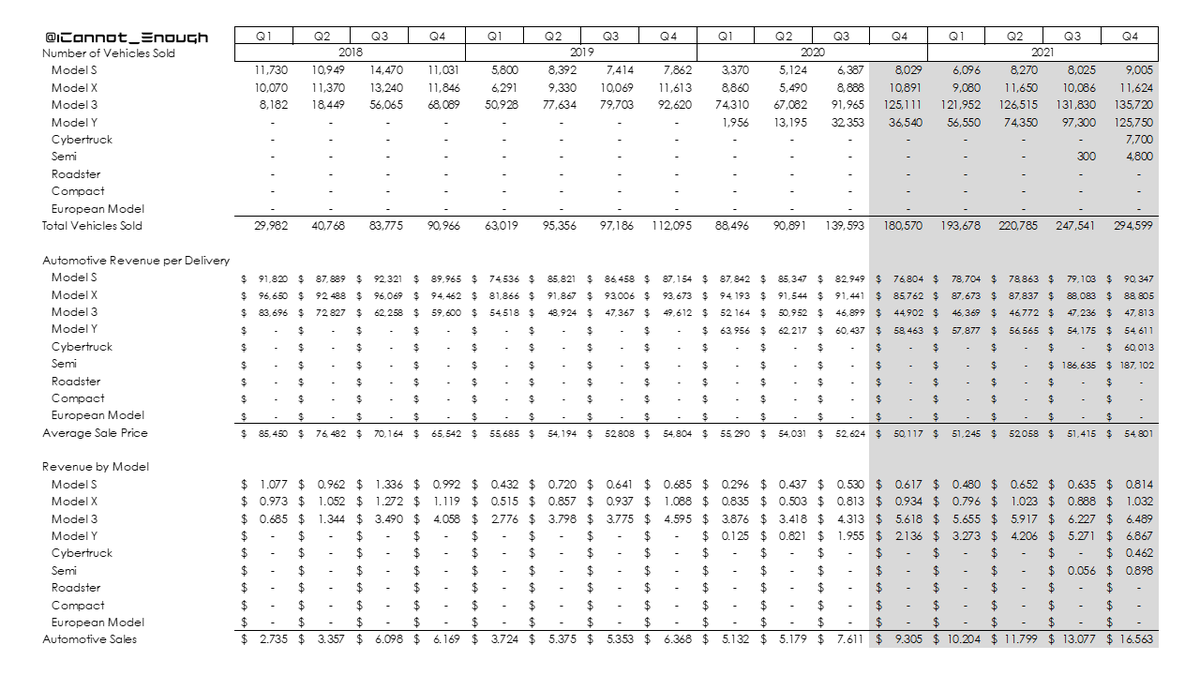
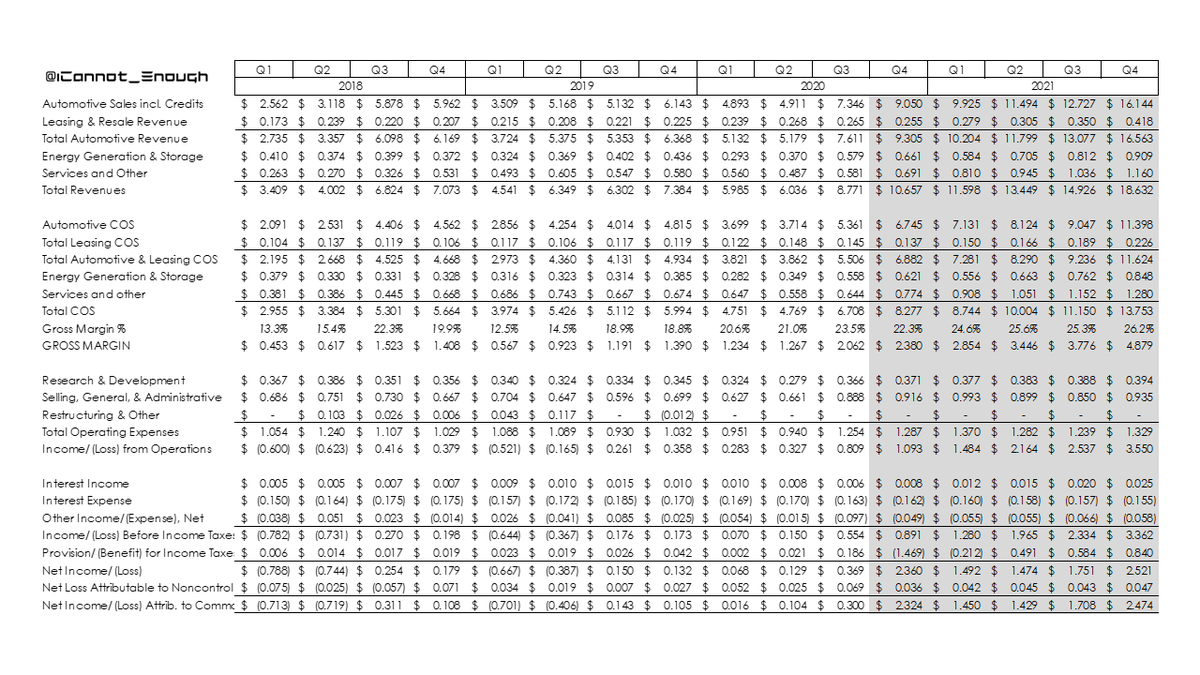
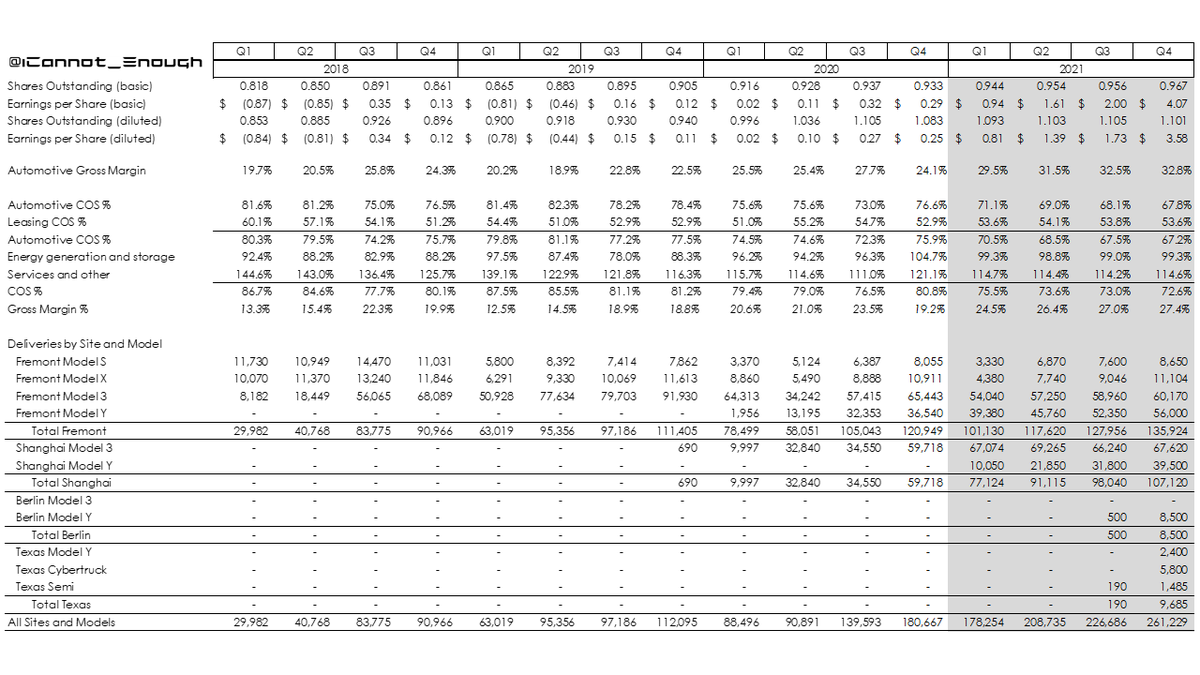
Here are some tables showing share count, earnings (mind the GAAP), Cost of Sales % detail, and deliveries by site, model, & quarter.
4 of 69
4 of 69
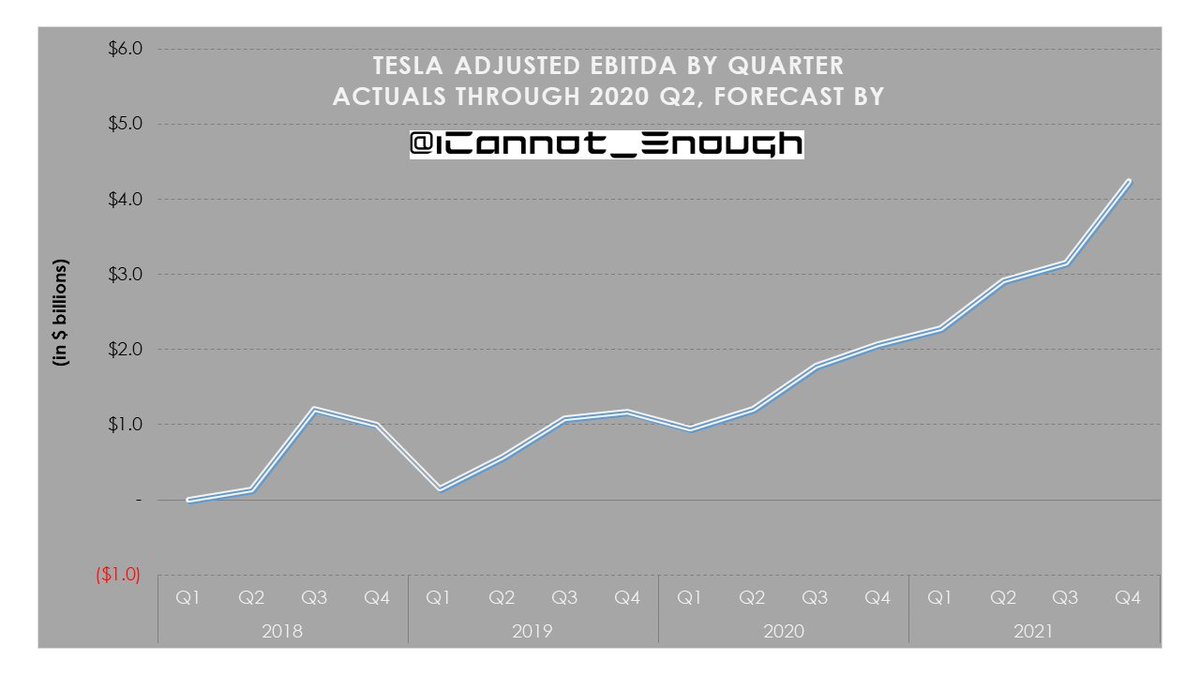
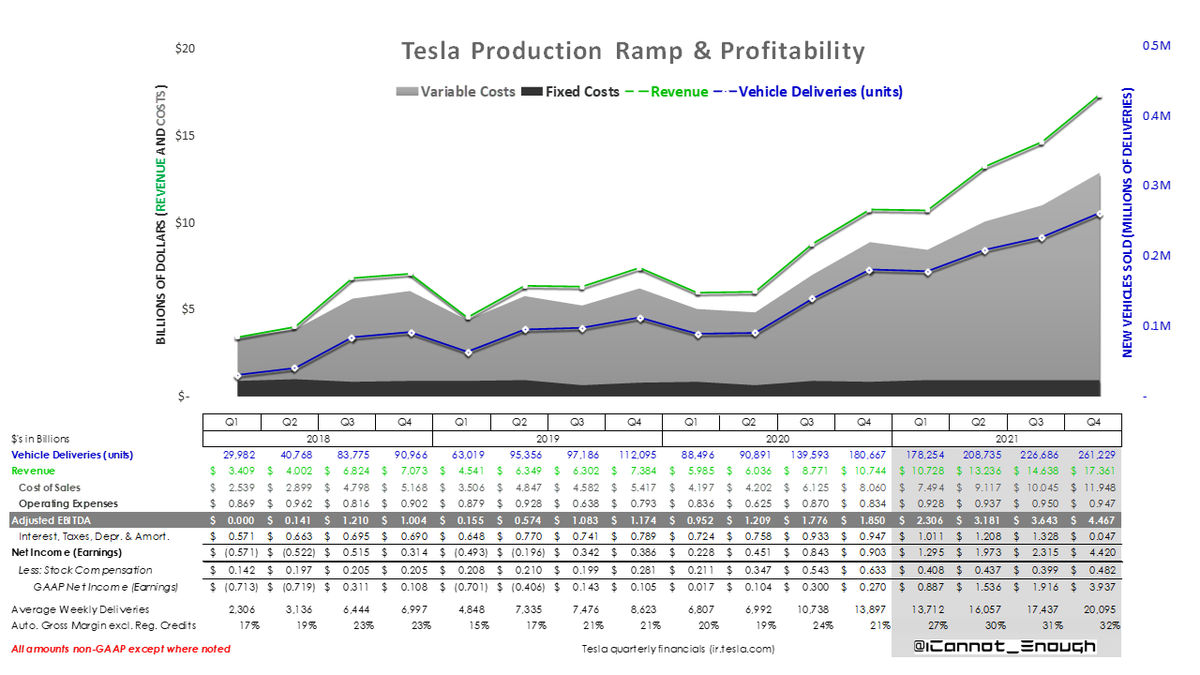
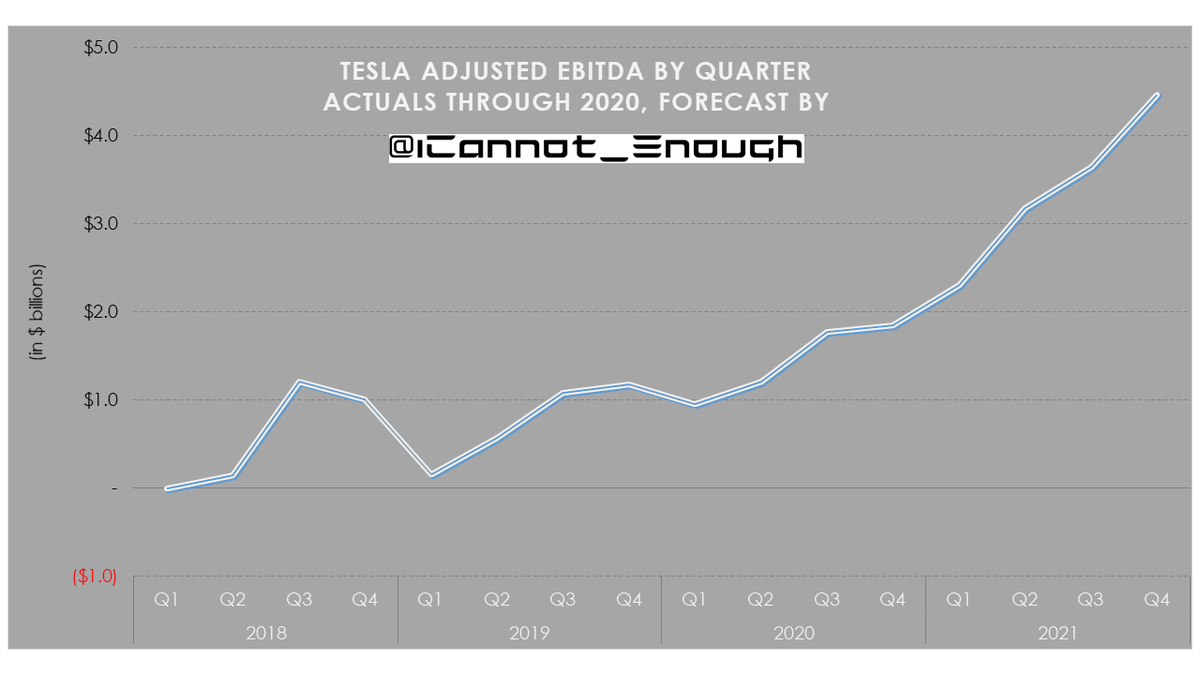
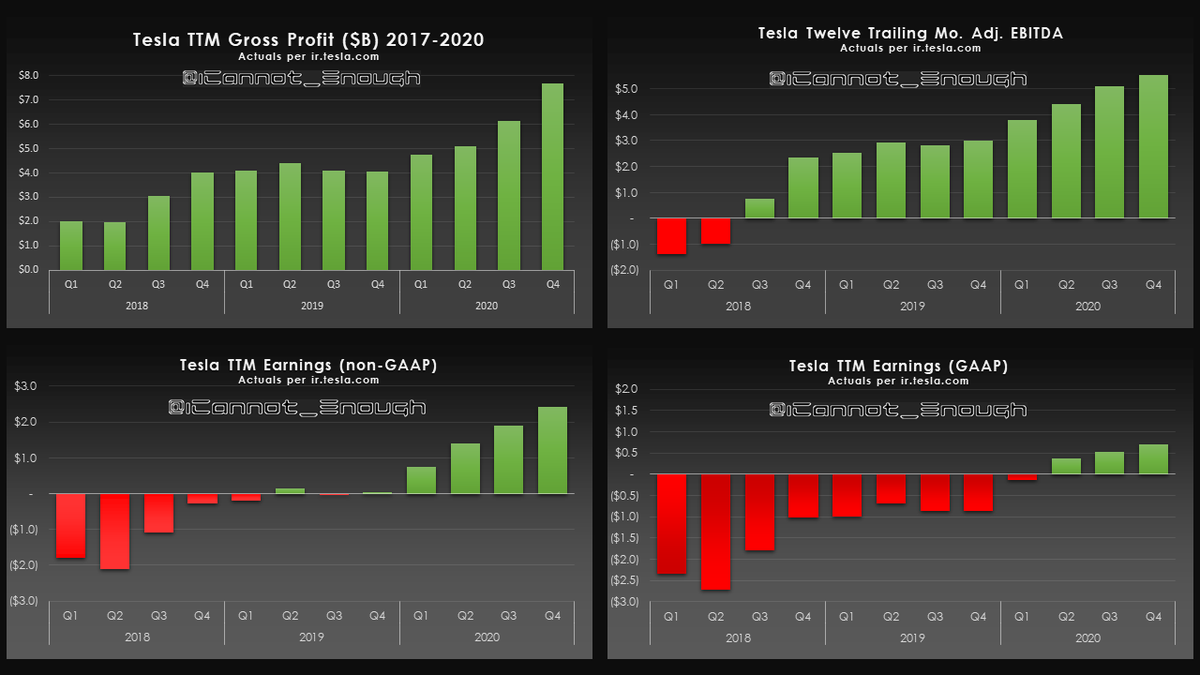
Quarterly Adjusted EBITDA is the profitability metric used to determine milestone achievement in Elon's compensation plan.
5 of 69
5 of 69
Here's a S3XY chart.
6 of 69
6 of 69
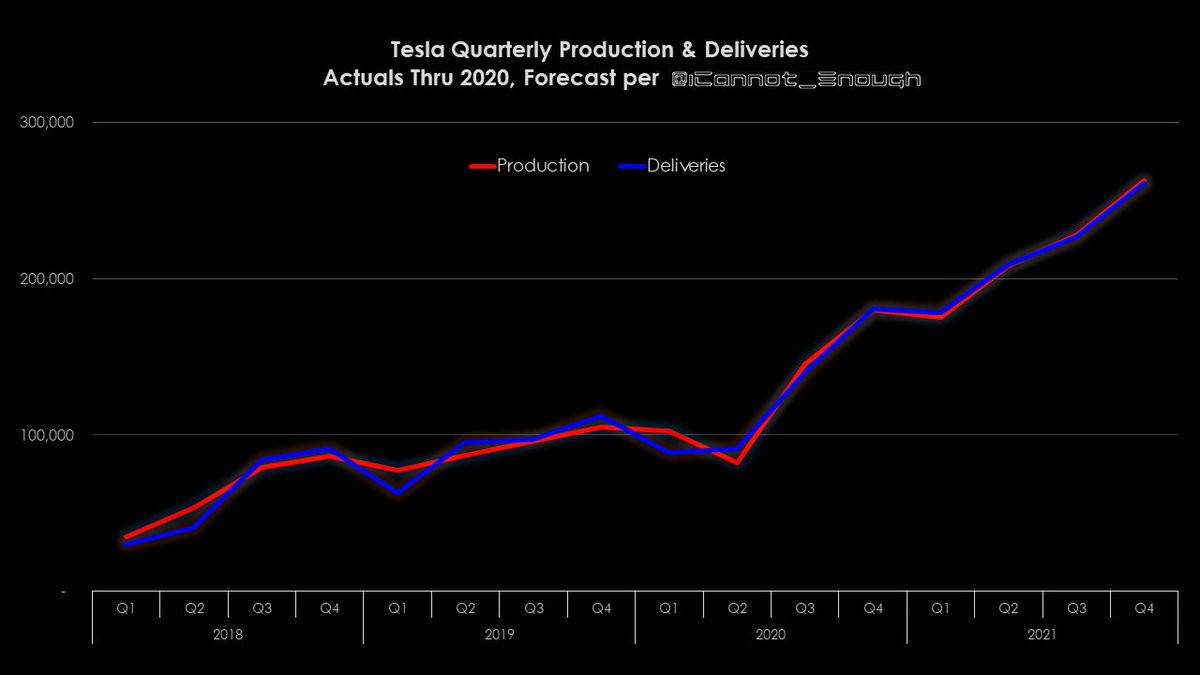
Here's a chart showing the quarterly trend over time in Production vs. Deliveries, including my 2021 forecast.
7 of 69
7 of 69
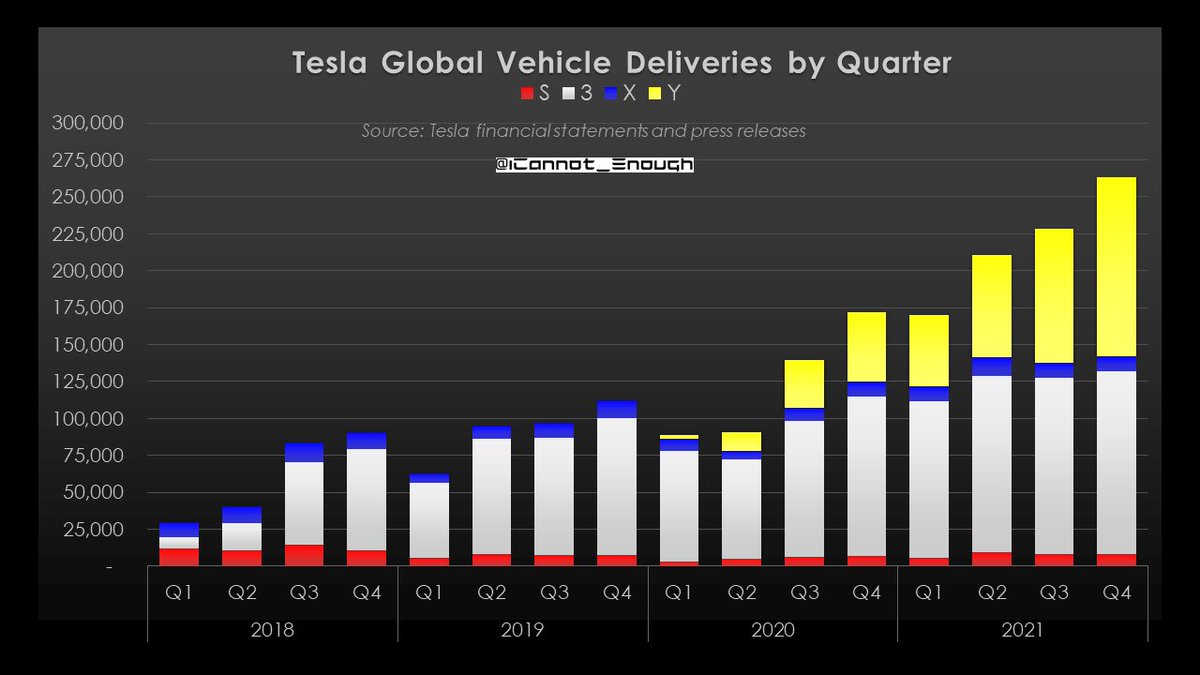
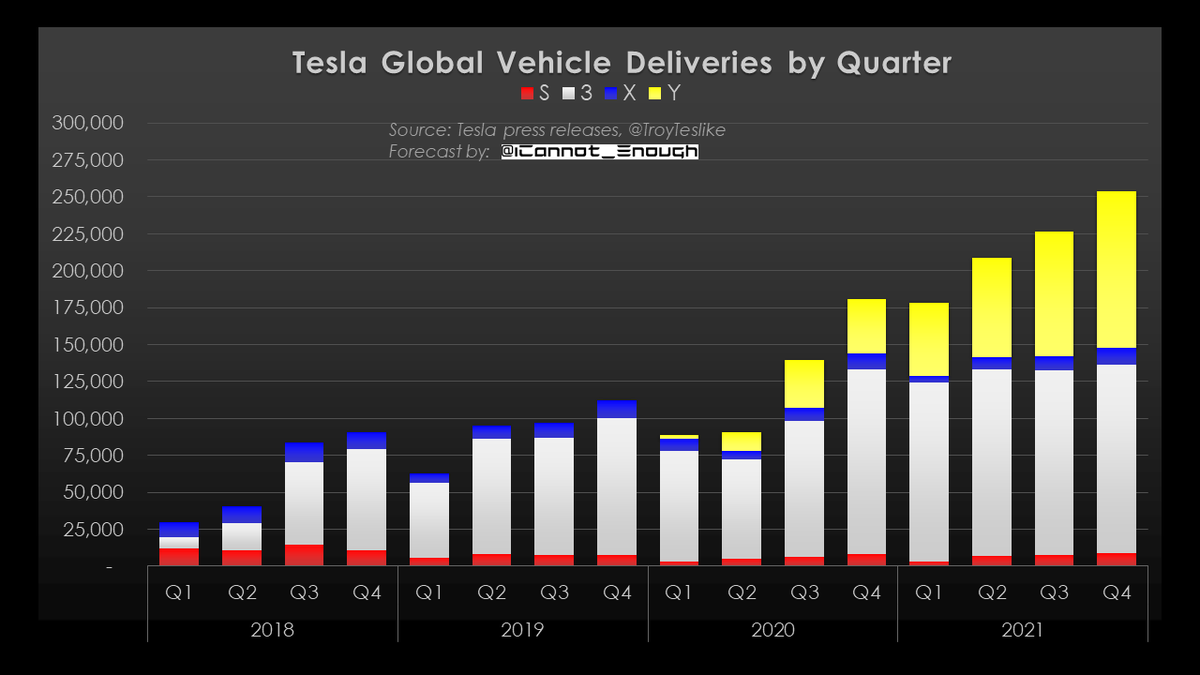
Here's a chart showing global deliveries of Tesla's 2 top-selling vehicles (2 of the Top 3 selling premium vehicles in the U.S.).
I'm expecting Model 3 sales to remain fairly steady while Model Y volume grows significantly throughout 2021.
8 of 69
I'm expecting Model 3 sales to remain fairly steady while Model Y volume grows significantly throughout 2021.
8 of 69

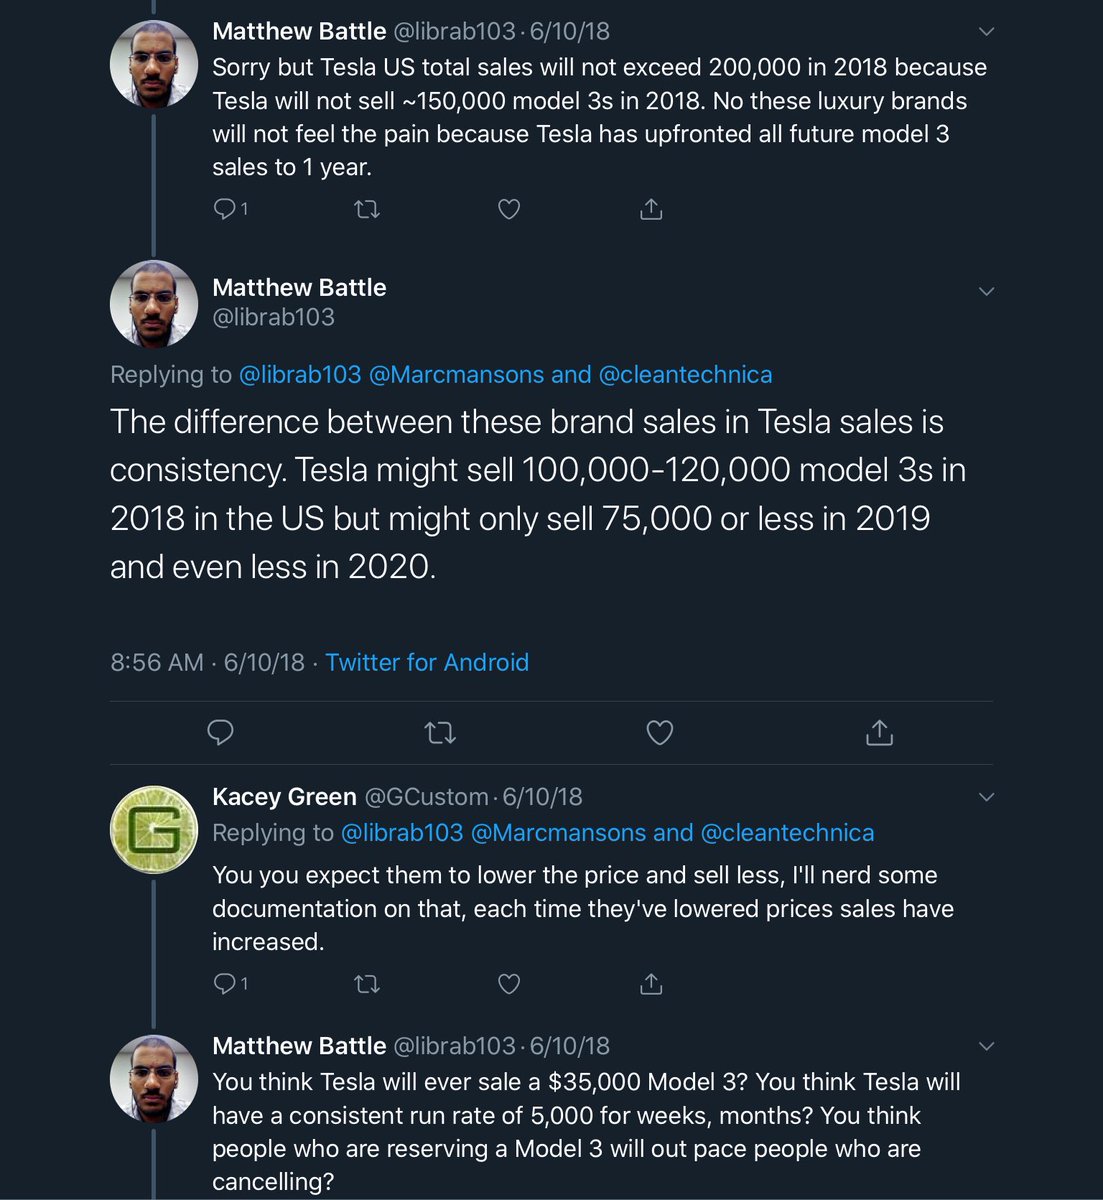
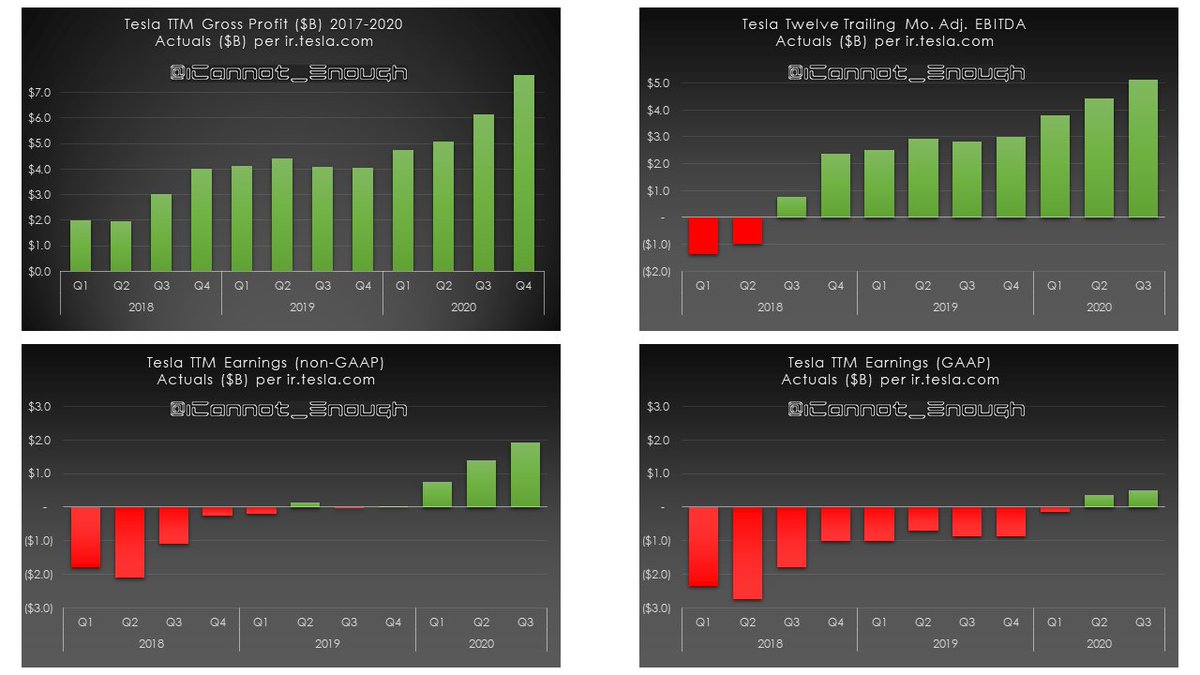
Here's a few charts you can show your anti-Tesla uncle or whichever idiot next utters "the growth story is over" or "one-time items" or "demand cliff" or "fwaud" or whatever the TSLAQ short sellers' playbook says this month. 😂🤣
9 of 69
9 of 69
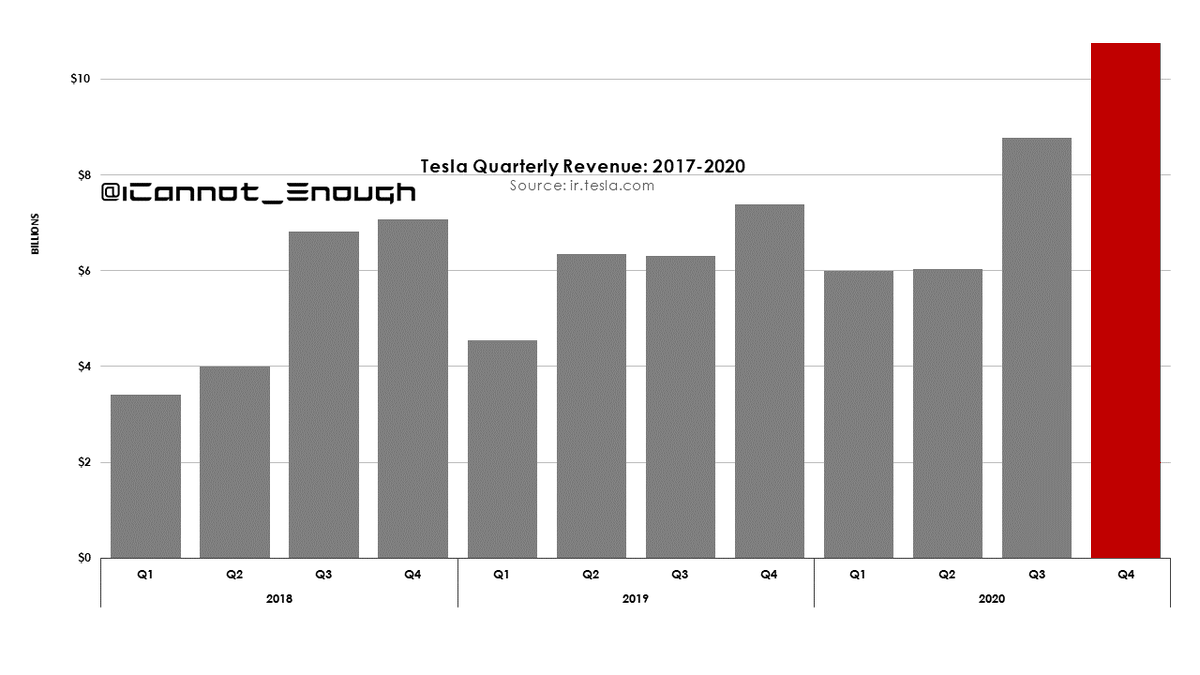
Last summer (after Fremont was closed for half a quarter due to Covid), @Teslacharts tweeted this chart out to trick people into thinking Tesla's revenue wasn't growing.
Here's what it would look like if he updated it.
Of course he won't, so I've updated it for him.
10 of 69
Here's what it would look like if he updated it.
Of course he won't, so I've updated it for him.
10 of 69
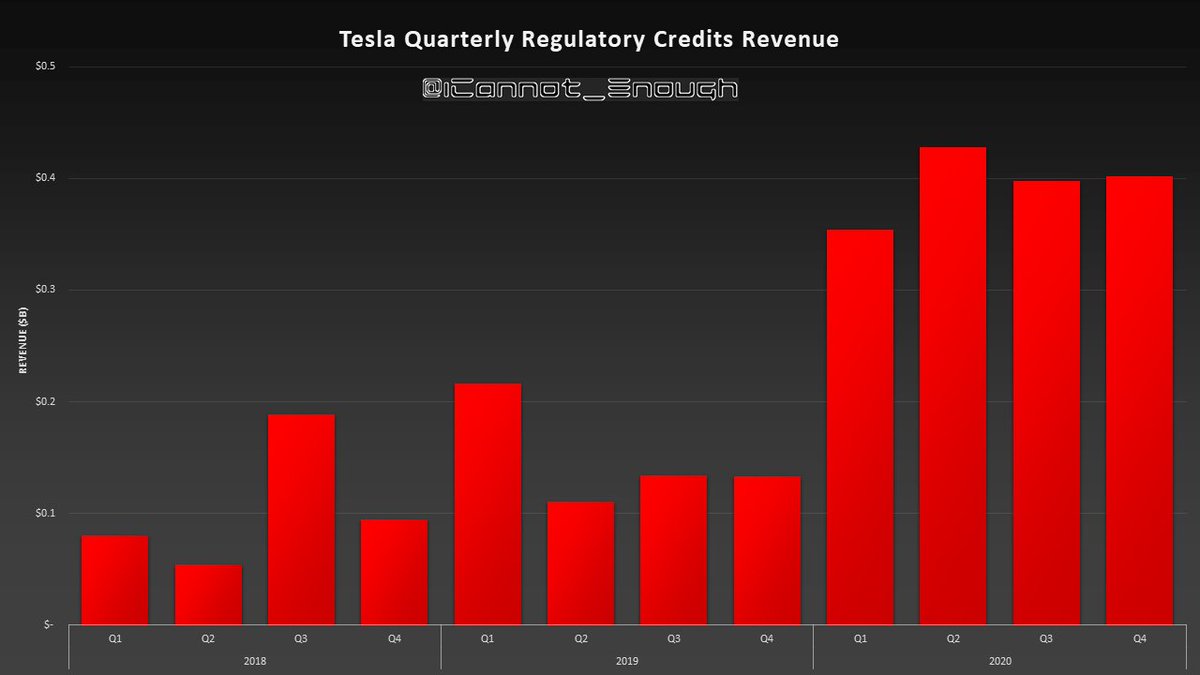
For years now, Gordon Johnson and many other Tesla haters have claimed that Tesla's profits were due to "one-time" regulatory credit sales that were going to disappear right away.
Here's a graph of the "disappearance" of regulatory credit sales to date.
11 of 69
Here's a graph of the "disappearance" of regulatory credit sales to date.
11 of 69
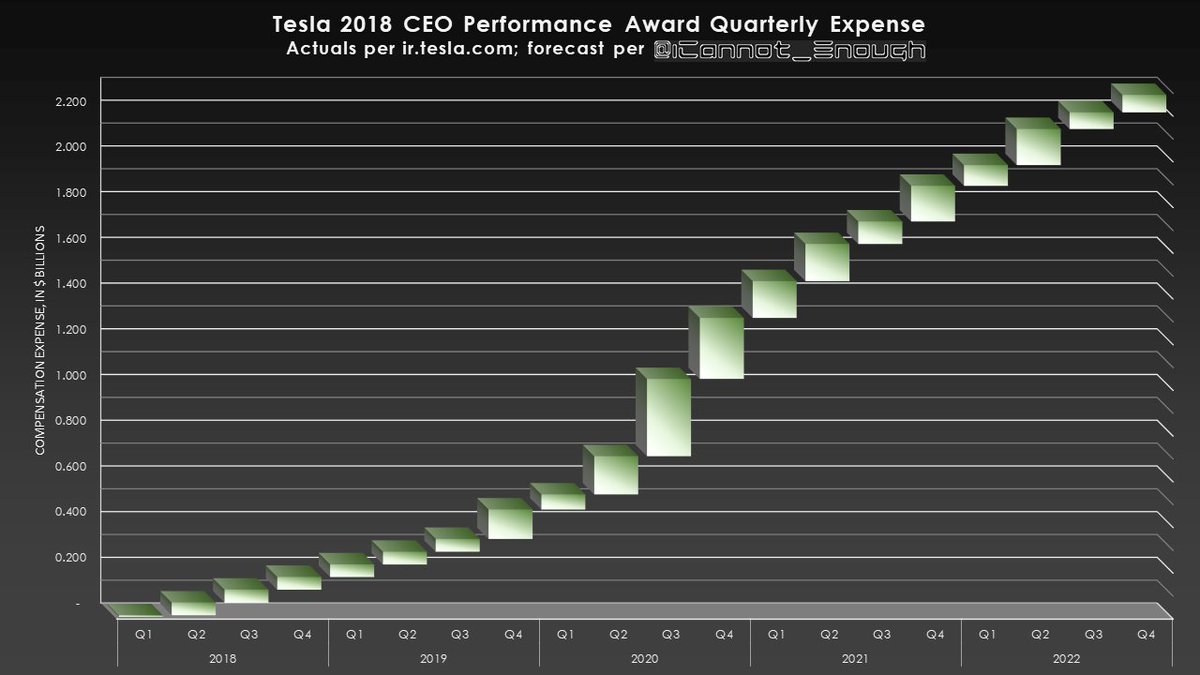
Here's a graph showing the stock-based compensation expense for the 2018 CEO Performance Award.
This is a non-cash expense excluded from non-GAAP earnings and will not exceed $2.283B over the 10-yr life of the compensation plan.
12 of 69
This is a non-cash expense excluded from non-GAAP earnings and will not exceed $2.283B over the 10-yr life of the compensation plan.
12 of 69
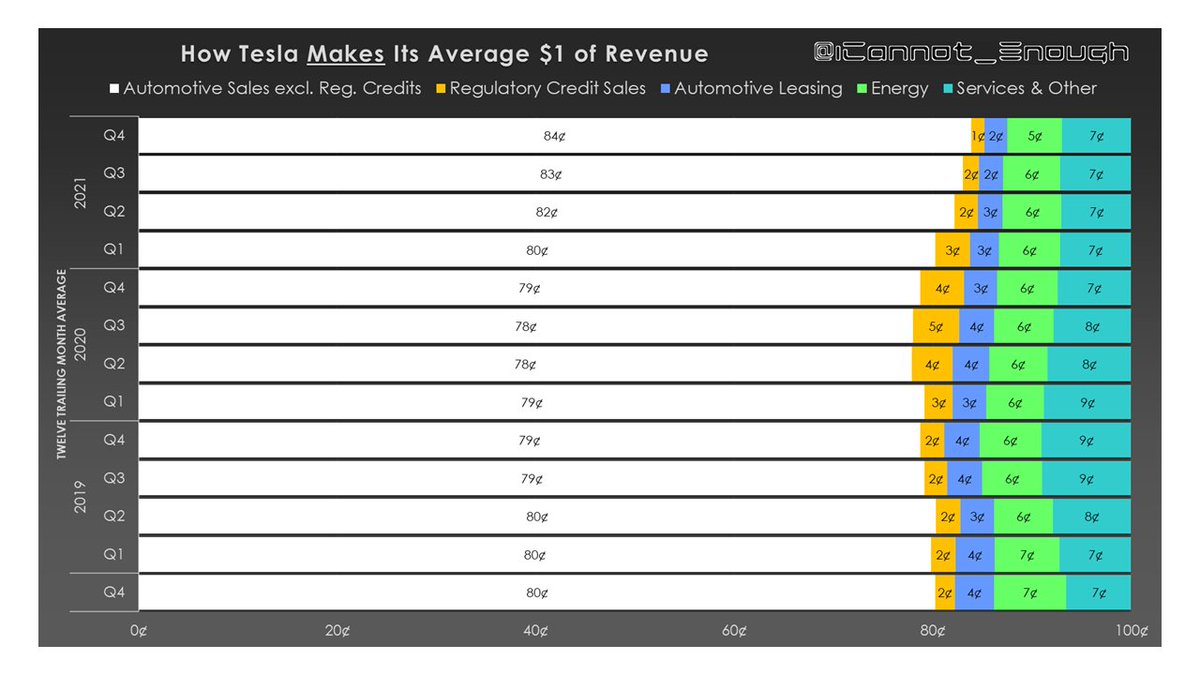
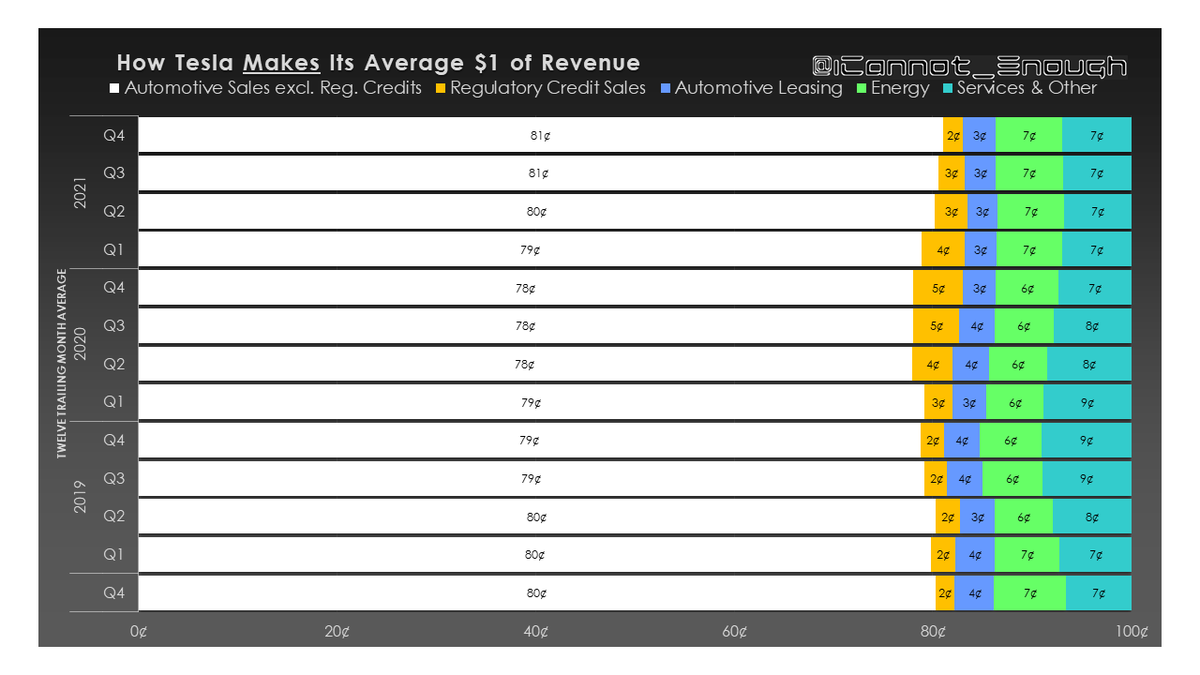
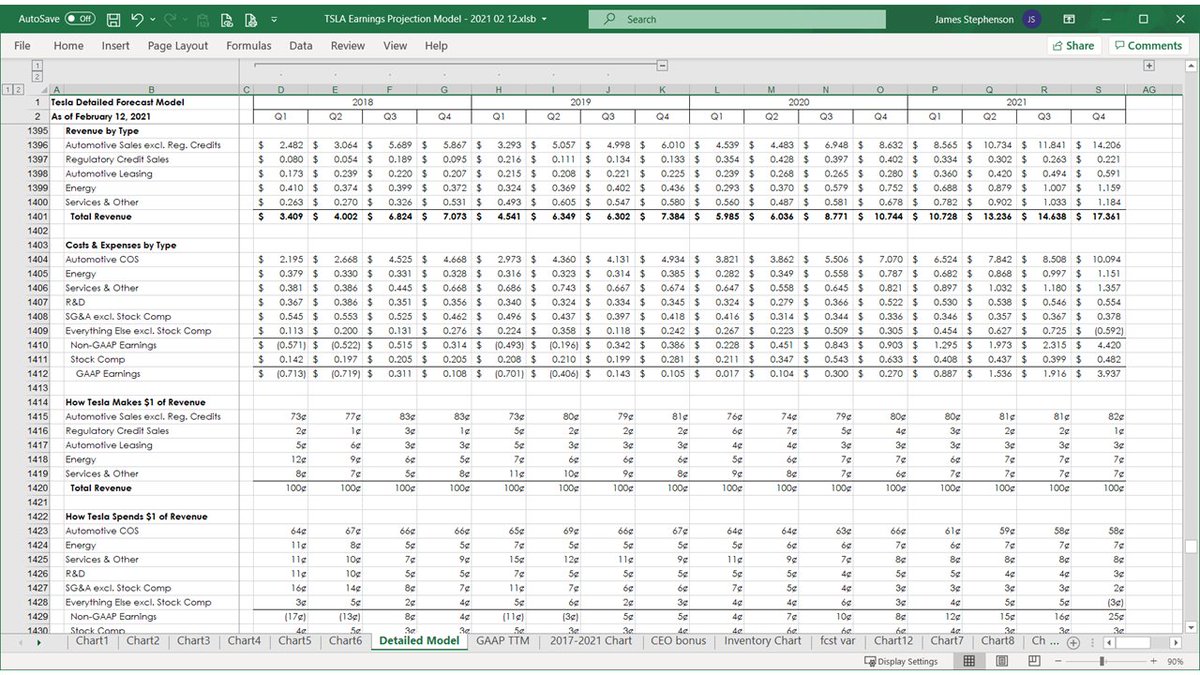
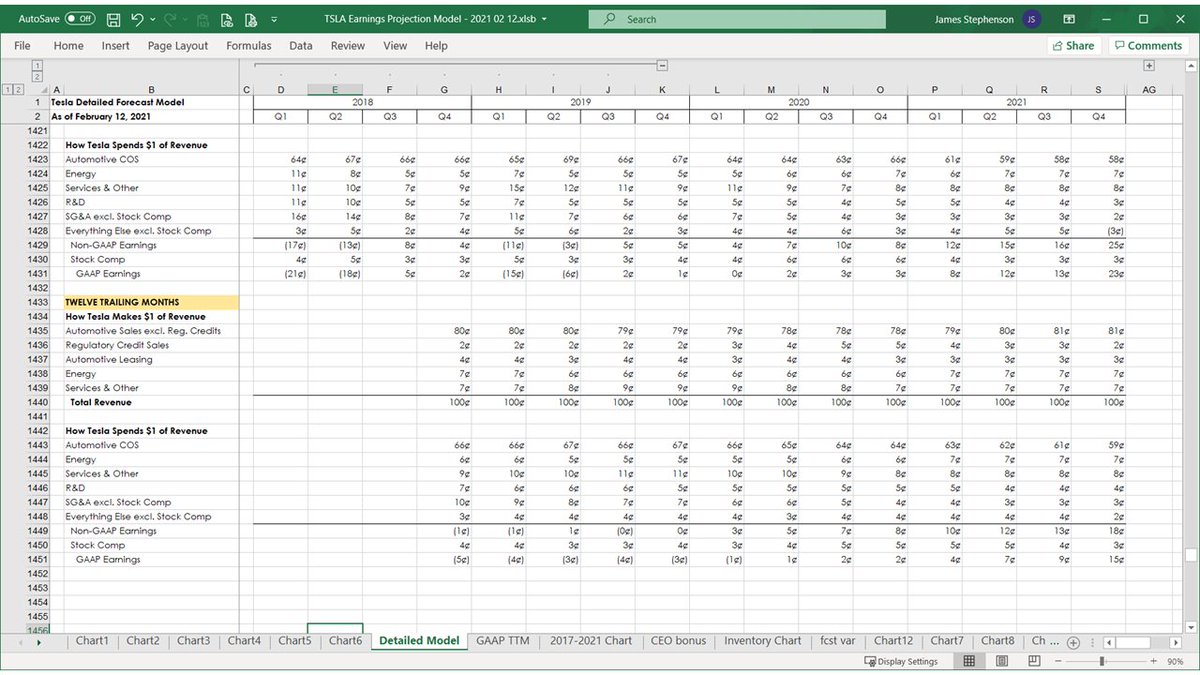
Here's a chart showing where the average dollar of Tesla revenue comes from over time, using a 12-month trailing average to smooth out seasonality.
13 of 69
13 of 69
Similarly, this chart shows how Tesla spends each dollar of revenue, on average. When Tesla spent more than the total revenue, there was a loss; when Tesla spent less than total revenue, there were profits.
14 of 69
14 of 69

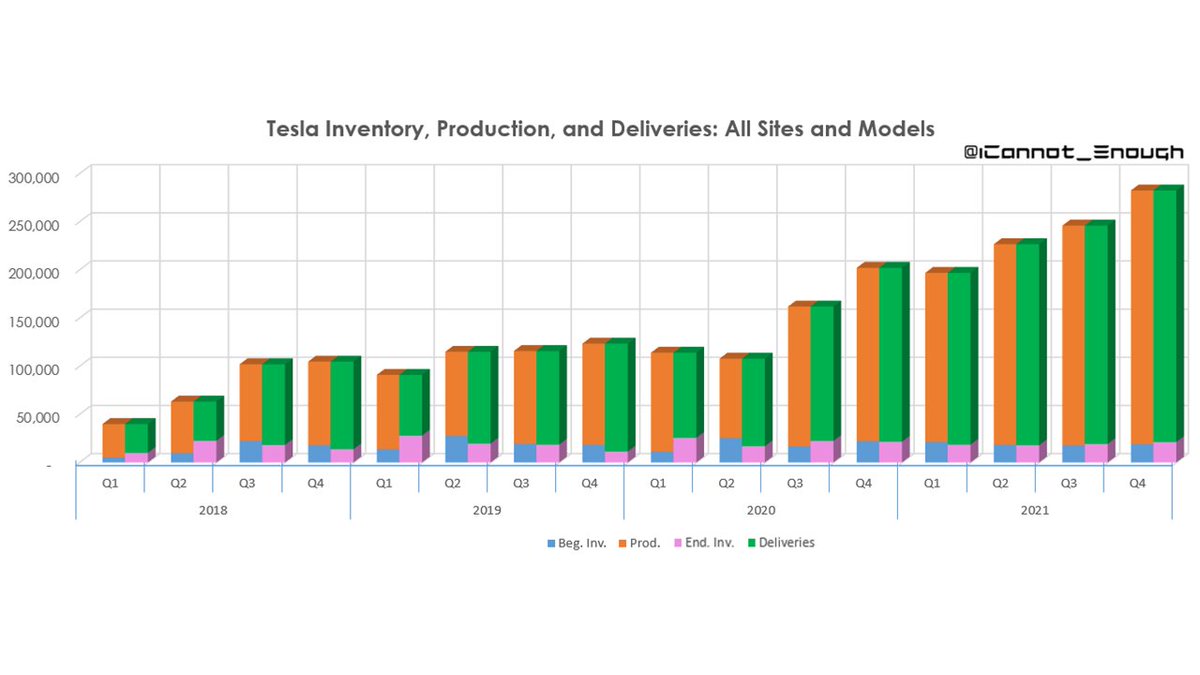
Here's a chart showing the relationship between beginning finished goods inventory, production, deliveries, and ending vehicle inventory, by quarter.
15 of 69
15 of 69
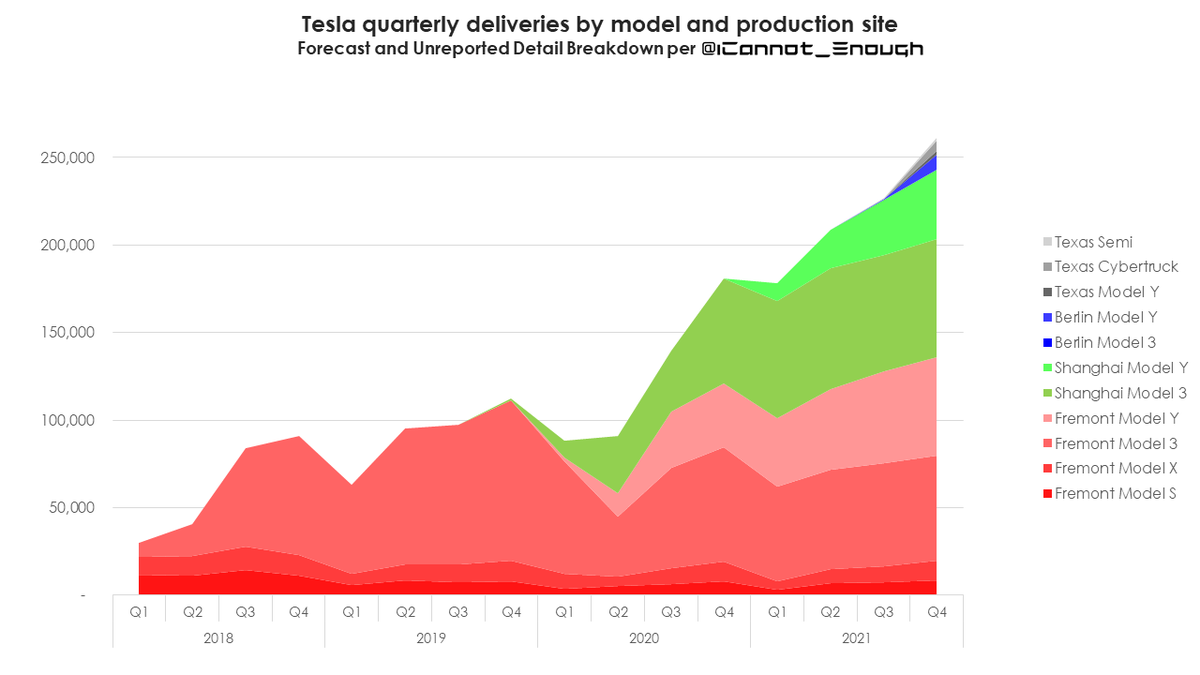
Here's a stacked area chart showing quarterly deliveries by site and model.
The next few years will see a lot of growth.
16 of 69
The next few years will see a lot of growth.
16 of 69
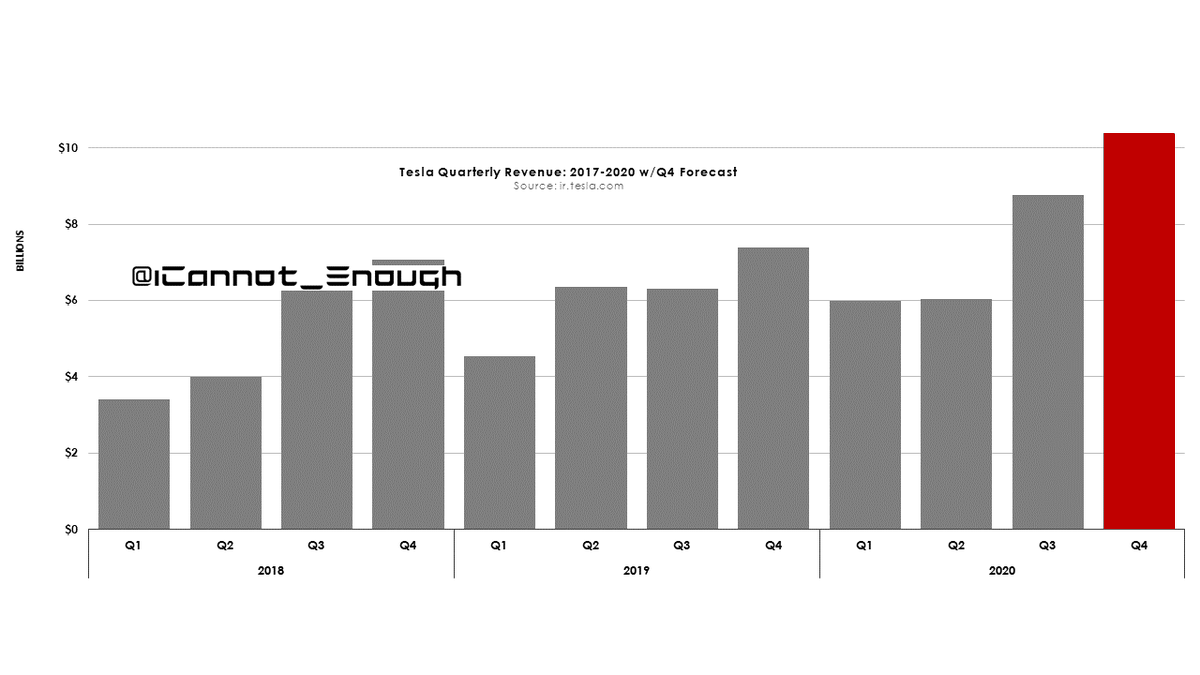
Here's what Tesla's total revenue looks like by quarter and year. So much for "the growth story is over". 😂🤣
17 of 69
17 of 69

Here's how premium vehicles have been selling in the U.S. over the past 4 years.
Despite selling only 4 models, Tesla has risen to 4th place (behind only Mercedes, BMW, and Lexus, all of which offer many models and are in decline).
18 of 69
Despite selling only 4 models, Tesla has risen to 4th place (behind only Mercedes, BMW, and Lexus, all of which offer many models and are in decline).
18 of 69

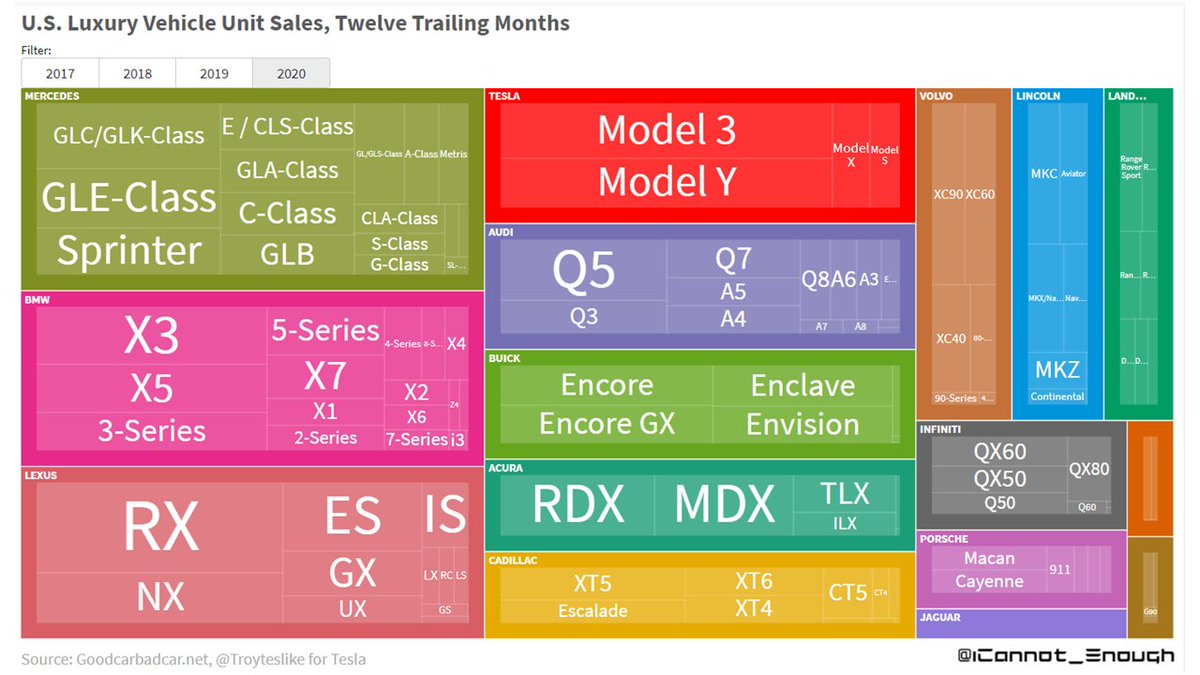
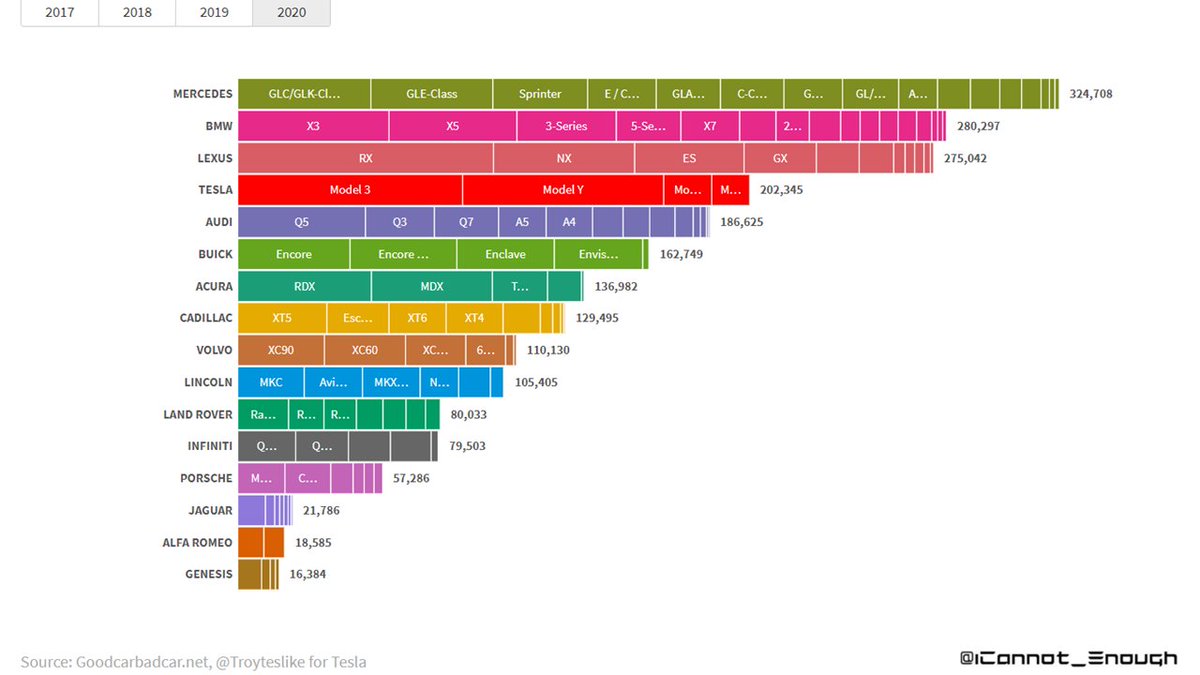
Here's a more detailed look at U.S. premium vehicle sales by model and brand.
The Tesla Model 3 and Model Y are among the 3 most popular premium vehicles in the U.S., trailing only the venerable Lexus RX.
19 of 69
The Tesla Model 3 and Model Y are among the 3 most popular premium vehicles in the U.S., trailing only the venerable Lexus RX.
19 of 69
Here's another way of visualizing the same data as the previous chart to compare unit sales magnitude.
20 of 69
20 of 69
The remainder of this thread shows my detailed forecast model, for those few lovable giant 🤓🤓🤓 who want to read through it.
Also, from time to time, people question its existence, so I tweet it out once per quarter.
21 of 69
Also, from time to time, people question its existence, so I tweet it out once per quarter.
21 of 69
I believe in doing a very detailed forecast to force myself to think through the variables impacting the P&L for each model at each site every quarter.
22 of 69
22 of 69
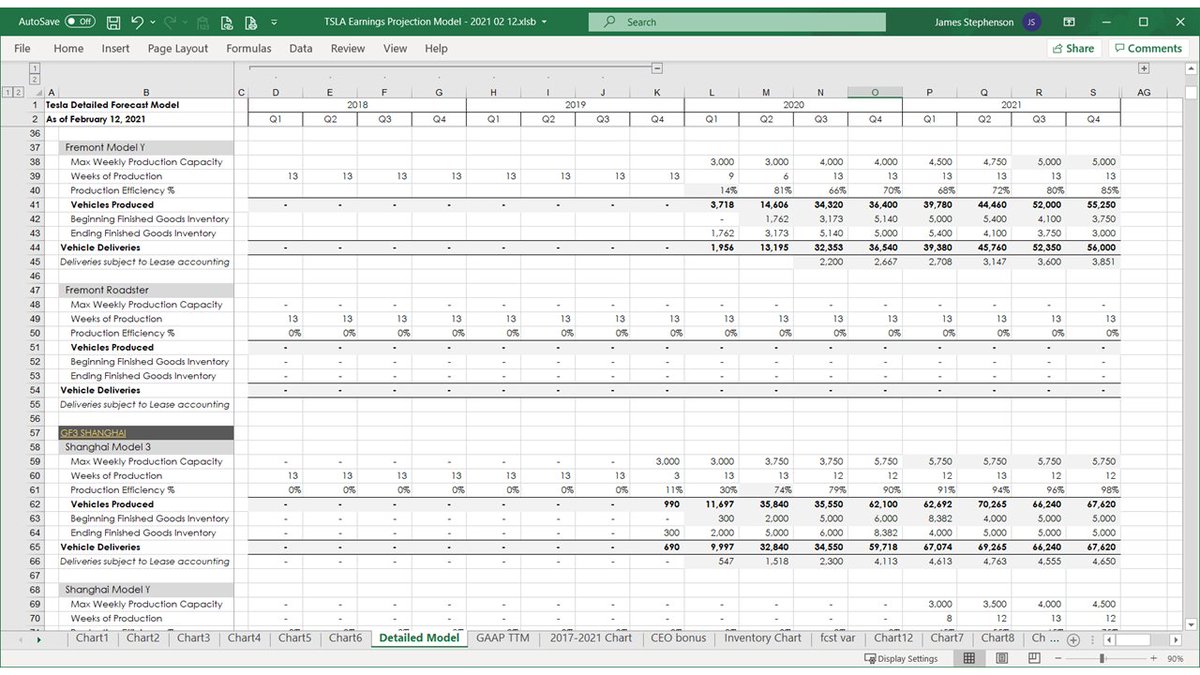
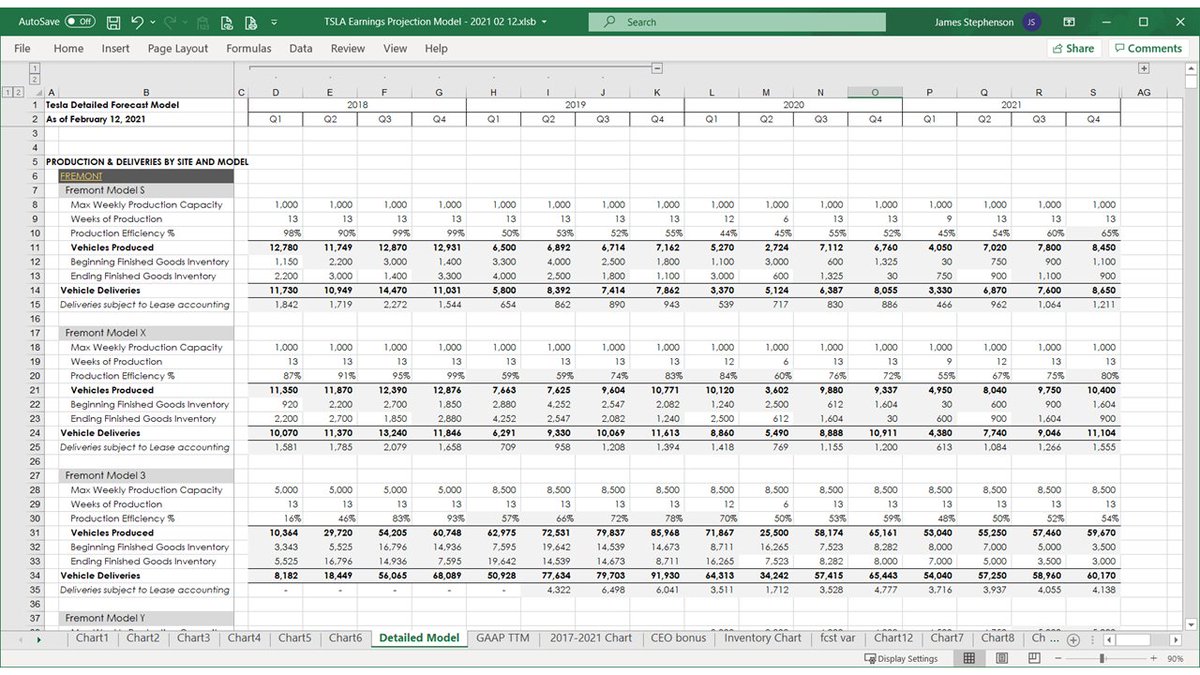
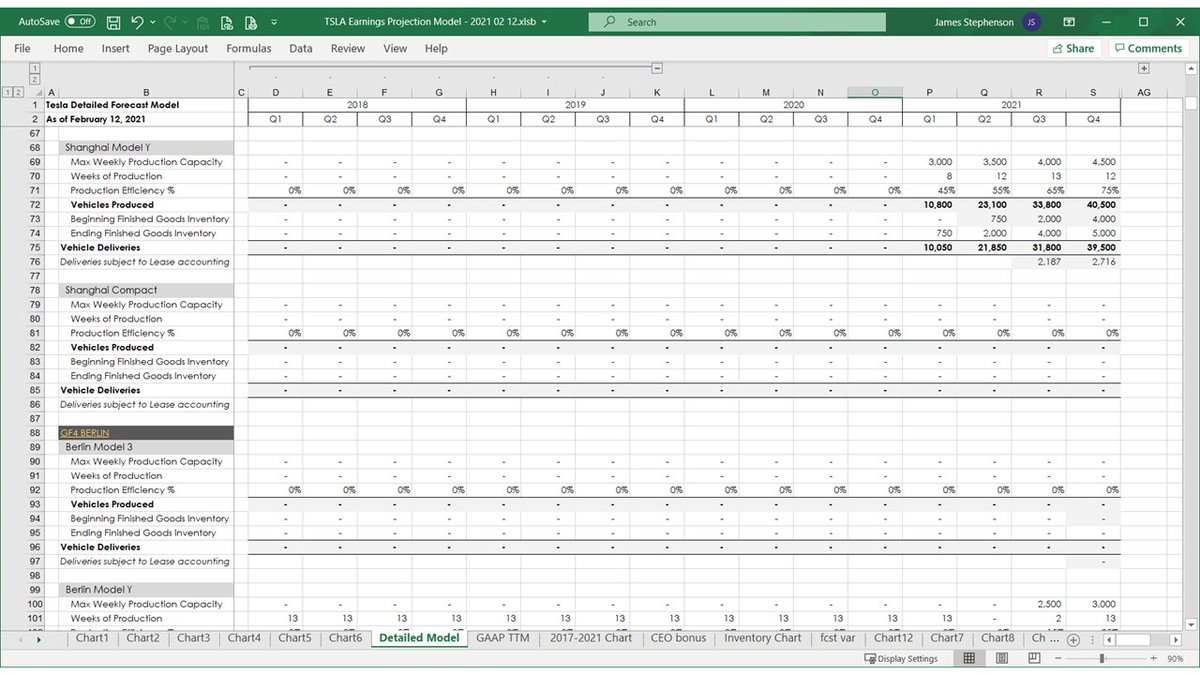
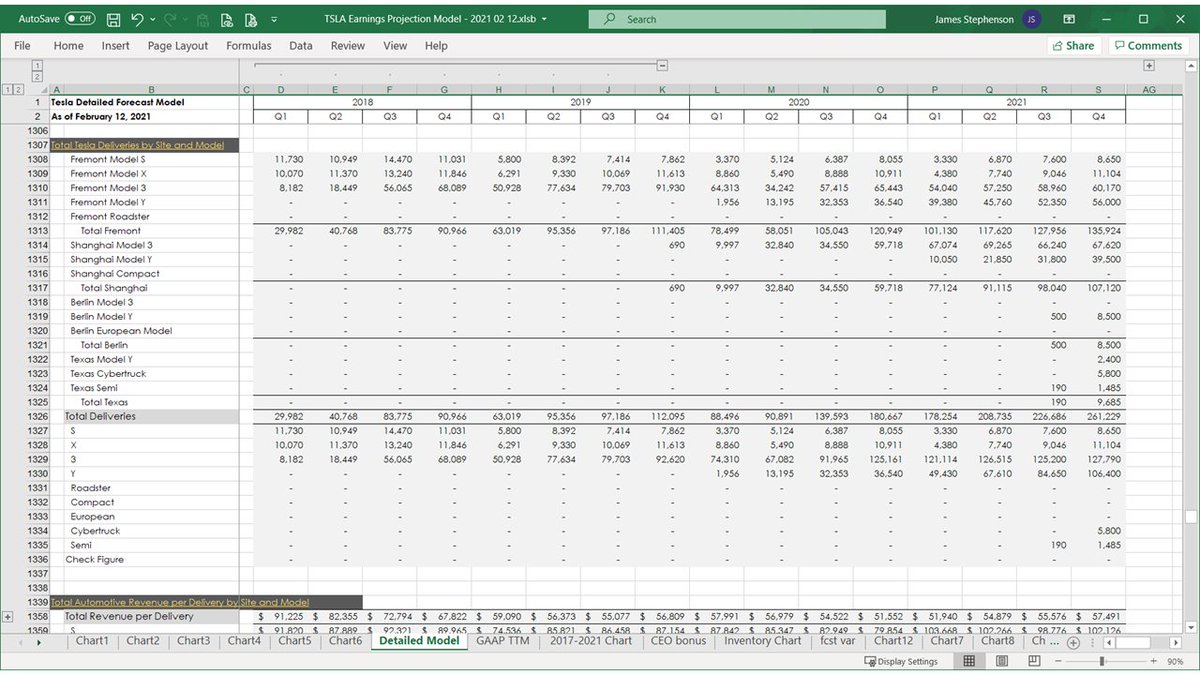
The first section in my forecast detail worksheet builds up to total deliveries using capacity, production weeks, average efficiency, and beginning and ending inventory, by site, by model, by quarter.
23 of 69
23 of 69
24 of 69

These are the totals from the production and deliveries section.
25 of 69
25 of 69
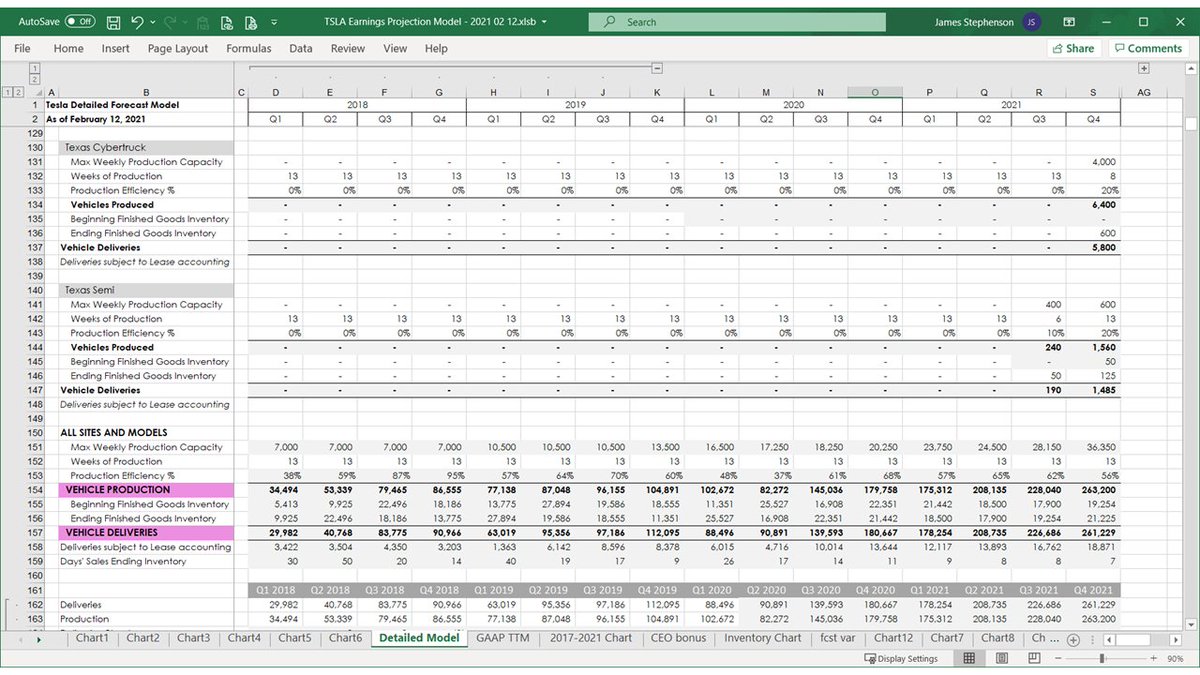
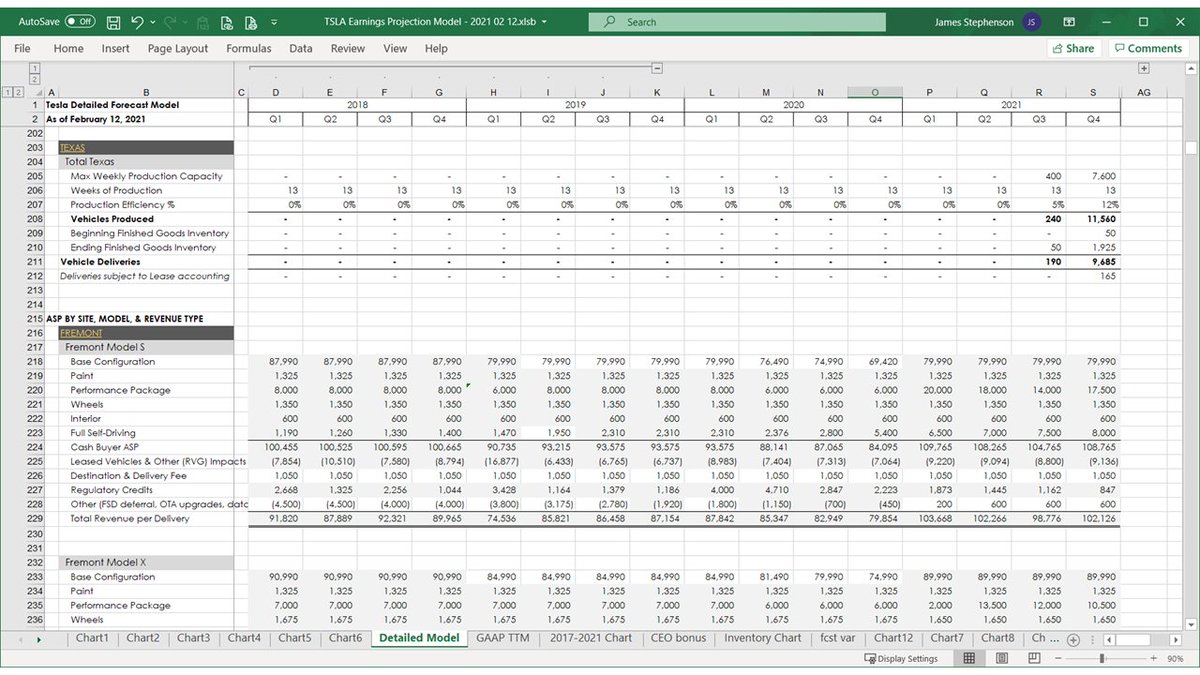
These are production and delivery subtotals by site.
26 of 69
26 of 69

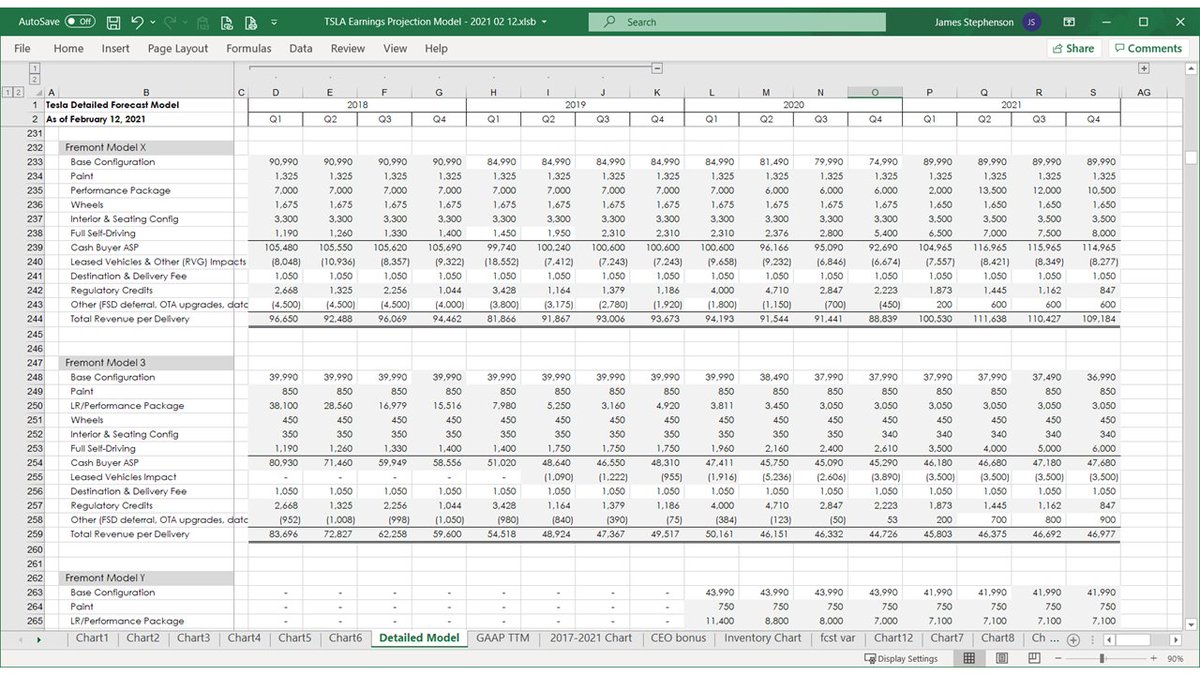
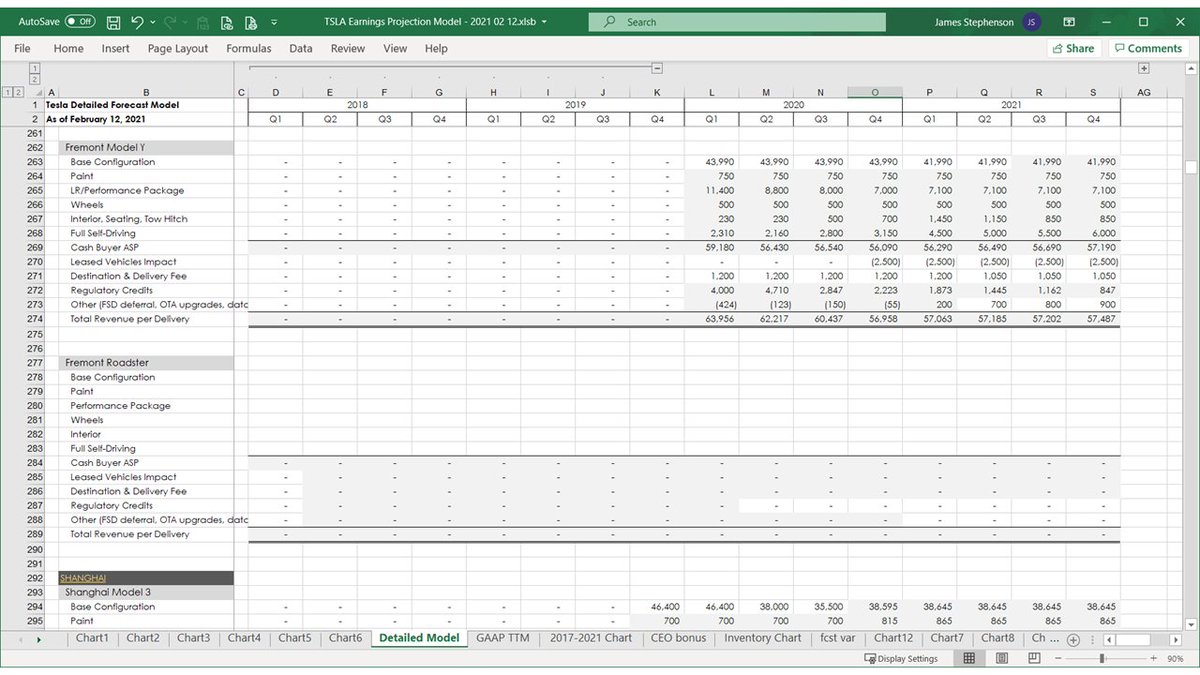
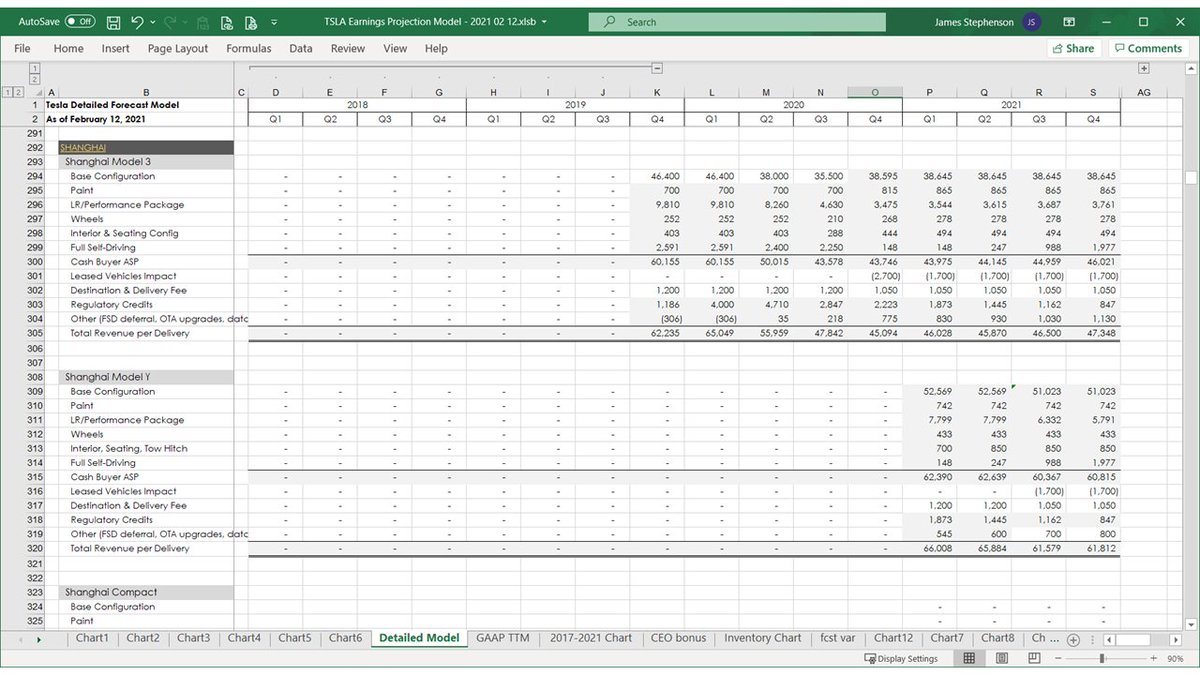
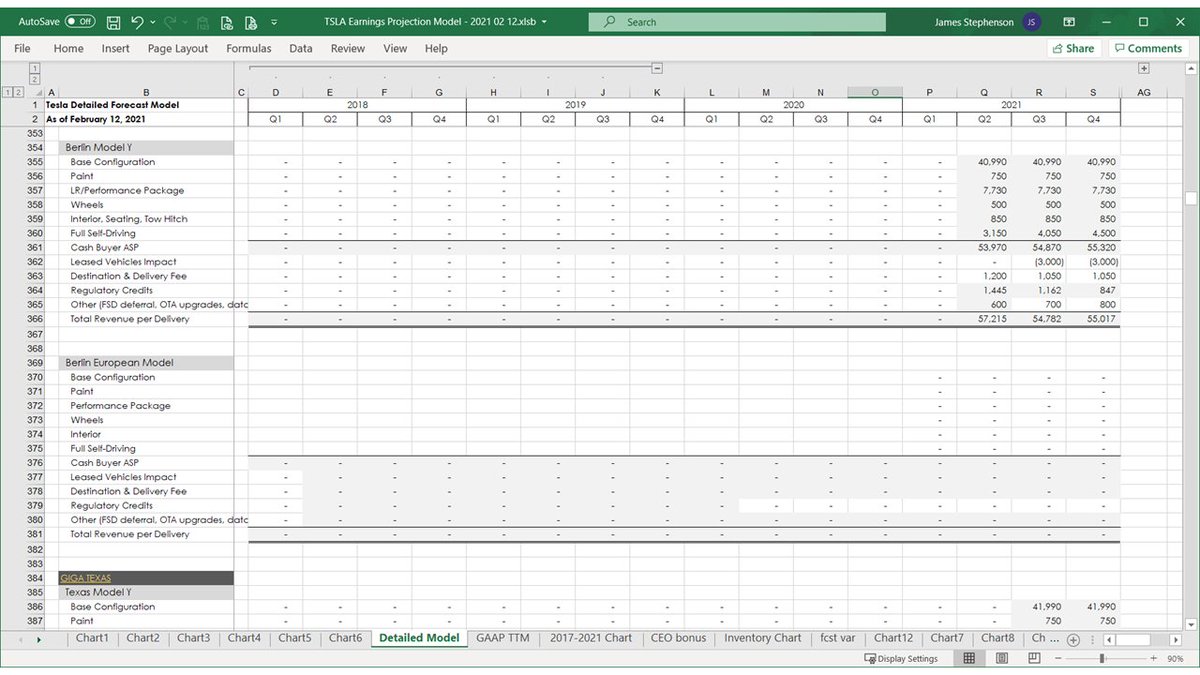
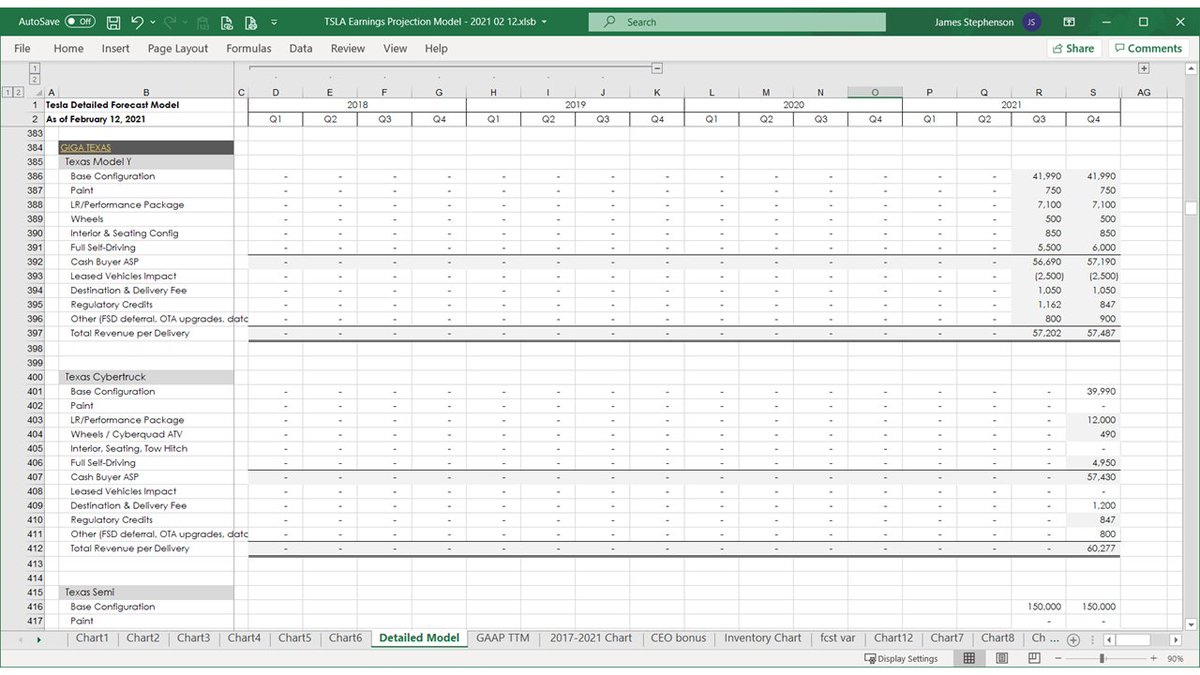
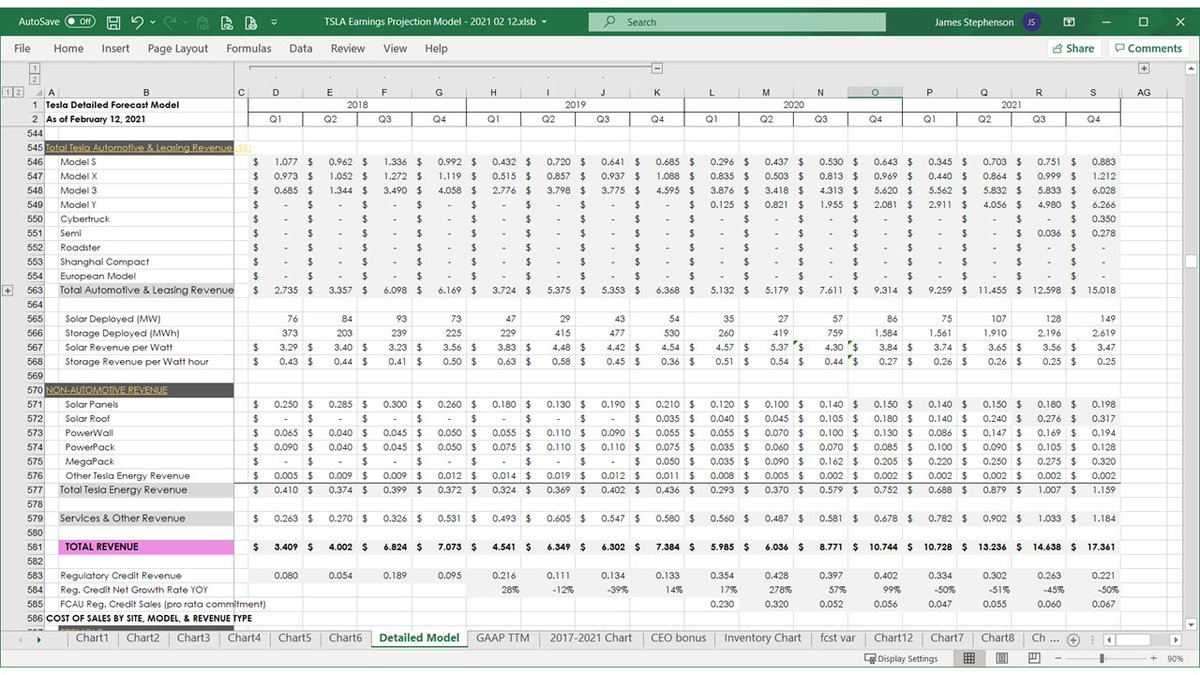
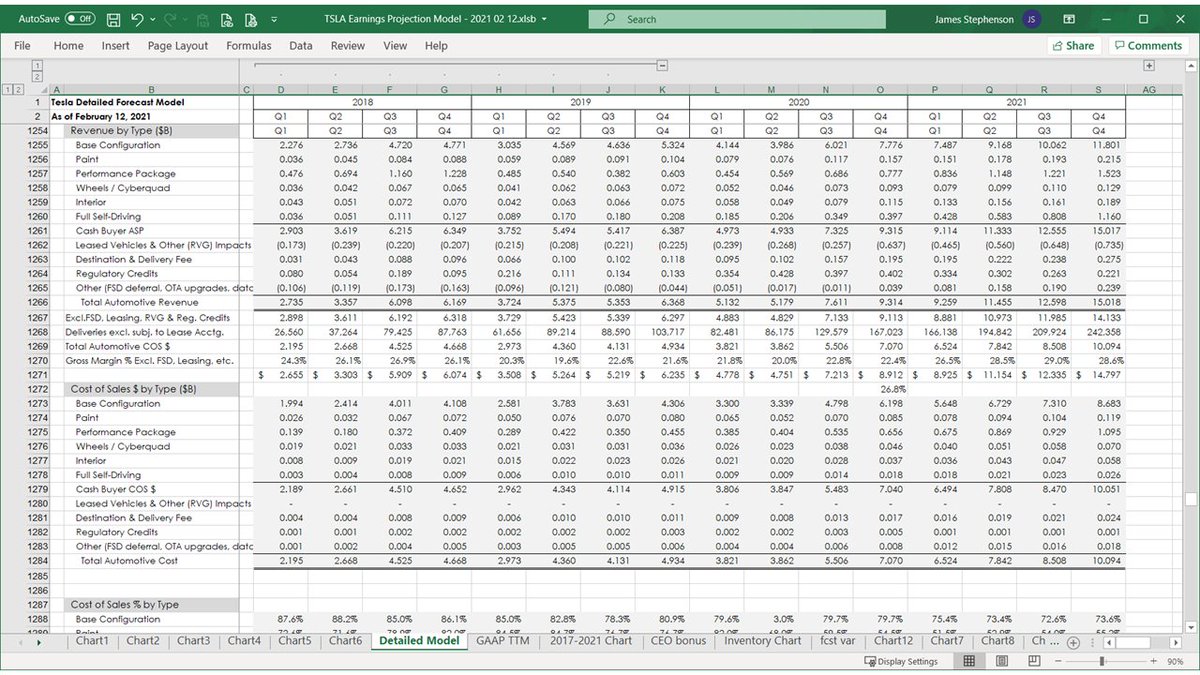
The next section builds up to revenue by model by site by quarter from the base price to the average revenue per vehicle by making assumptions about take rates, option pricing, FSD, Leasing, and Other Automotive Revenue, etc.
27 of 69
27 of 69
28 of 69
29 of 69
30 of 69
31 of 69

32 of 69
33 of 69
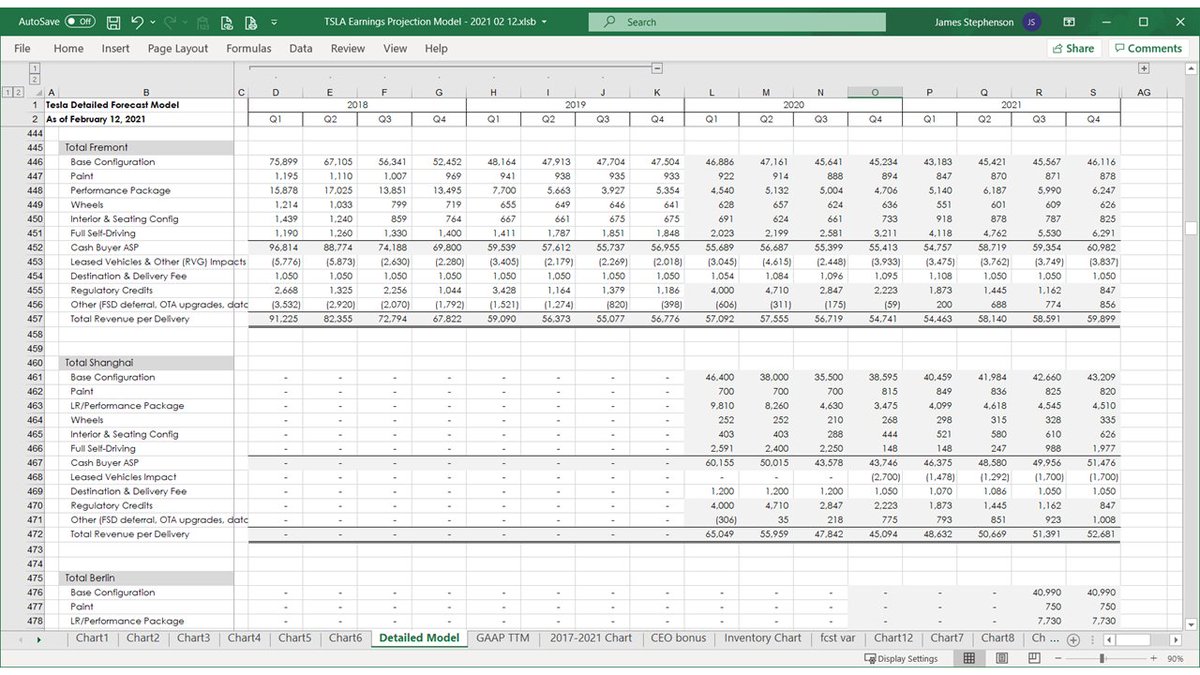
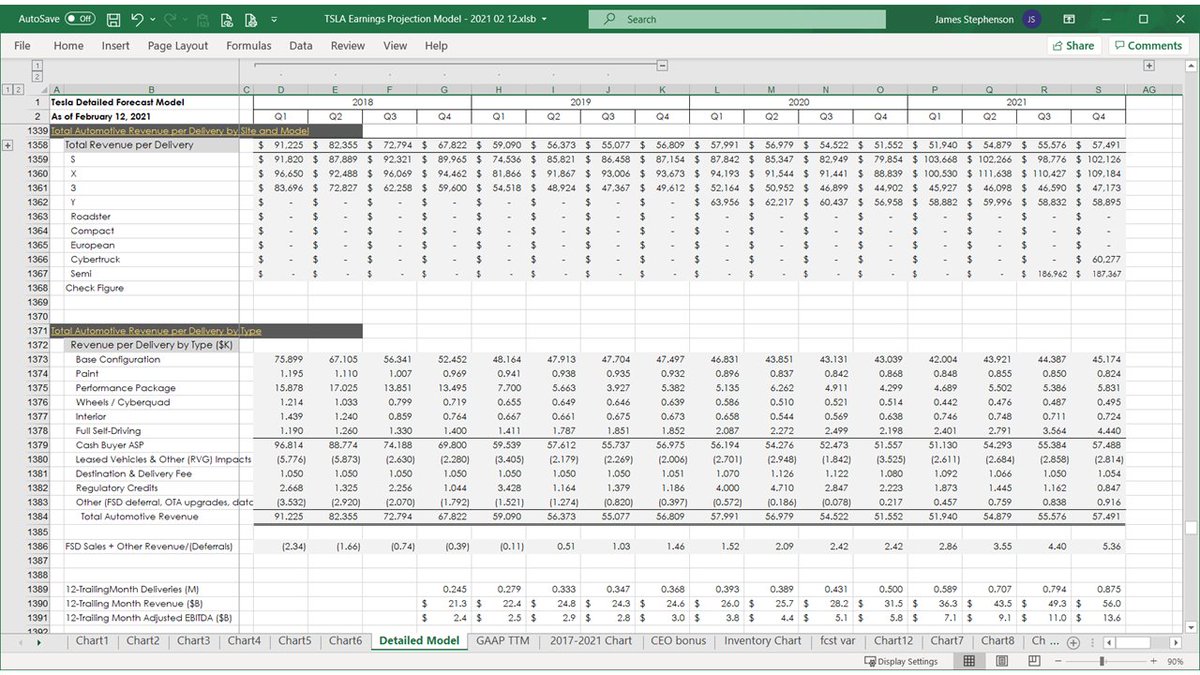
Average sale price subtotals by site:
34 of 69
34 of 69

Hey - you made it halfway to the end of this thread!
🎉🎉🎉🎉🎉🎉🎉🎉
35 of 69
🎉🎉🎉🎉🎉🎉🎉🎉
35 of 69
36 of 69

Here are the global total ASPs for Cash Buyers vs. Leasing vs. Combined Total.
37 of 69
37 of 69

Here are some metrics and revenue detail for Tesla Energy and Services & Other Revenue.
Truly a page only @MatchasmMatt could love.
38 of 69
Truly a page only @MatchasmMatt could love.
38 of 69
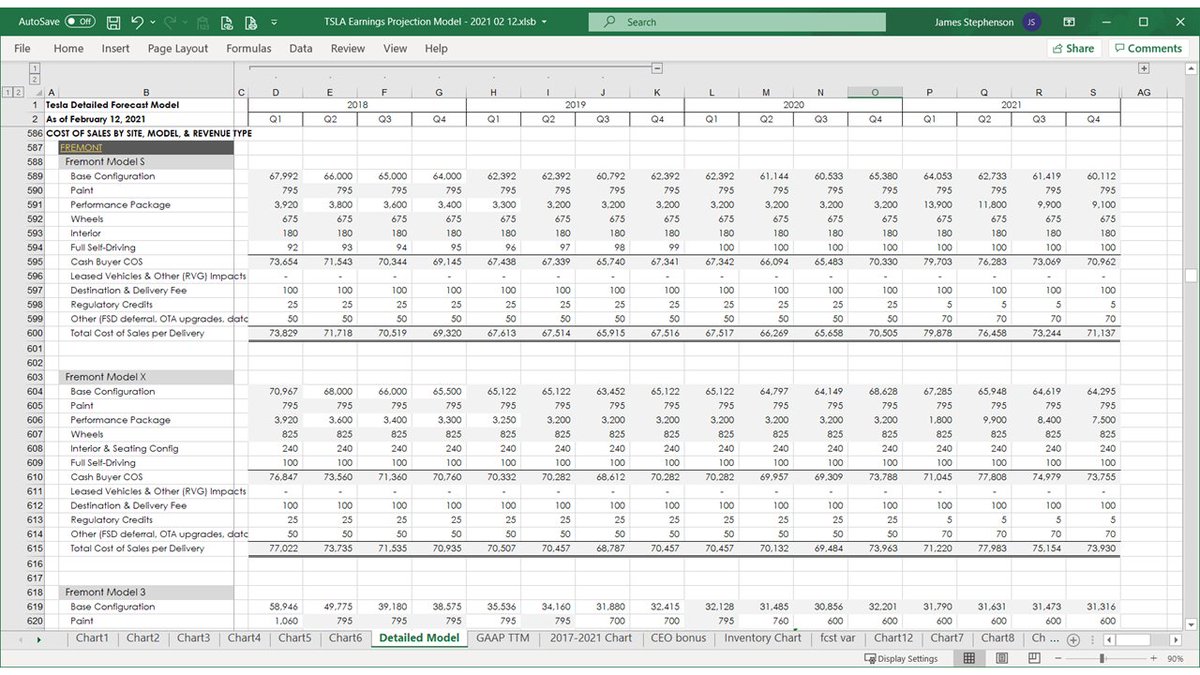
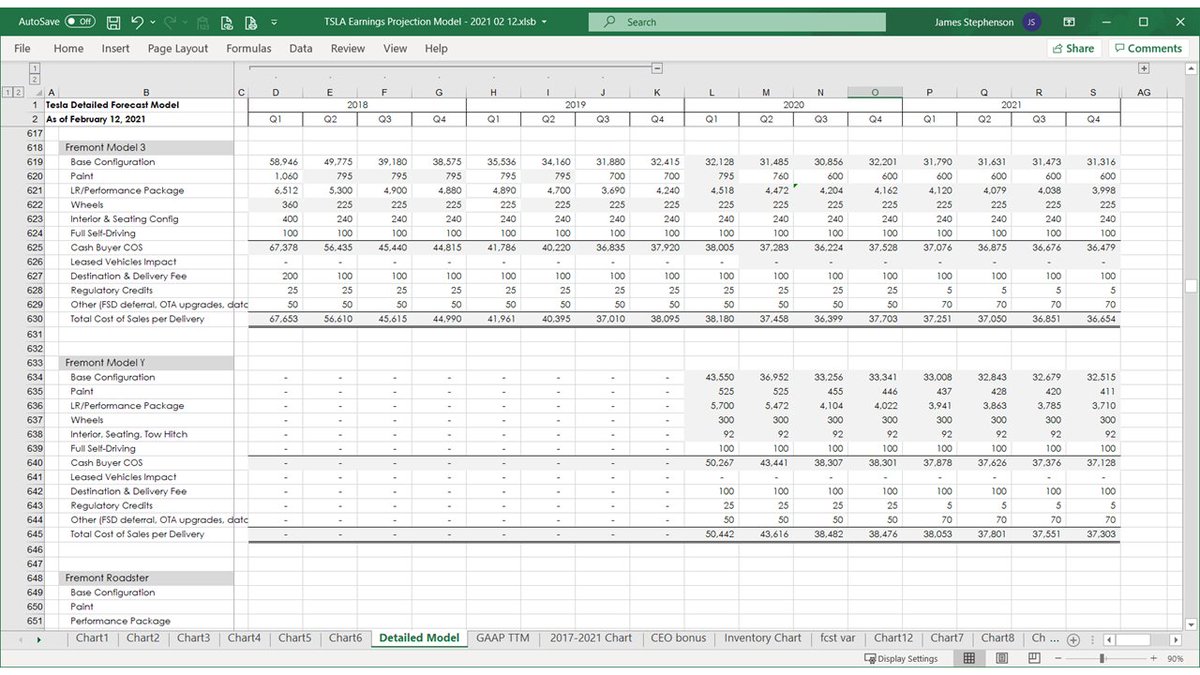
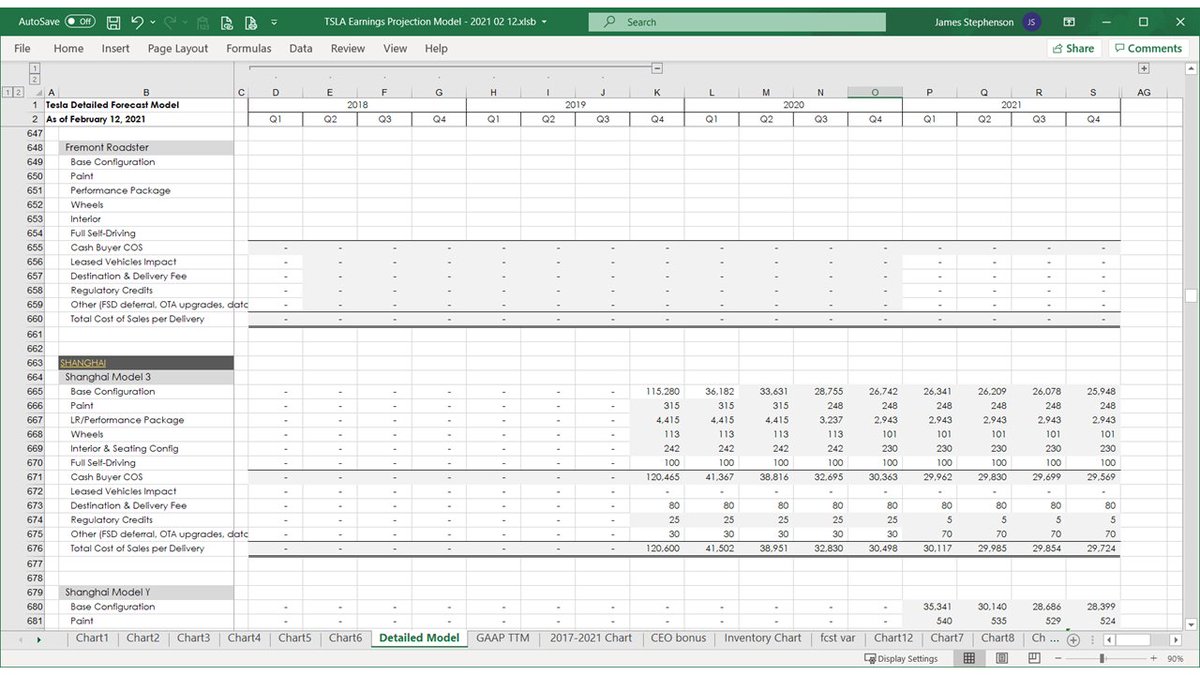
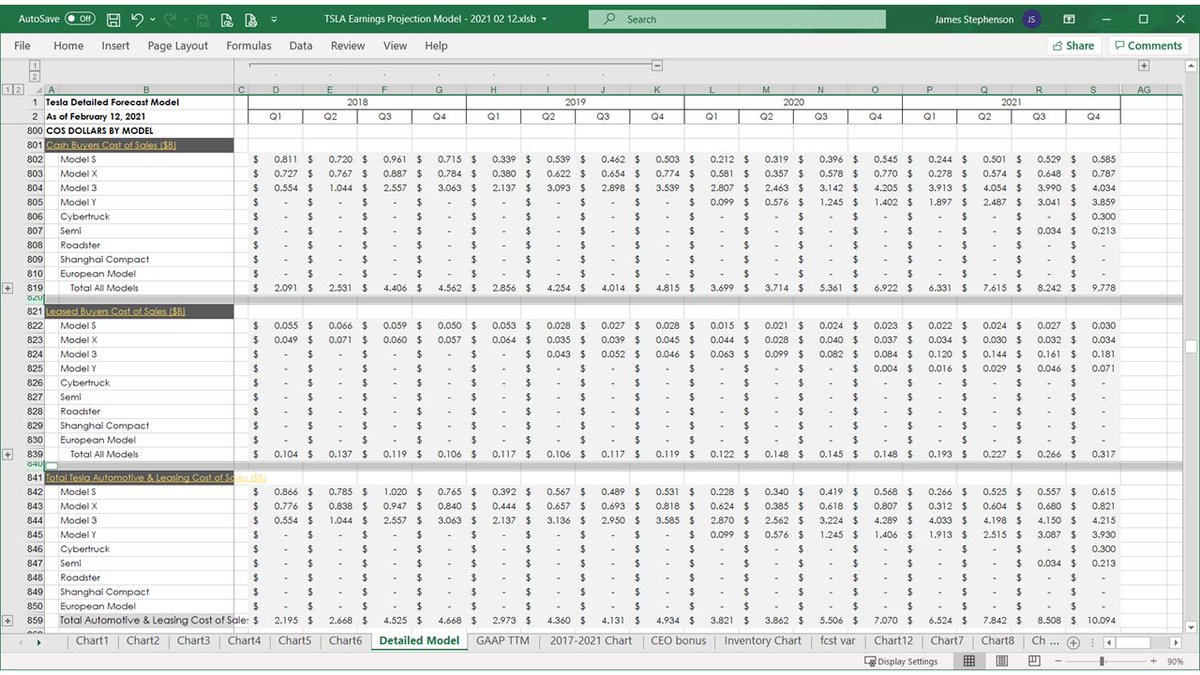
The third section of my model forecasts Cost of Sales, at the same level of detail I forecast revenue in the previous section.
39 of 69
39 of 69
40 of 69
41 of 69
42 of 69
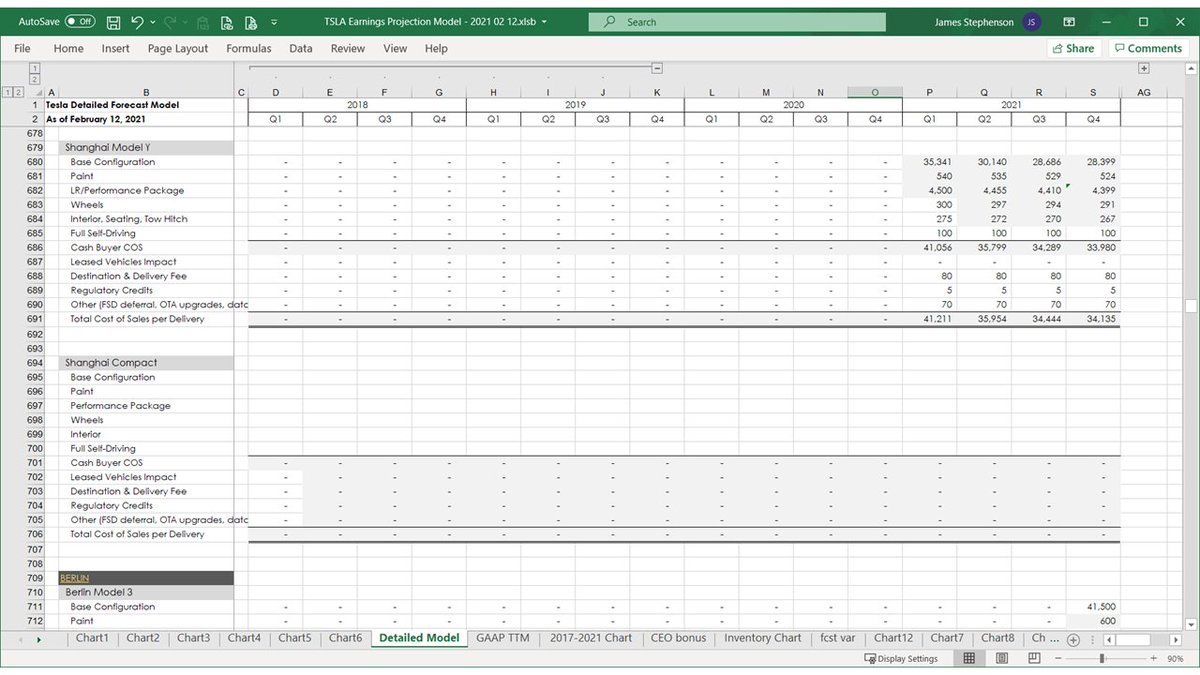
43 of 69
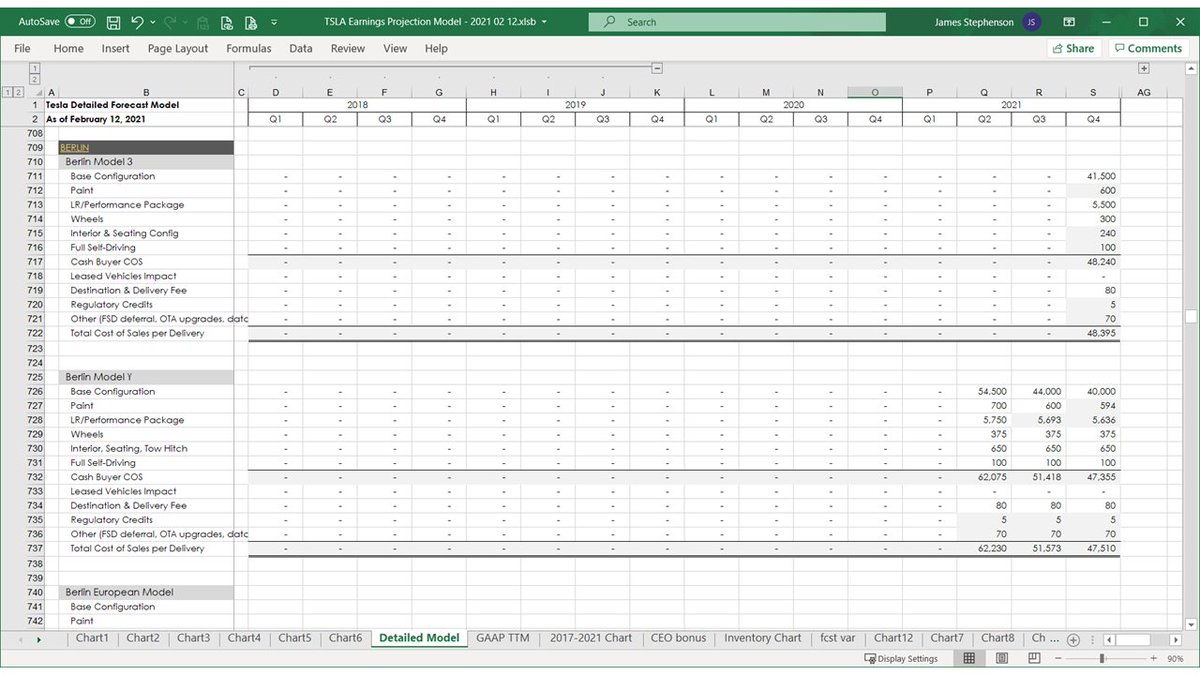
44 of 69
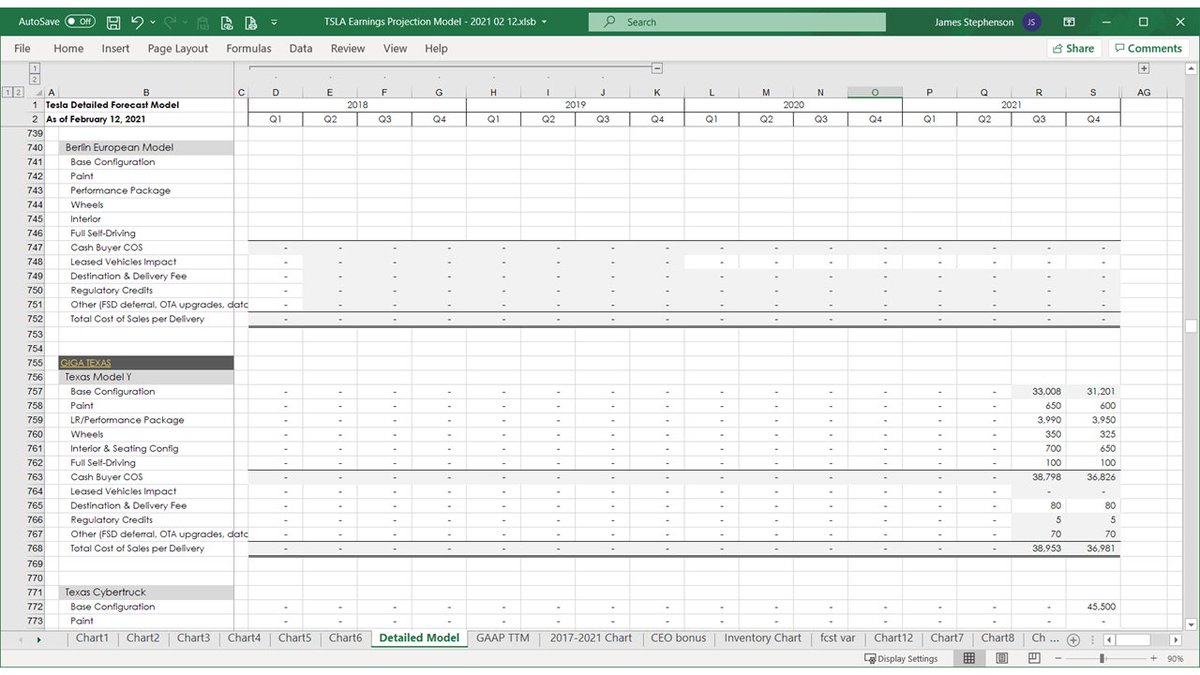
45 of 69
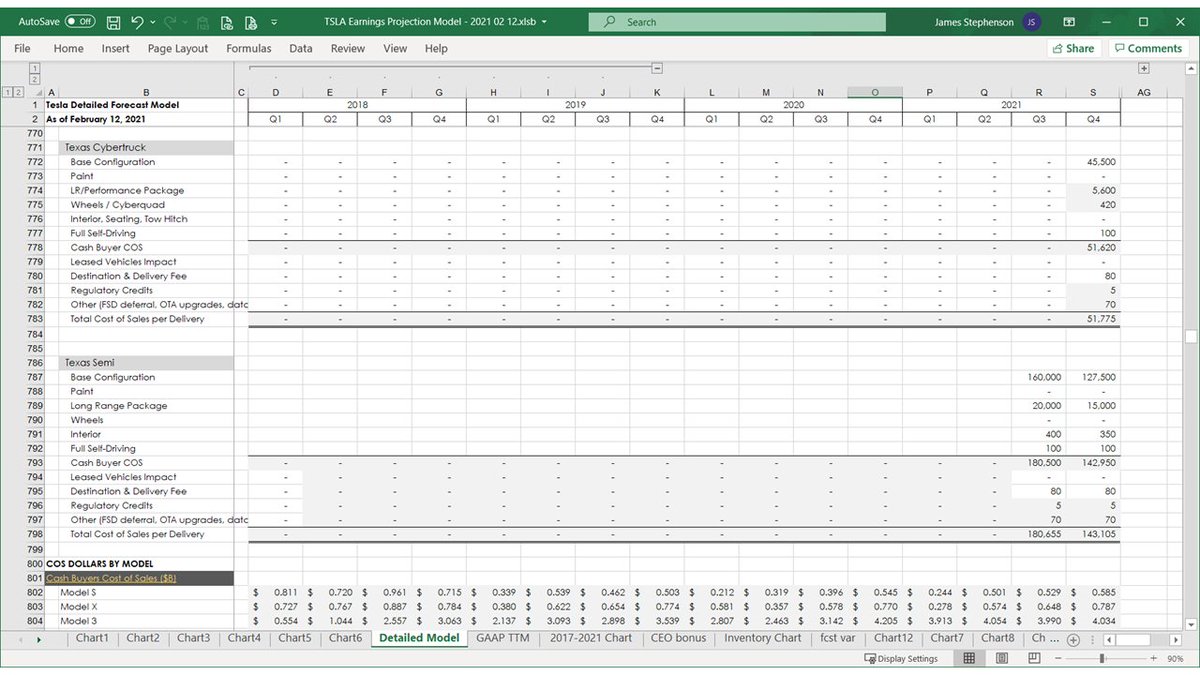
These are the global averages for Cost of Sales per vehicle by model.
46 of 69
46 of 69
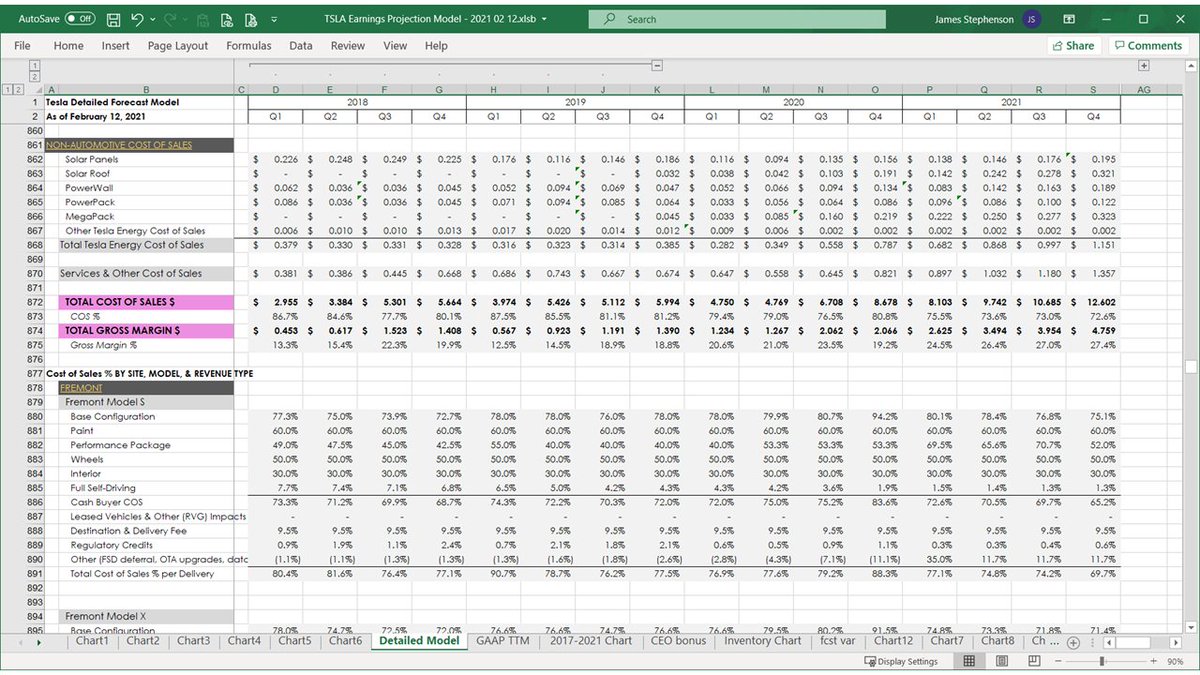
Here are the Tesla Energy costs and Services & Other costs.
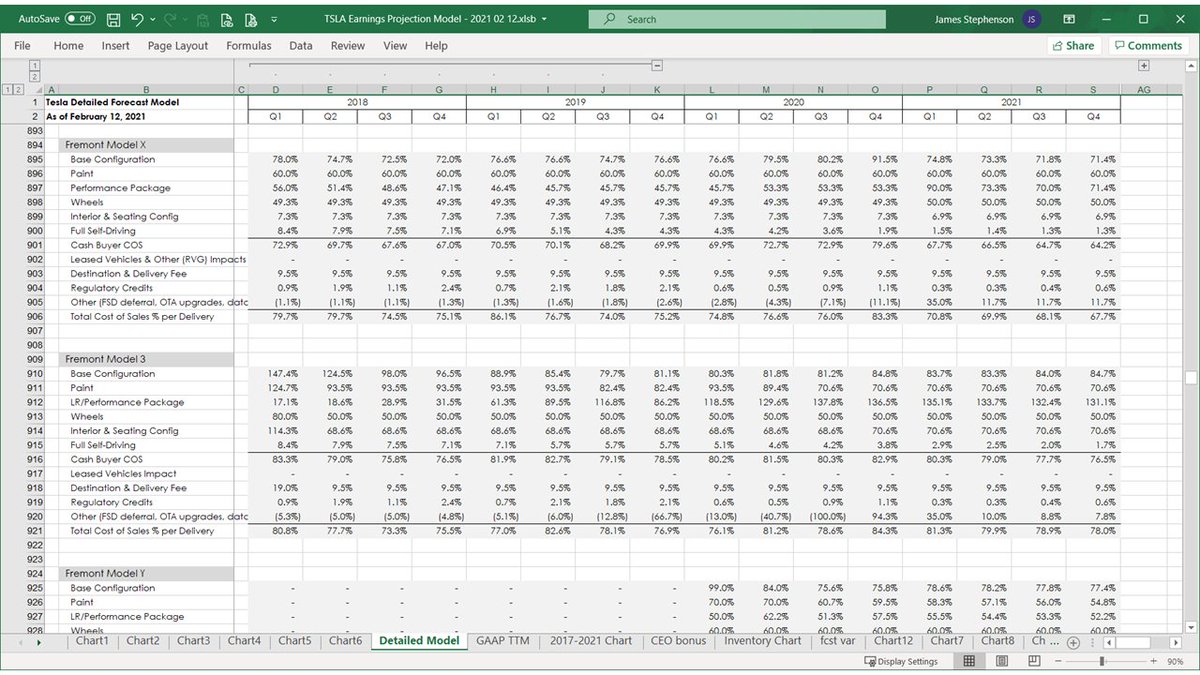
This also starts the 4th section: Cost of Sales percentages, which are just the cost detail in the 3rd section divided by the revenue detail in the 2nd section.
47 of 69
This also starts the 4th section: Cost of Sales percentages, which are just the cost detail in the 3rd section divided by the revenue detail in the 2nd section.
47 of 69
48 of 69
49 of 69
50 of 69
51 of 69
52 of 69
53 of 69
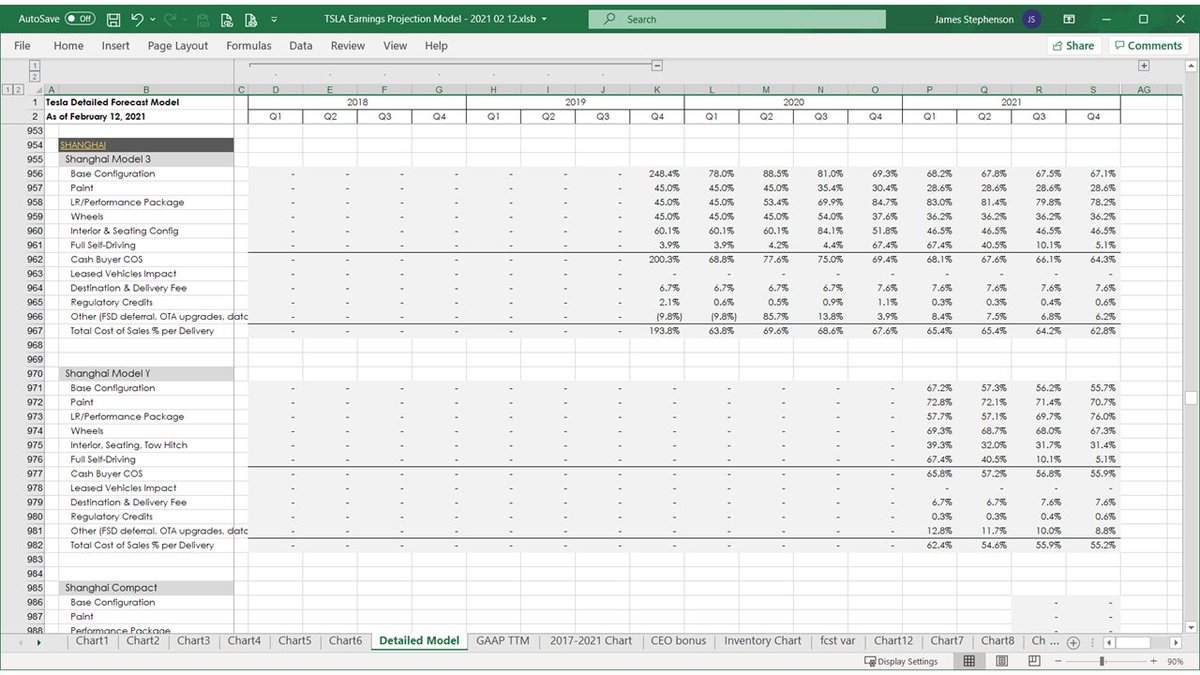
We're more than 1,000 rows down my 'Detailed Model' tab now.
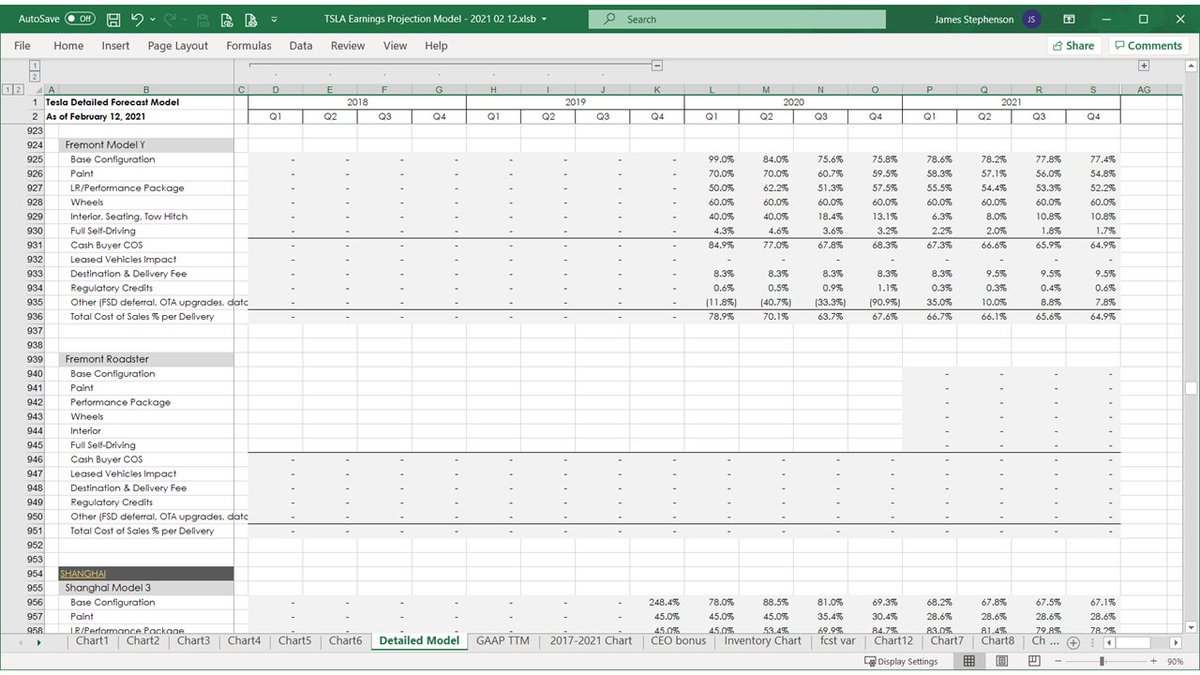
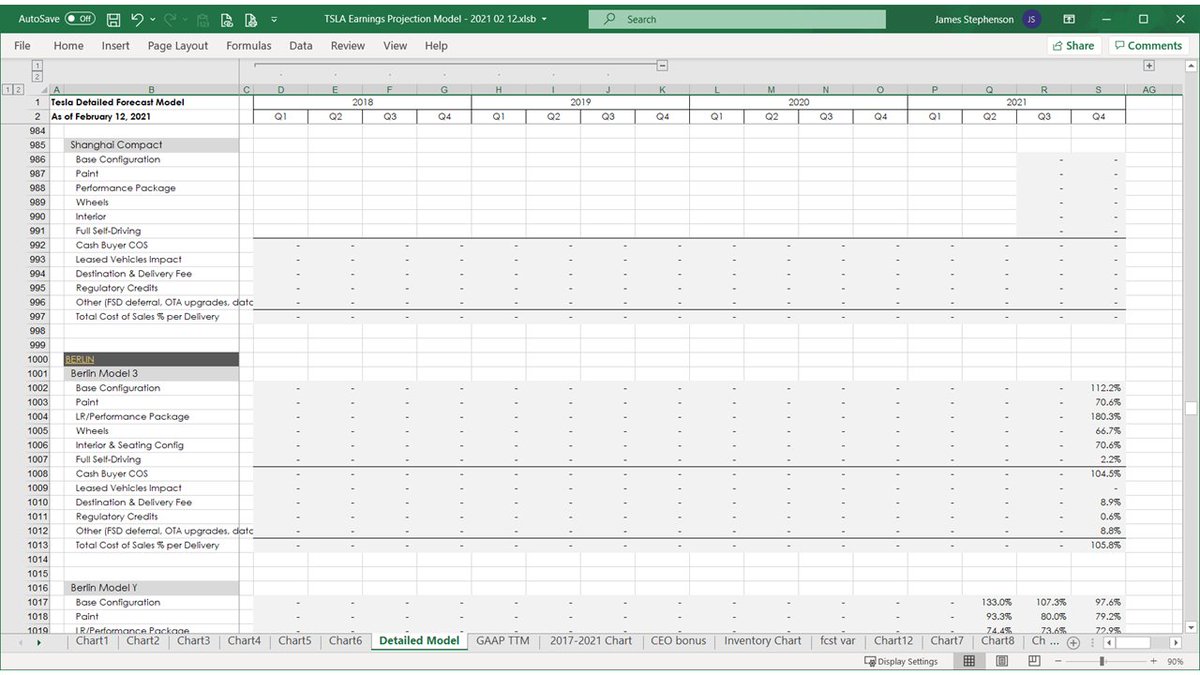
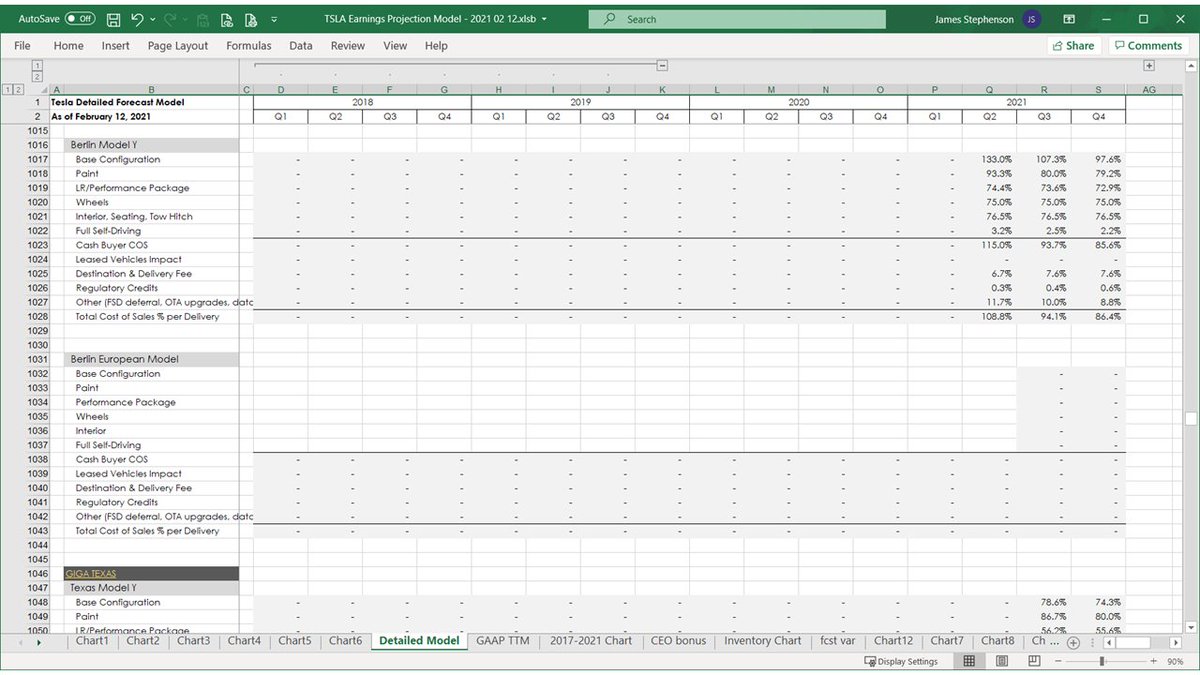
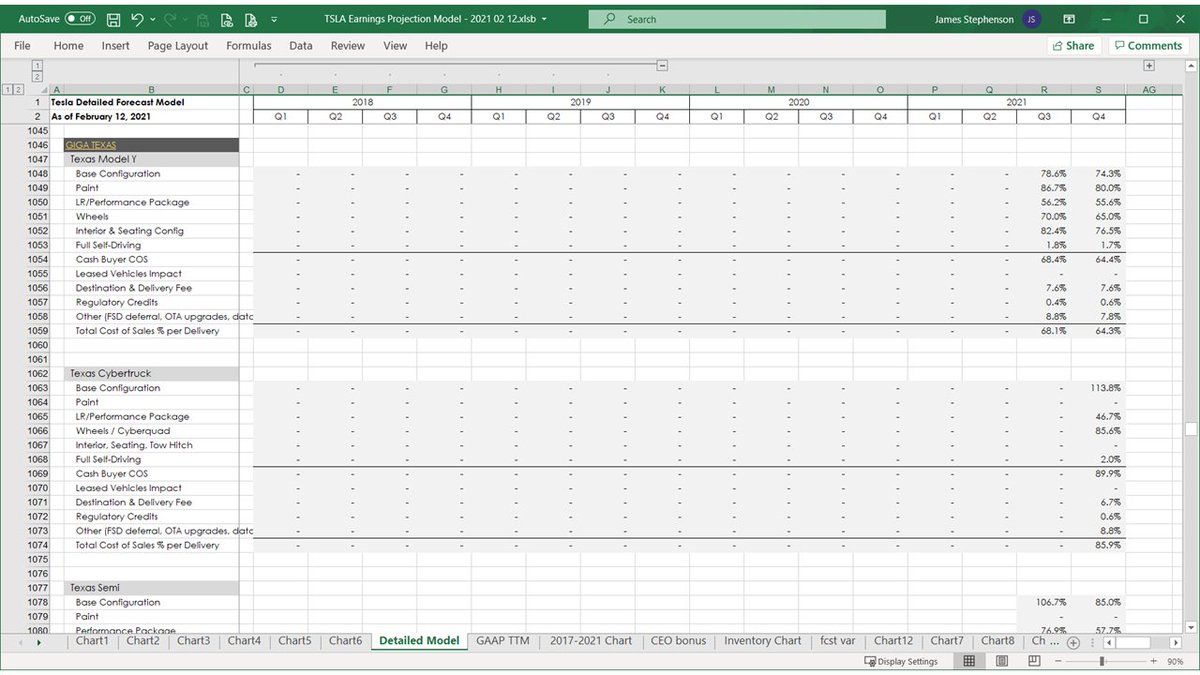
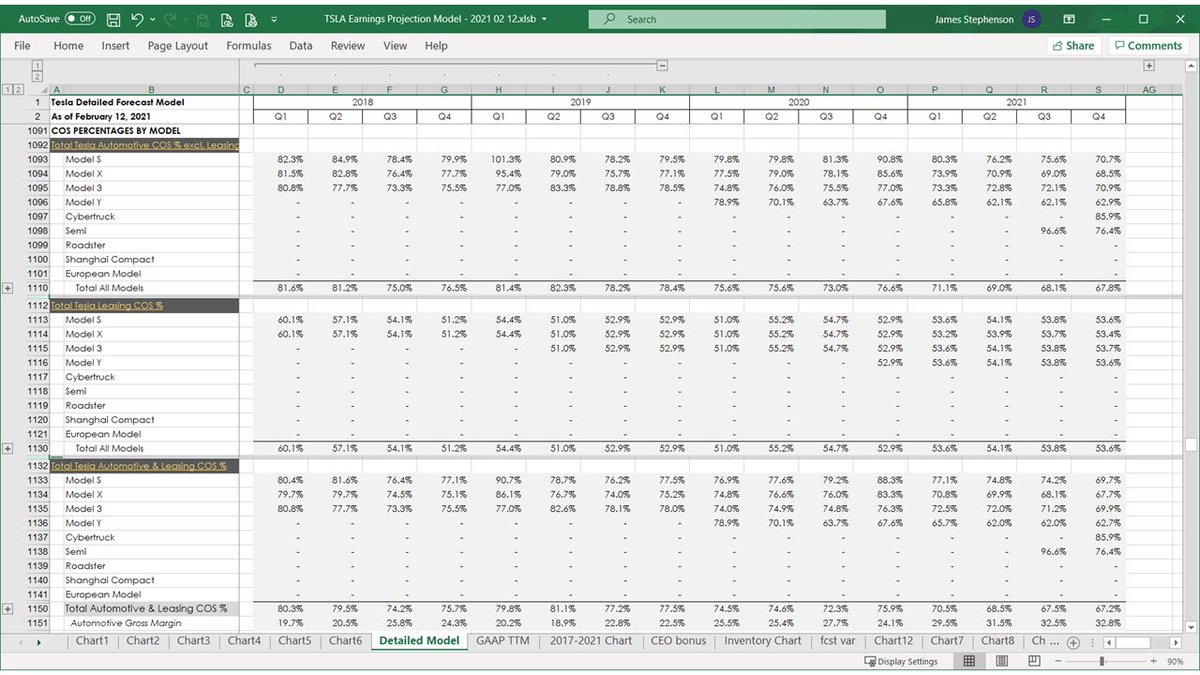
Here are the Cost of Sales %s by model.
54 of 69
Here are the Cost of Sales %s by model.
54 of 69
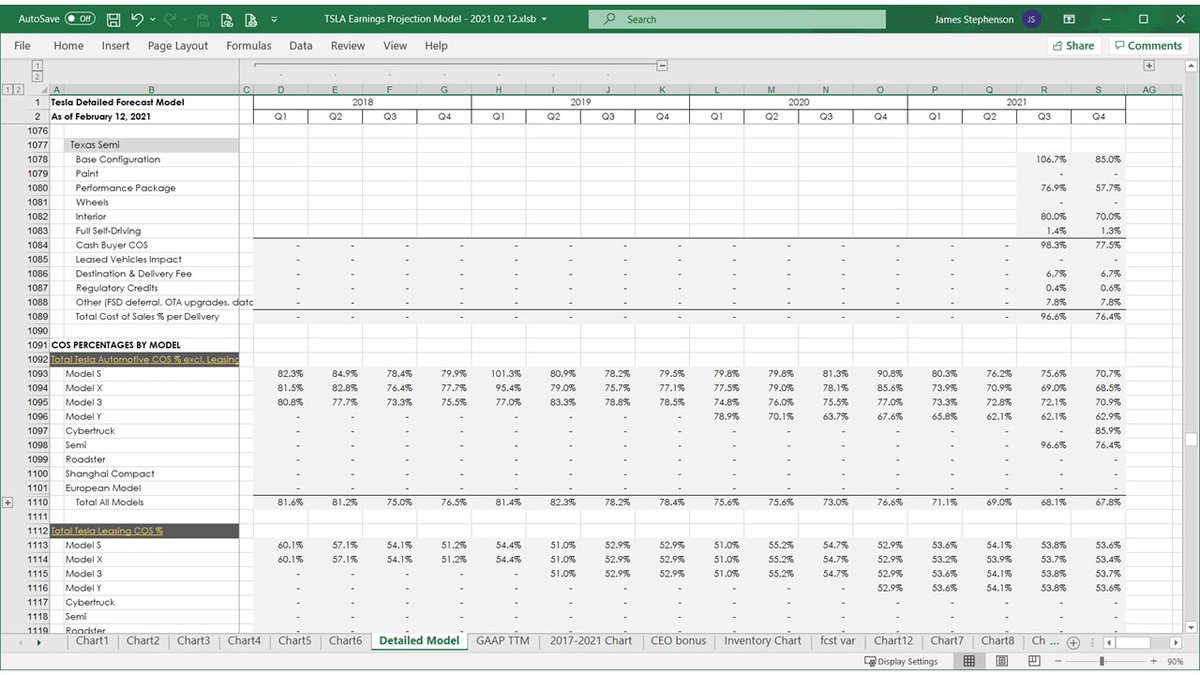
Wrapping up the COS % section, here are Tesla Energy and Services & Other.
55 of 69
55 of 69
Getting towards the end of my detailed model now.
Here begins section 5: the Income Statement detail section.
These are in the same format as the quarterly investor deck's Income Statement.
56 of 69
Here begins section 5: the Income Statement detail section.
These are in the same format as the quarterly investor deck's Income Statement.
56 of 69
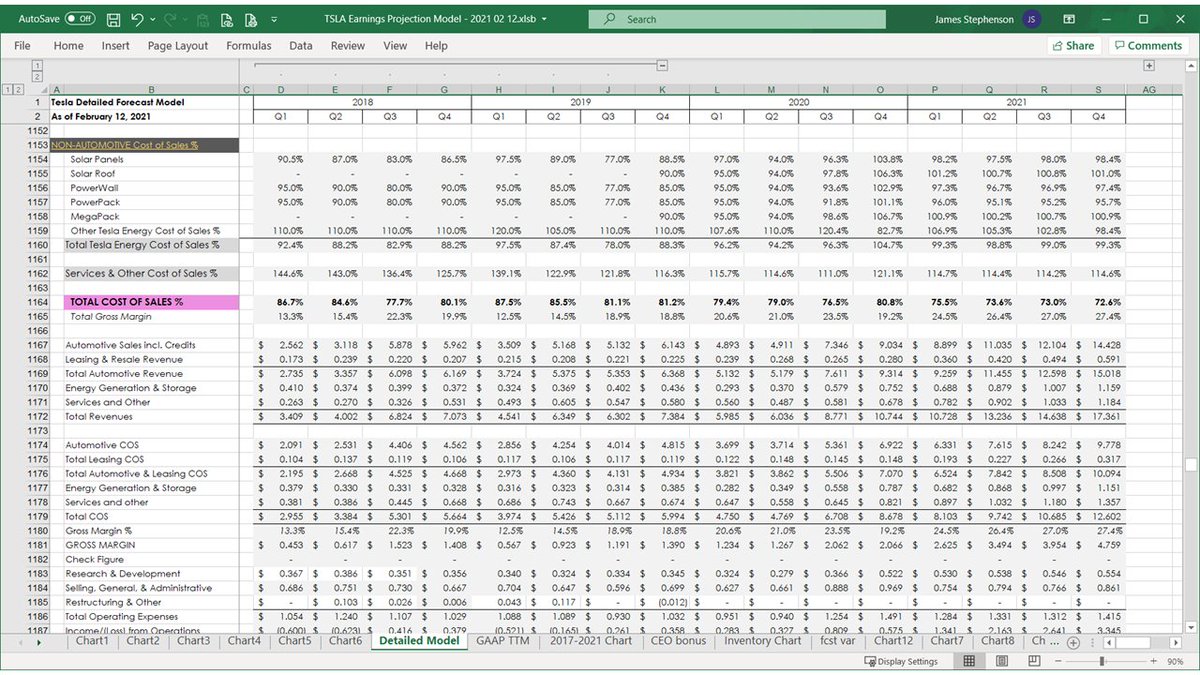
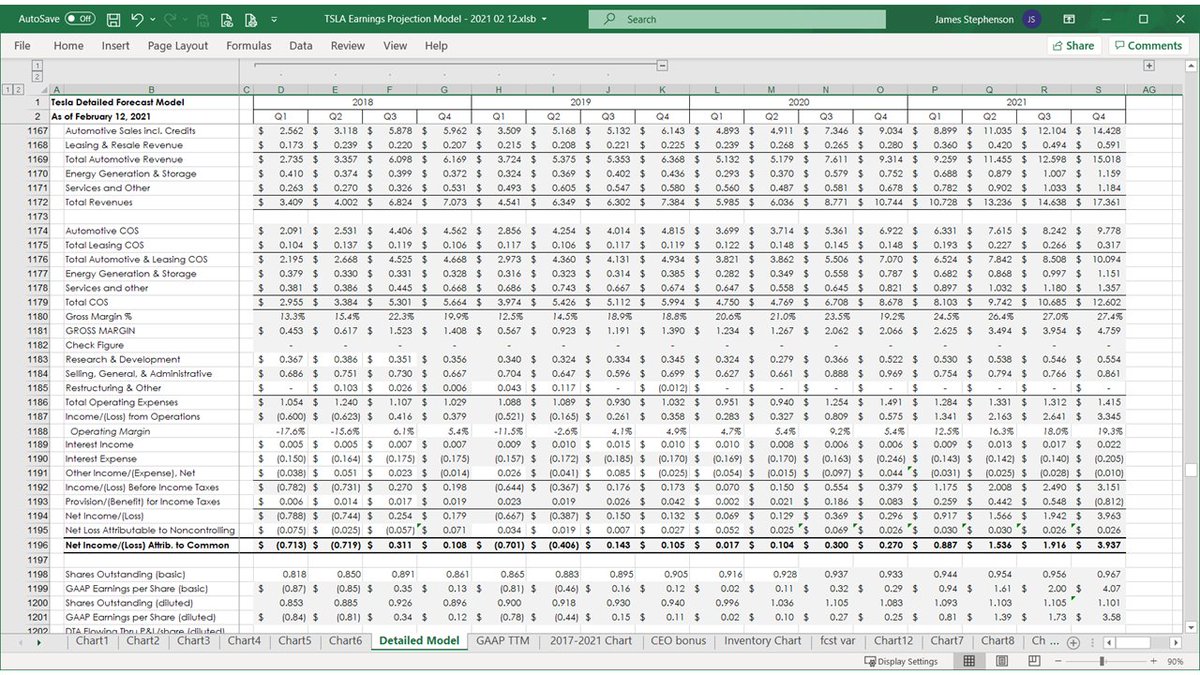
All of those detailed calculations above were ultimately to fill in the top half of this page: the P&L down to the Gross Margin line.
The bottom-line number in bold here is GAAP Net Income. Mind the GAAP.
57 of 69
The bottom-line number in bold here is GAAP Net Income. Mind the GAAP.
57 of 69
Here's a section reconciling GAAP to non-GAAP Net Income, share, share price, market cap, and earnings per share metrics, and some 2018 CEO Performance Award goals, milestones, and other metrics coming from a more detailed worksheet you'll see shortly.
58 of 69
58 of 69
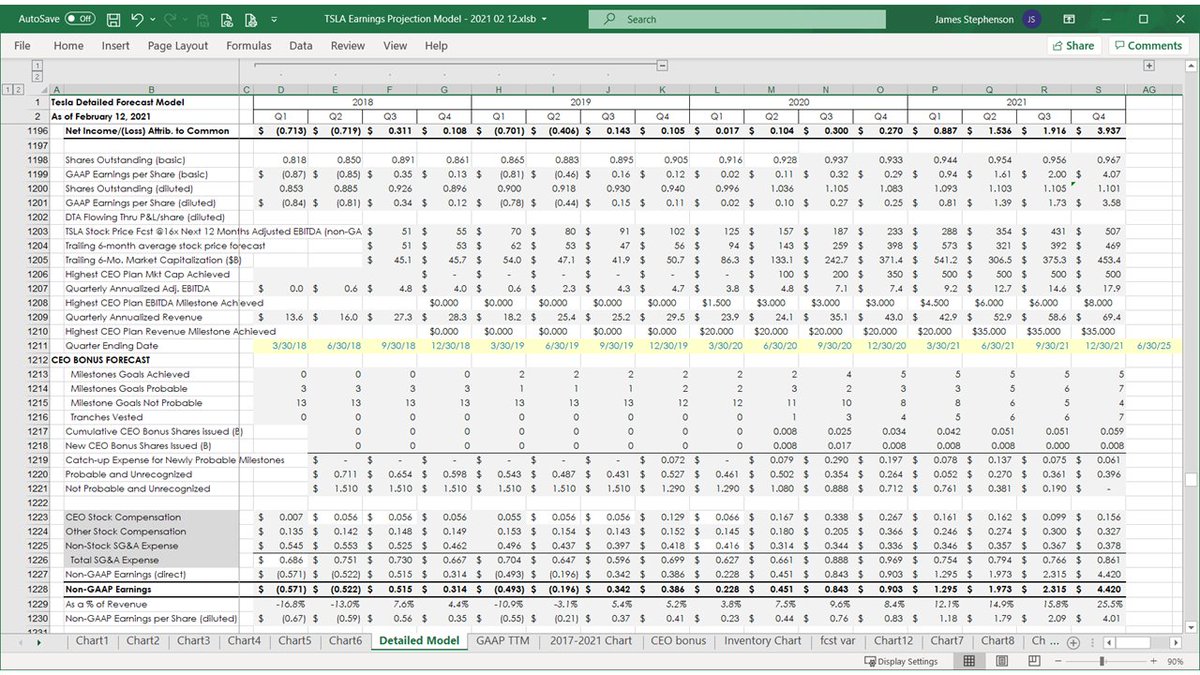
Here's a reconciliation from non-GAAP Net Income to Adjusted EBITDA, some depreciation detail, some production efficiency metrics, and even more exciting numbers! 🙃
59 of 69
59 of 69
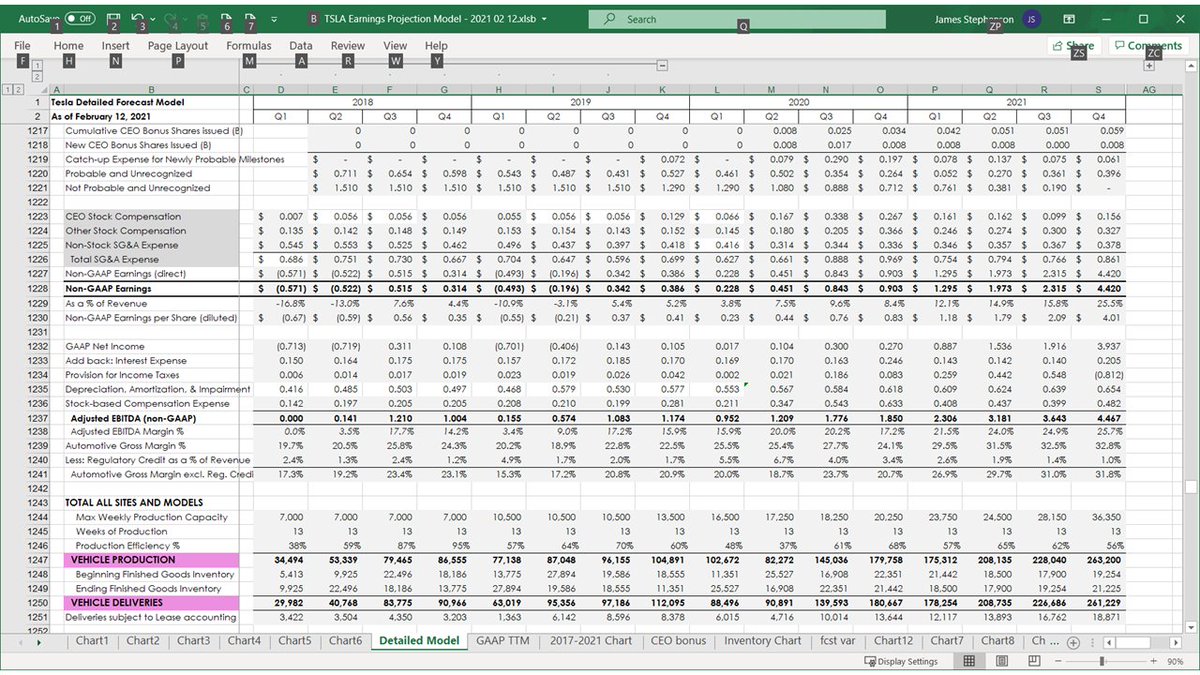
Here's a breakdown of revenue and cost of sales by option type.
60 of 69
60 of 69
Here are some COS %'s by option type, revenue per delivery, cost per delivery, and revenue per diluted share metrics.
61 of 69
61 of 69
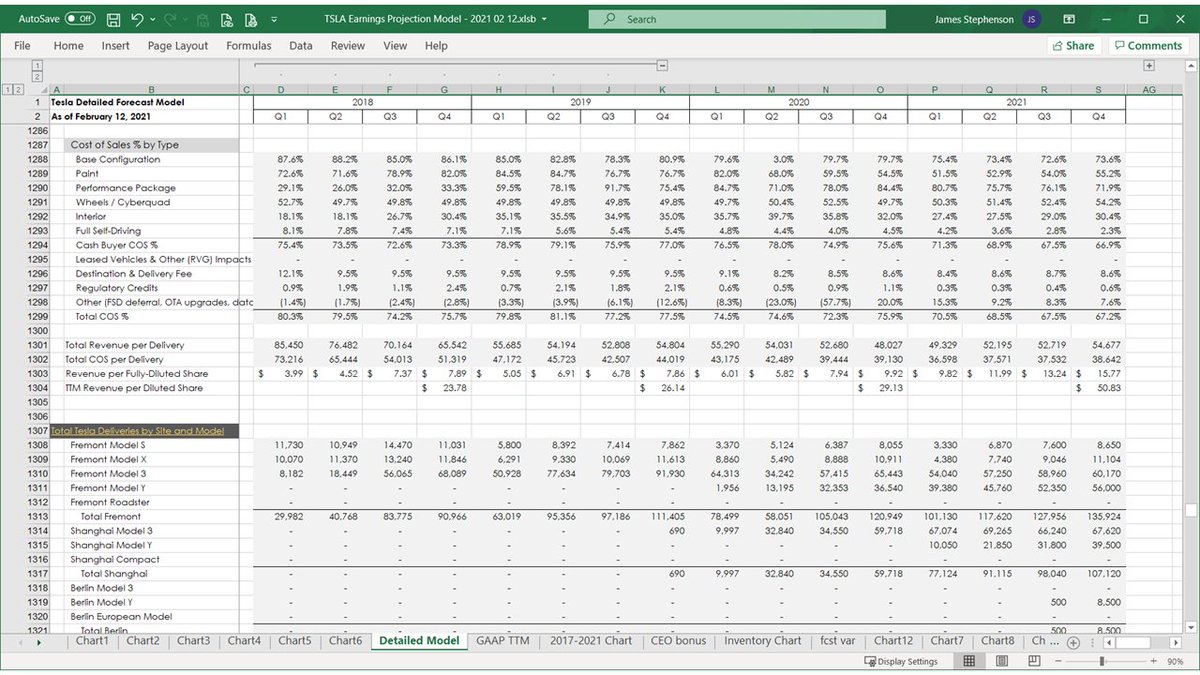
Here are some delivery tables by model, by site... and then just by model (combining global deliveries for Model 3, Model Y, etc.).
62 of 69
62 of 69
Here's total automotive revenue by model and by option.
There's also a row combining the 2 kinds of FSD revenue: optioned at delivery and FSD deferred (because FSD isn't feature-complete yet) & Other Revenue.
There's also TTM deliveries, revenue, and Adj. EBITDA.
63 of 69
There's also a row combining the 2 kinds of FSD revenue: optioned at delivery and FSD deferred (because FSD isn't feature-complete yet) & Other Revenue.
There's also TTM deliveries, revenue, and Adj. EBITDA.
63 of 69
These are the data tables for the charts that show where Tesla's average dollar of revenue comes from and how they spend it.
64 of 69
64 of 69
65 of 69
So ends the 'Detailed Model' tab.
Here's the first slide of the 'CEO Bonus' tab where I track and estimate how much stock-based compensation expense Tesla records each quarter.
There are 12 market cap tranches, 8 revenue milestones, and 8 Adj. EBITDA milestones.
66 of 69
Here's the first slide of the 'CEO Bonus' tab where I track and estimate how much stock-based compensation expense Tesla records each quarter.
There are 12 market cap tranches, 8 revenue milestones, and 8 Adj. EBITDA milestones.
66 of 69
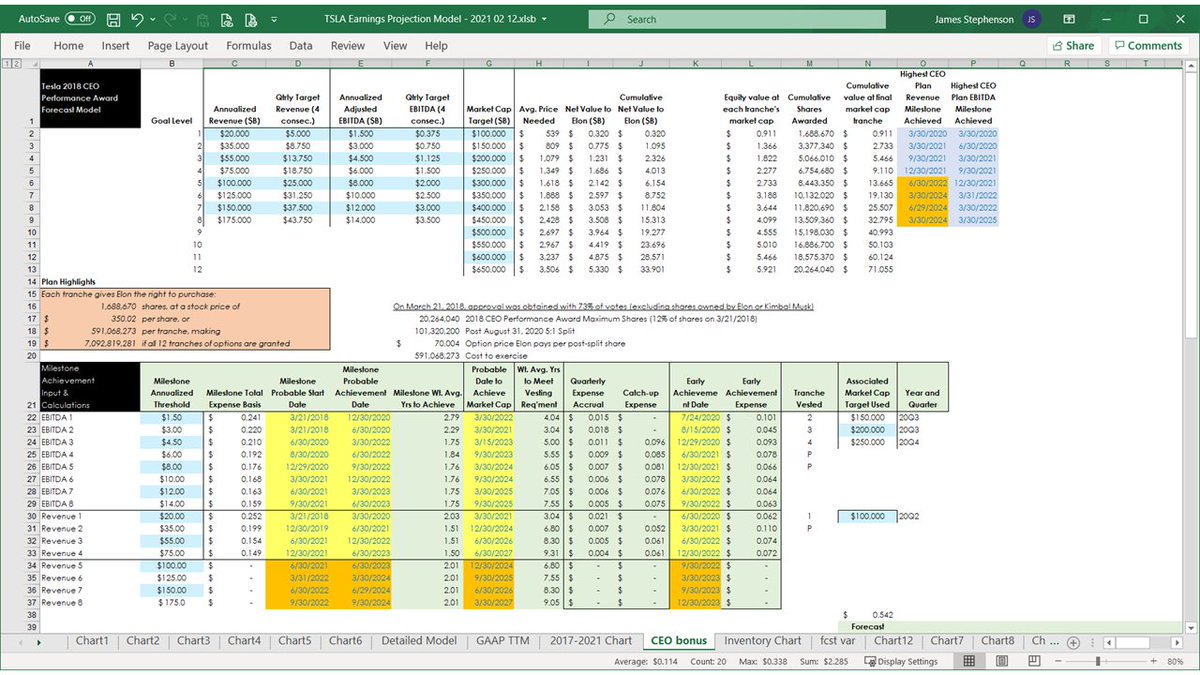
The maximum value of the stock option compensation ($2.283B) was determined at plan inception (in March 2018) and expense is recorded as performance towards achieving each of the 12 tranches is made.
That's as simply as I can explain the GAAP accounting.
67 of 69
That's as simply as I can explain the GAAP accounting.
67 of 69
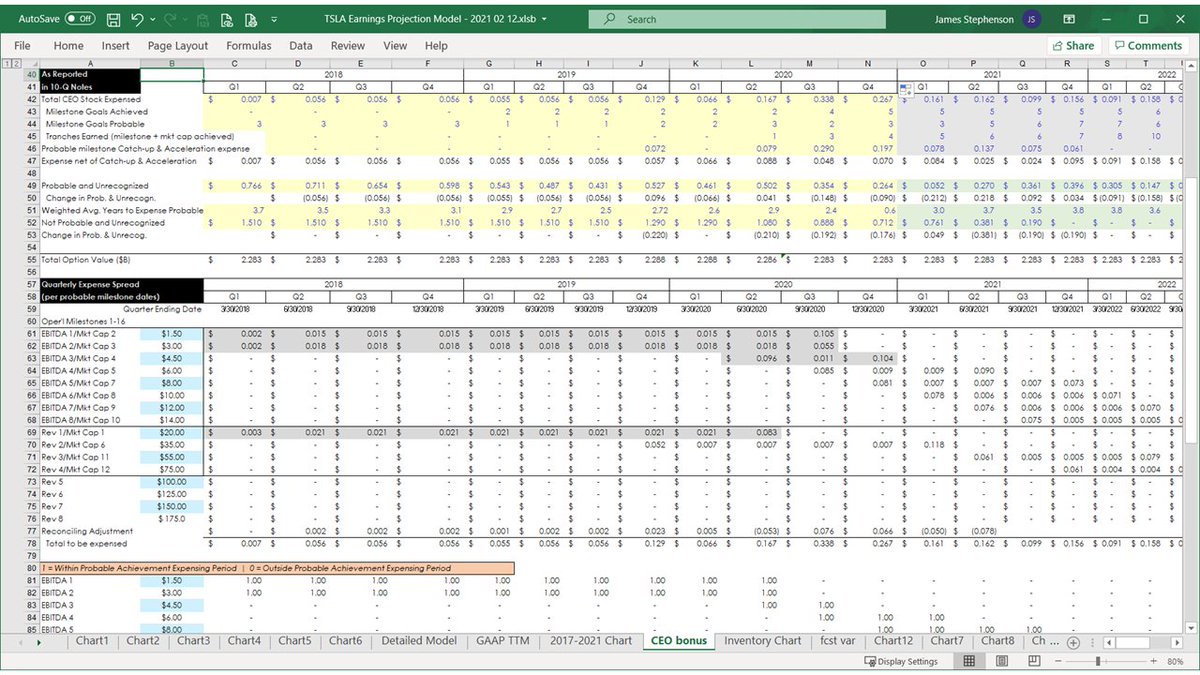
When a milestone is deemed more likely than not of being achieved, it's declared probable and catch-up expense is recorded to cover the time elapsed since the plan began.
When tranches are achieved early, all remaining expense for that tranche is accelerated.
68 of 69
When tranches are achieved early, all remaining expense for that tranche is accelerated.
68 of 69
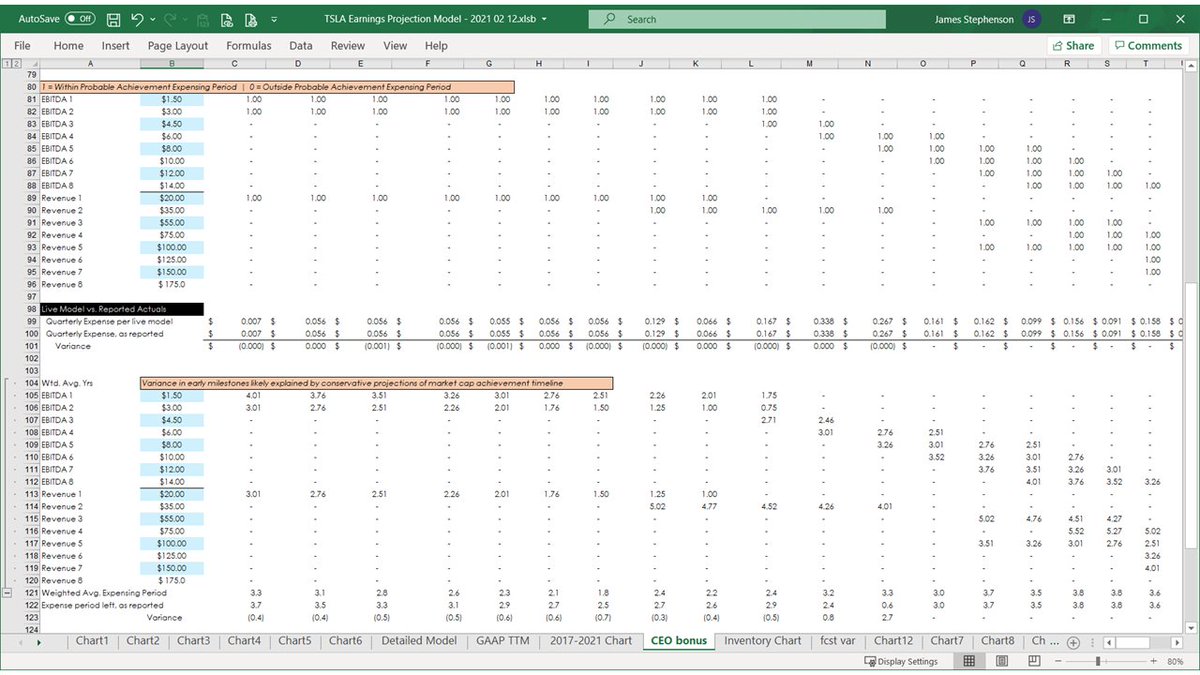
I finally took it easy on you with a half empty slide to wrap up the 'CEO Bonus' tab.
Well, this was fun.
You made it to the end: give yourself a round of applause! 😂🤣
69 of 69
Well, this was fun.
You made it to the end: give yourself a round of applause! 😂🤣
69 of 69

• • •
Missing some Tweet in this thread? You can try to
force a refresh