Latest Test and Trace data now out. Covers to 3rd Feb.
Some useful separation of LFD and PCR tests, and new data on end-to-end contact tracing.
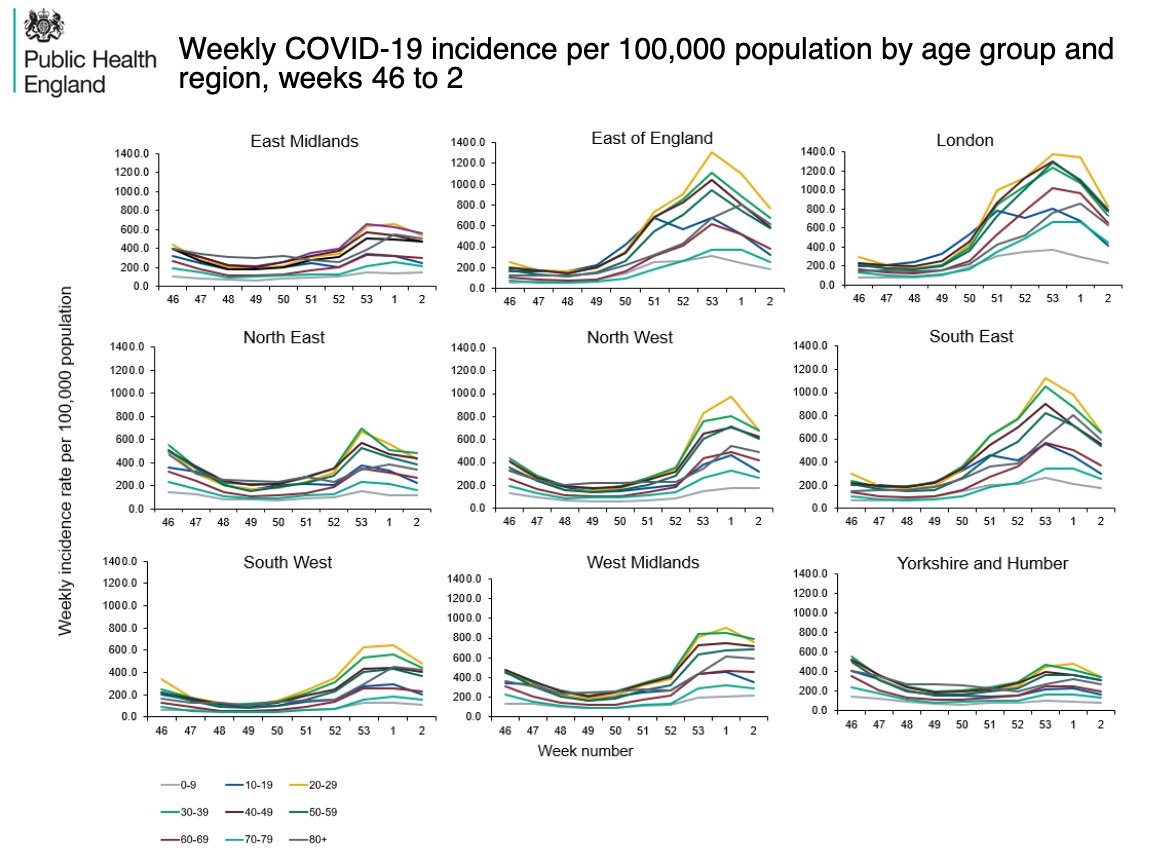
Summary in figure,🧵for the detail.
gov.uk/government/pub…
Some useful separation of LFD and PCR tests, and new data on end-to-end contact tracing.
Summary in figure,🧵for the detail.
gov.uk/government/pub…

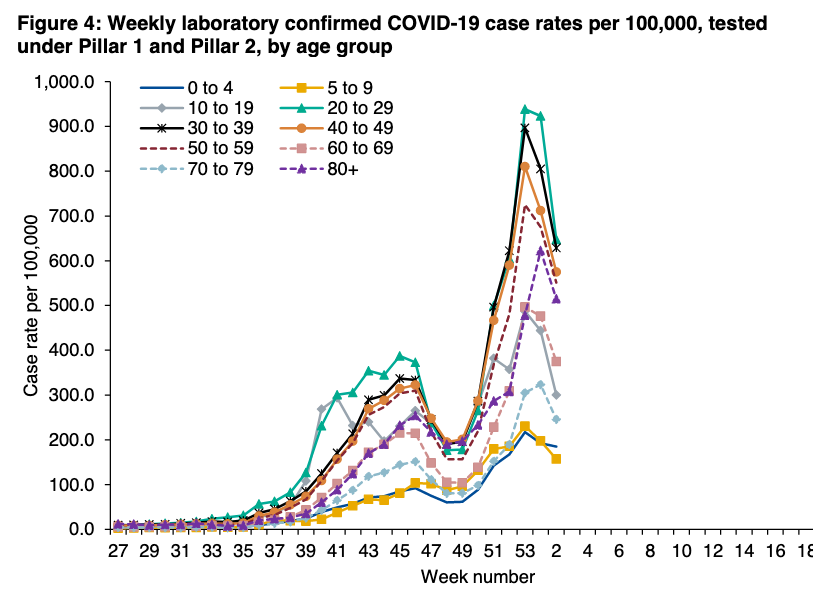
As case rates fall across the country, the number of people being tested is up 7% of last week to over 3m for the first time.
Over 5% of the population.
Over 5% of the population.

And as you can see from PHE data to 7th Feb - the increase is from the use of lateral flow devices (LFDs) to find cases among people without symptoms.
The number of people tested using PCR tests each week (and the proportion coming back positive - positivity) is still falling.
The number of people tested using PCR tests each week (and the proportion coming back positive - positivity) is still falling.

Rise in people using LFDs is because of LFD role out in local authority-led community testing & some workplaces where people who still need to go in to work (teachers, HCWs, emergency staff, etc).
And because people often take >1 test/wk, the rise in LFDs used is dramatic.
And because people often take >1 test/wk, the rise in LFDs used is dramatic.

This rise varies by region, but as more and more local authorities get started with community testing, and as people start going back to work, there are very significant increases in LFD use still to come.

It will be v important to track how LFD use varies among different populations, particularly more deprived/vulnerable popn groups.
Case finding is helpful, but as LFD use increases it must be voluntary and policies must protect the most vulnerable from job loss/other harms.
Case finding is helpful, but as LFD use increases it must be voluntary and policies must protect the most vulnerable from job loss/other harms.
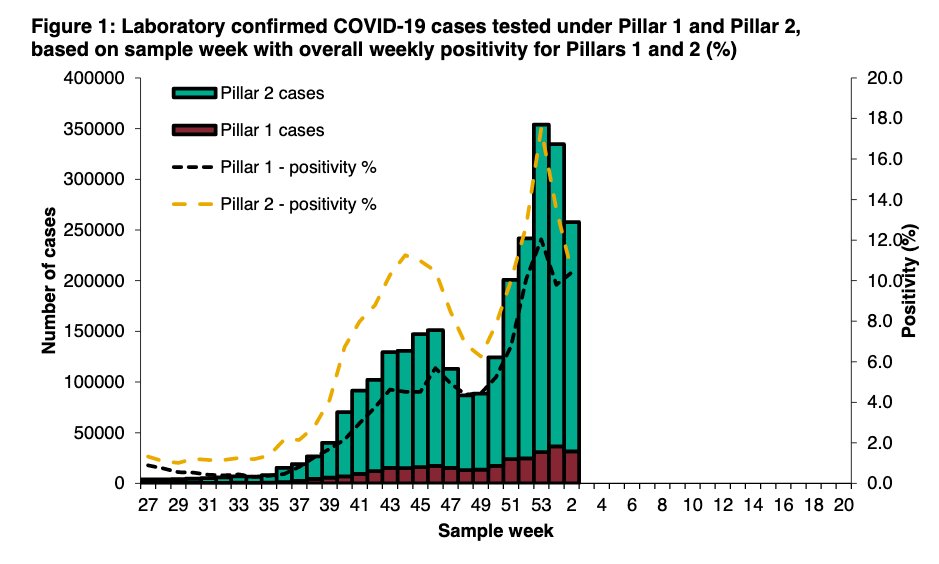
Back to T&T data. Cases down 25% to 149k, as reflected in PHE data also published on Thursday.


Thread on PHE COVID surveillance report here.
https://twitter.com/ADMBriggs/status/1359901341586518020?s=20
The time to result continues to improve, with 86% of in-person test results received within 24 hours (compare this to the average since T&T launched of 40-50%).


Of the 149k handled by T&T, 130k were reached (87%) and 17k weren't reached.
Around 95% of cases were handled by the national T&T team (with local authorities), and 5% - or 6,317 cases - by local PHE Health Protection Teams. These are the more complex/high risk cases & settings.
Around 95% of cases were handled by the national T&T team (with local authorities), and 5% - or 6,317 cases - by local PHE Health Protection Teams. These are the more complex/high risk cases & settings.


74% of people gave details of contacts.
This means that 33,344 people 'were not able to give any recent close contacts'. This is far too high and remains an ongoing challenge for T&T.
This means that 33,344 people 'were not able to give any recent close contacts'. This is far too high and remains an ongoing challenge for T&T.

There's also new data this week showing number of contacts reached for cases with or without symptoms.
Cases with symptoms have nearly double the avg number of contacts reached.
Cases with symptoms have nearly double the avg number of contacts reached.

This is interesting - may have expected the opposite relationship (people w/o symptoms more likely to be going about their daily business and more contacts).
This is contacts reached, not total contacts & don't know number cases reporting no contacts, but interesting nonetheless
This is contacts reached, not total contacts & don't know number cases reporting no contacts, but interesting nonetheless
Of the 96.5k cases giving details of close contacts, 264,577 were identified. 98% of these were handled by the national T&T team.

For cases handled by T&T, the average number of contacts per case was 2.1 (median 2.0). Same as previous weeks.
For the 6,317 cases handled by PHE Health Protection teams, the median contacts per HPT case was 31 (up from 25). This increase is likely due to large-scale testing around variants of concern.
The proportion of contacts reached and told to self isolate hasn't changed. 93% for cases managed by T&T and 94% overall.

But the percentage of contacts reached within 24hrs of when a case was passed to T&T has fallen slightly.
This is due to a two weeks in a row drop in percentage of cases reached within 24hrs.
This is due to a two weeks in a row drop in percentage of cases reached within 24hrs.


It isn't a huge drop but it might be significant and is definitely worth keeping a close eye as it's happening when case numbers fall rather than increase.
It also has an impact on local authority systems that generally take cases that aren't reached within 24hrs.
It also has an impact on local authority systems that generally take cases that aren't reached within 24hrs.
Finally, two very welcome new charts this week showing more of the end-to-end journey.
-90% of contacts are reached within 3 days of the case taking a test, and
-median time from case developing symptoms to contact isolating is 78hrs.
-90% of contacts are reached within 3 days of the case taking a test, and
-median time from case developing symptoms to contact isolating is 78hrs.


Both are as good as they've ever been (which is great). And both can still be better.
Anything that shrinks the overall time will help to limit disease spread.
Anything that shrinks the overall time will help to limit disease spread.
Finally, there are still a lot people not getting tested, and many who struggle to isolate.
Increased isolation support needs to be introduced alongside any wider roll-out of asymptomatic testing options.
Increased isolation support needs to be introduced alongside any wider roll-out of asymptomatic testing options.
Wk 36 T&T @felly500 @trishgreenhalgh @deb_cohen @martinmckee @carolecadwalla @mgtmccartney @ADPHUK
@Jeanelleuk @fascinatorfun @profchrisham @petermbenglish
@HPIAndyCowper @Davewwest @HSJEditor @KateAlvanley
@IndependentSage @nedwards_1 @chrischirp @SamanthaJonesUK
@Jeanelleuk @fascinatorfun @profchrisham @petermbenglish
@HPIAndyCowper @Davewwest @HSJEditor @KateAlvanley
@IndependentSage @nedwards_1 @chrischirp @SamanthaJonesUK
@ewanbirney @TimHarford @devisridhar @FurberA @andrewleedr @kieran_walshe @DrChadborn @Dr_D_Robertson
• • •
Missing some Tweet in this thread? You can try to
force a refresh