
Most recent T&T data now out, covers 4th - 10th Feb
LFD use continues to rise but more slowly than last week and T&T performance remains consistent.
And as ever we don't know about who isn't tested and who struggles to isolate.
🧵
gov.uk/government/pub…
LFD use continues to rise but more slowly than last week and T&T performance remains consistent.
And as ever we don't know about who isn't tested and who struggles to isolate.
🧵
gov.uk/government/pub…

The number of people being tested each week remains high at around 3m, but this is due to increasing use of rapid lateral flow devices as PCR test use falls.
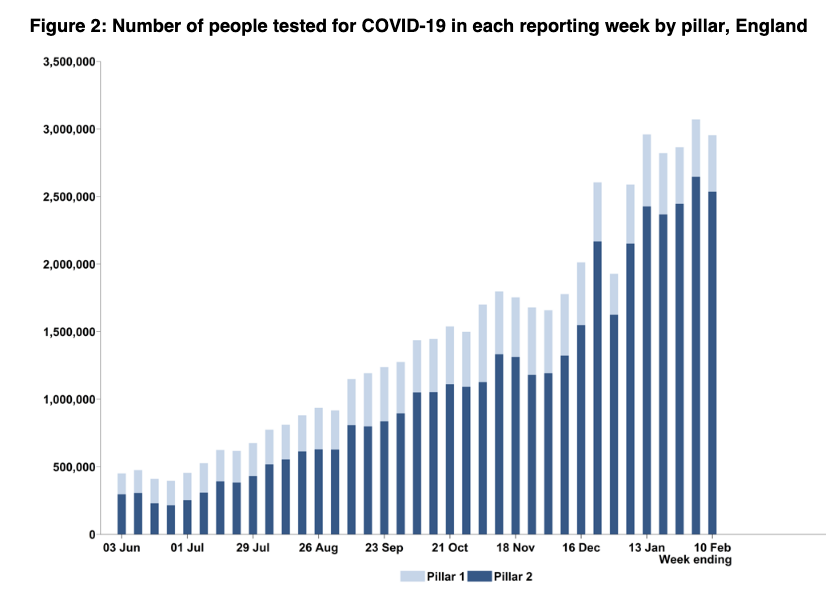
The number of LFDs used has increased five-fold since the start of Jan, and 35% in the past two weeks (although noticeable slowdown this most recent week).
By contrast, PCR test use for people with symptoms fallen week on week for the past month (PHE positivity data due later).
By contrast, PCR test use for people with symptoms fallen week on week for the past month (PHE positivity data due later).

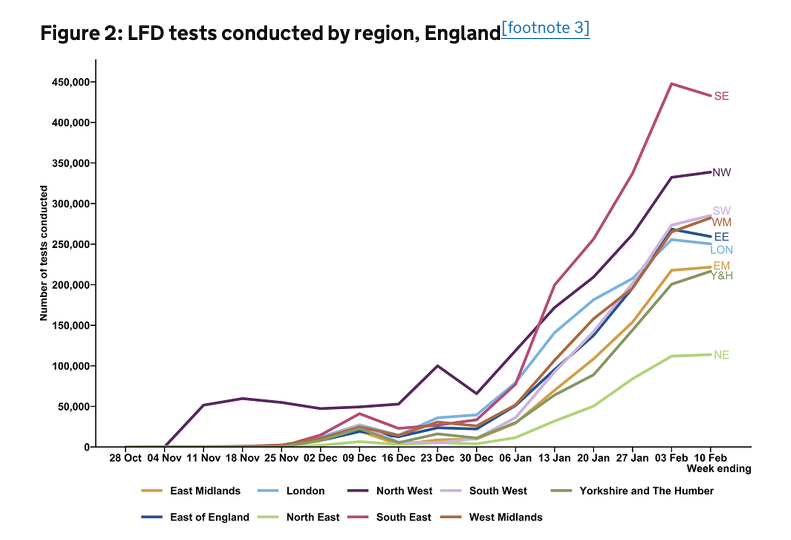
LFDs are generally used by people without symptoms to find cases that might otherwise unknowingly transmit disease. Current use focuses in places like schools, health and care, some workplaces, and community testing sites run by local gov for people who can't work from home.
There's definite variation in their use across the country (but note chart isn't pop adjusted) and as mentioned last week, will need to keep close eye on how use varies, particularly among more vulnerable and deprived groups.
Need to mitigate any unintended harm, esp around jobs
Need to mitigate any unintended harm, esp around jobs
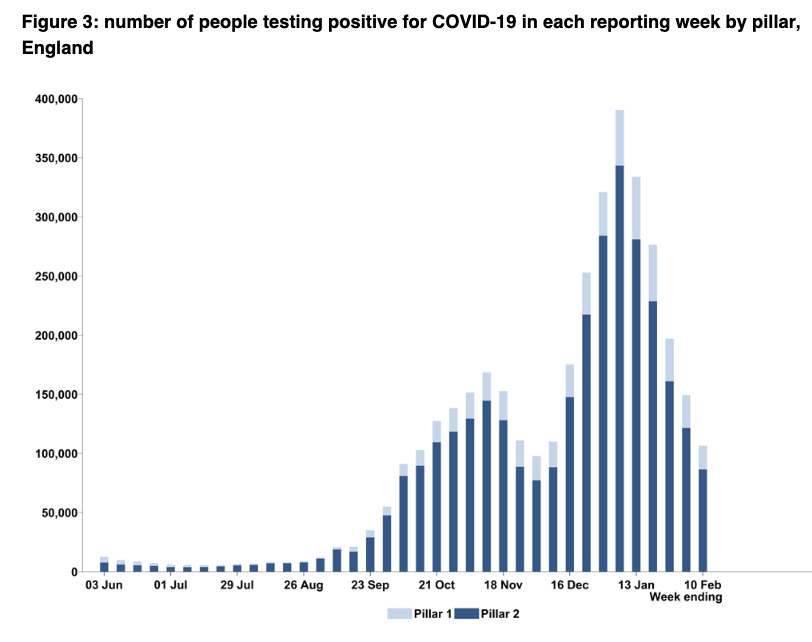
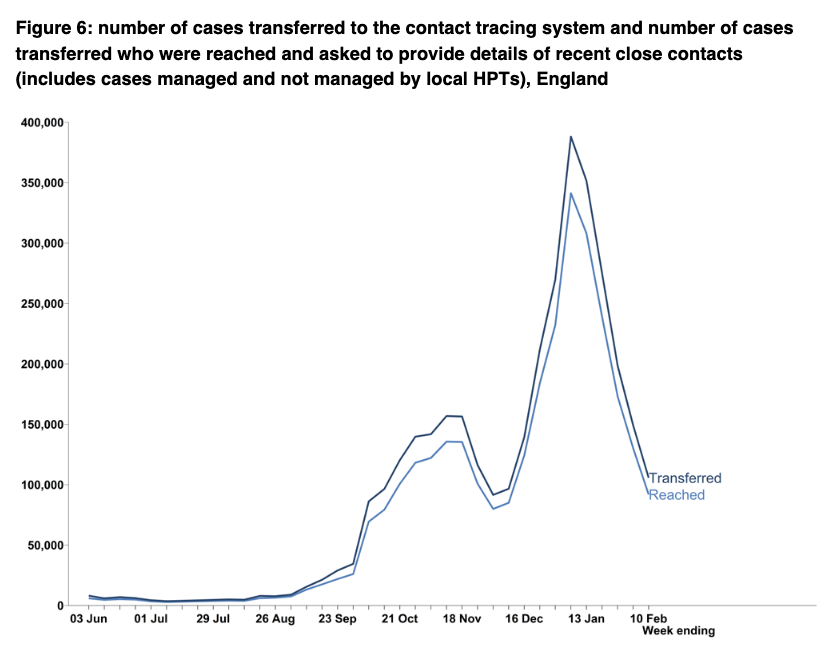
The number of people testing positive is falling as we know, meaning around 30% fewer transferred to T&T this week compared with last week.
That's 106k cases.
That's 106k cases.
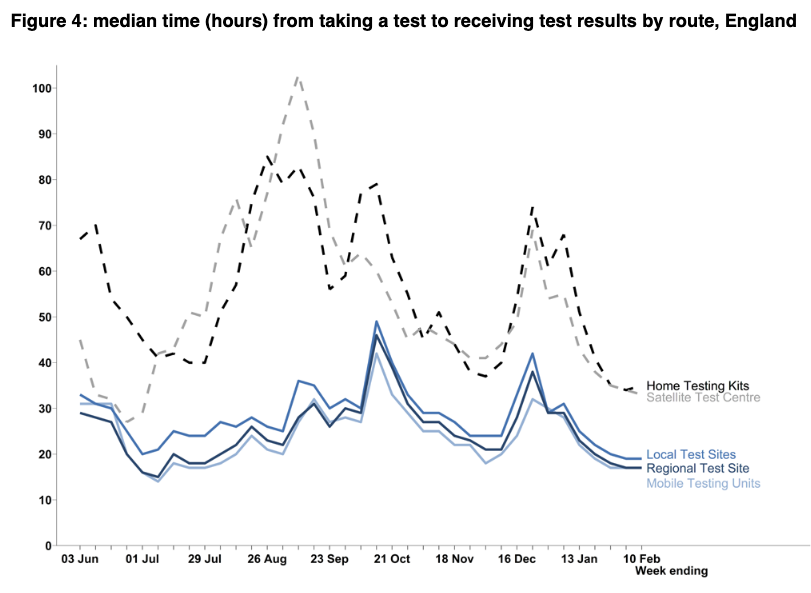
Test turnaround time is consistently as fast as it's ever been, with 85% of in person PCR test results received within 24 hours.

Of the 106k cases transferred, 92k were reached (87% of those handled), and 68k (74%) gave details of contacts.
Both these percentages are similar to previous weeks.
Both these percentages are similar to previous weeks.


There were 191,242 contacts identified, or 2.1 contacts per case (although for the 5,344 cases handled by PHE health protection teams, the median number of contacts per case was 25 - largely due to management of variants of concern).
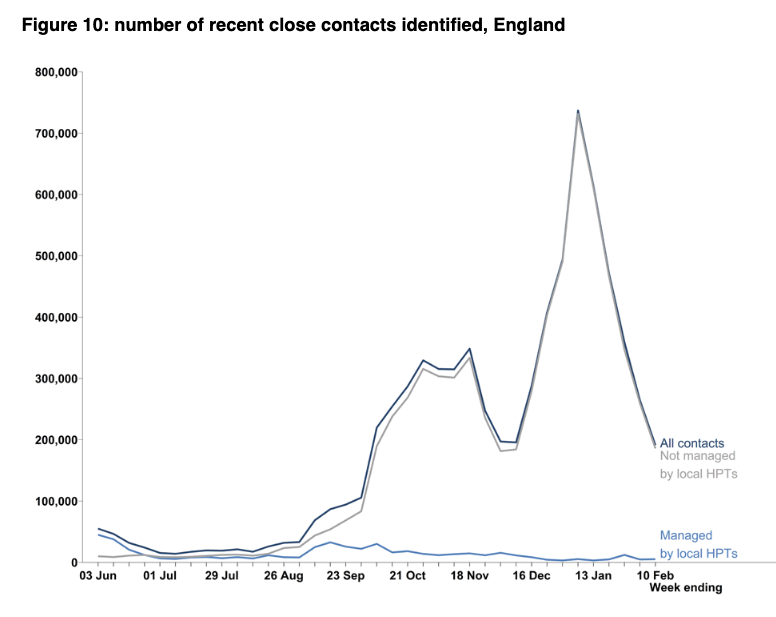
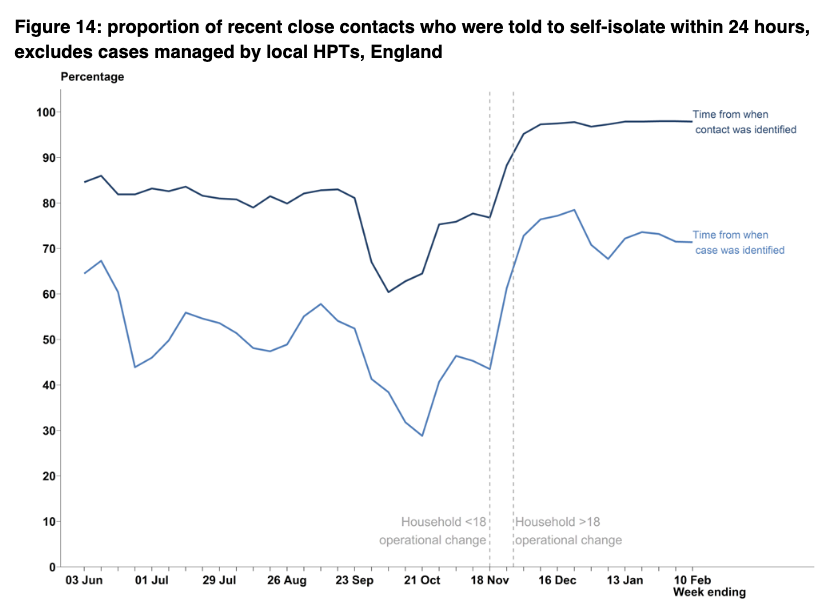
94% of contacts were reached.
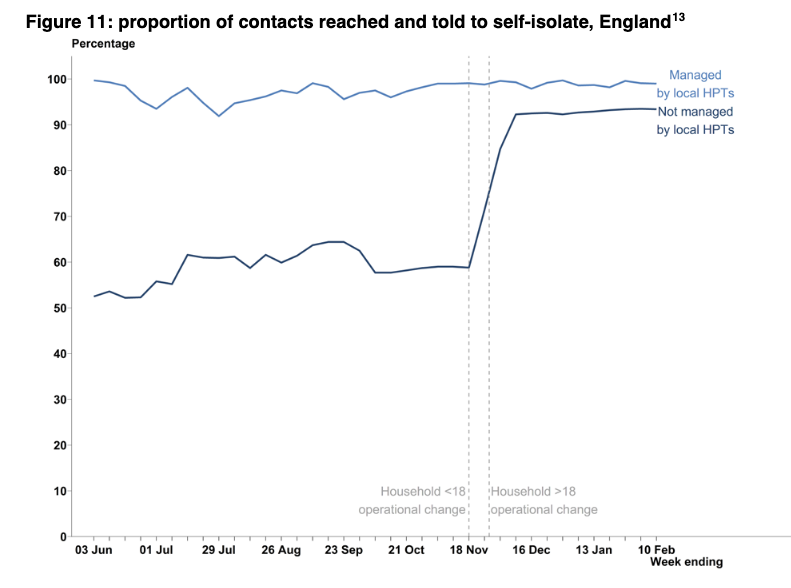
Worth noting that given lockdown, 87% of identified contacts were household contacts of which 97% were reached, this compares with 71% of non-household contacts.
These percentages reached have all been similar since start of Dec.
Worth noting that given lockdown, 87% of identified contacts were household contacts of which 97% were reached, this compares with 71% of non-household contacts.
These percentages reached have all been similar since start of Dec.

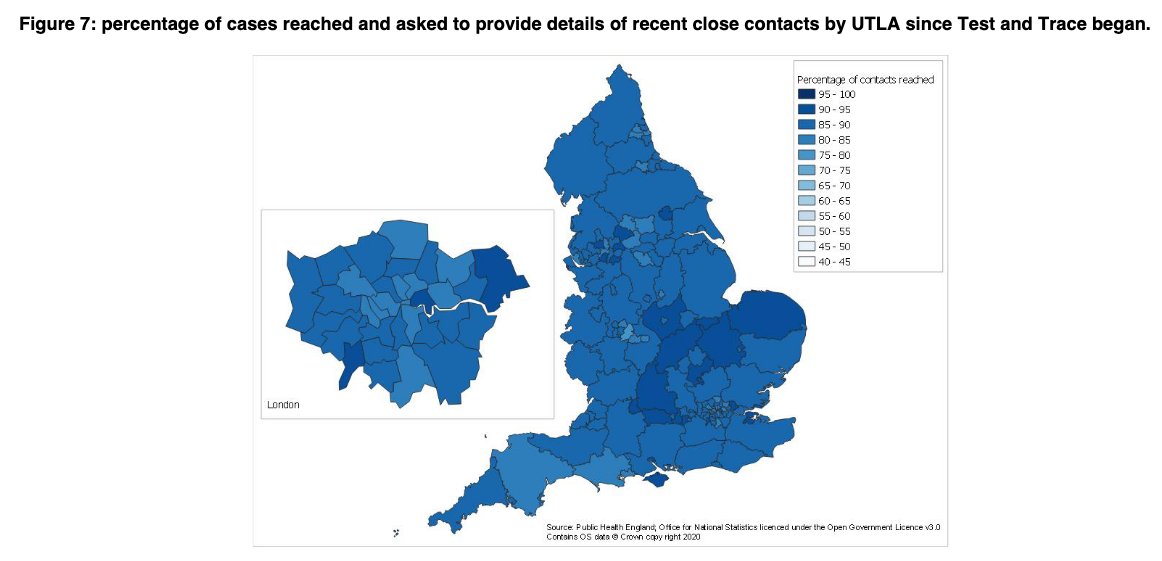
And there are ongoing differences by local authority which have highlighted before and still need more detailed explanation.

The national data also doesn't report the impact of local contact tracing teams on overall T&T performance.
Local teams generally pick up cases that can't be reached by the national team within 24hrs and their role may become ever more important as case numbers fall.
Local teams generally pick up cases that can't be reached by the national team within 24hrs and their role may become ever more important as case numbers fall.
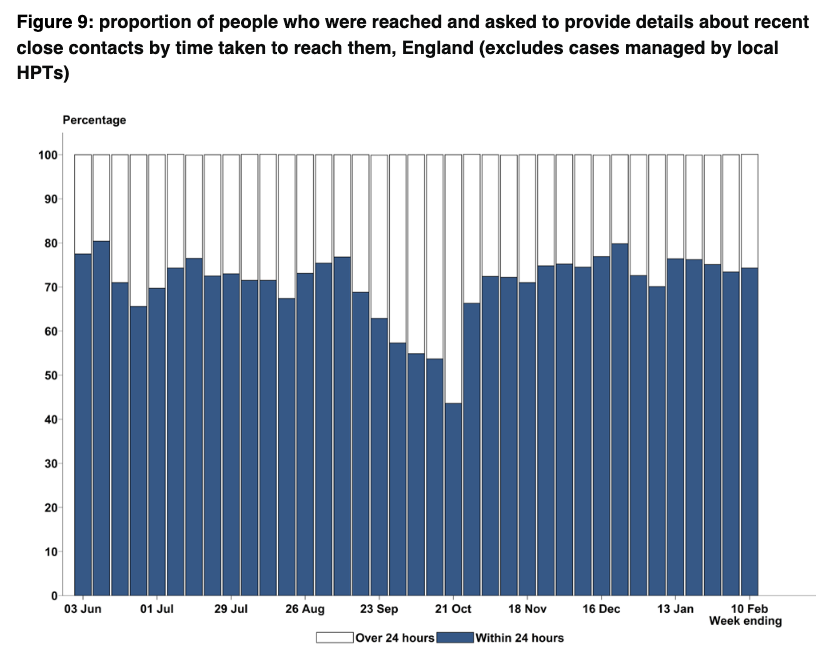
Finally, end-to-end time is consistently as good as it's ever been.
Room for improvement but definitely not getting worse.
Room for improvement but definitely not getting worse.


And as with every week, these data don’t tell us about people who don’t get tested despite symptoms and who don't always isolate.
Everyone needs to be confident they will have the support needed if testing positive, and that their job – however insecure – will not be put at risk.
Everyone needs to be confident they will have the support needed if testing positive, and that their job – however insecure – will not be put at risk.
We'll update our @HealthFdn T&T performance tracker with @cfraserepi later this afternoon with these data.
Wk 3 T&T @felly500 @trishgreenhalgh @deb_cohen @martinmckee @carolecadwalla @mgtmccartney @ADPHUK
@Jeanelleuk @fascinatorfun @profchrisham @petermbenglish
@HPIAndyCowper @Davewwest @HSJEditor @KateAlvanley
@IndependentSage @nedwards_1 @chrischirp @SamanthaJonesUK
@Jeanelleuk @fascinatorfun @profchrisham @petermbenglish
@HPIAndyCowper @Davewwest @HSJEditor @KateAlvanley
@IndependentSage @nedwards_1 @chrischirp @SamanthaJonesUK
@ewanbirney @TimHarford @devisridhar @FurberA @andrewleedr @kieran_walshe @DrChadborn @Dr_D_Robertson
And pls say if you'd rather not be tagged in these threads each week.
And pls say if you'd rather not be tagged in these threads each week.
• • •
Missing some Tweet in this thread? You can try to
force a refresh


