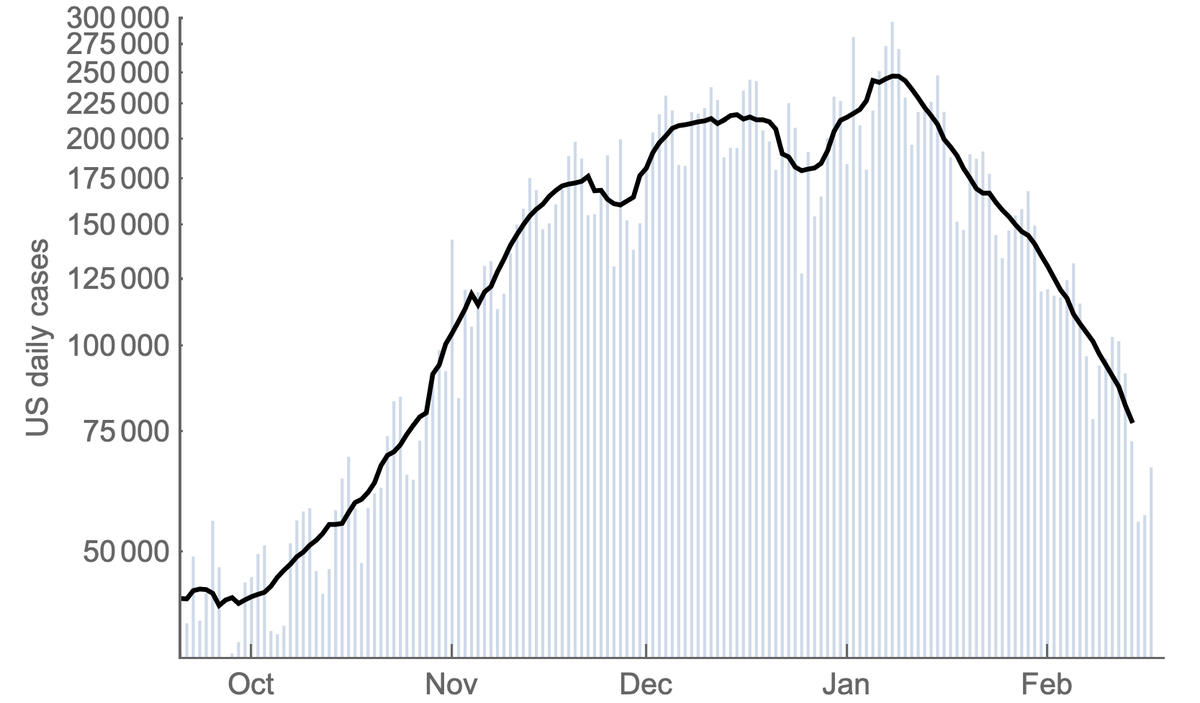
After a ~2 month plateau from mid-Nov to mid-Jan, the US #COVID19 epidemic has undergone a steady week after week decline and is now back to daily case counts last seen in late October. A thread on what we might expect going forwards. 1/13
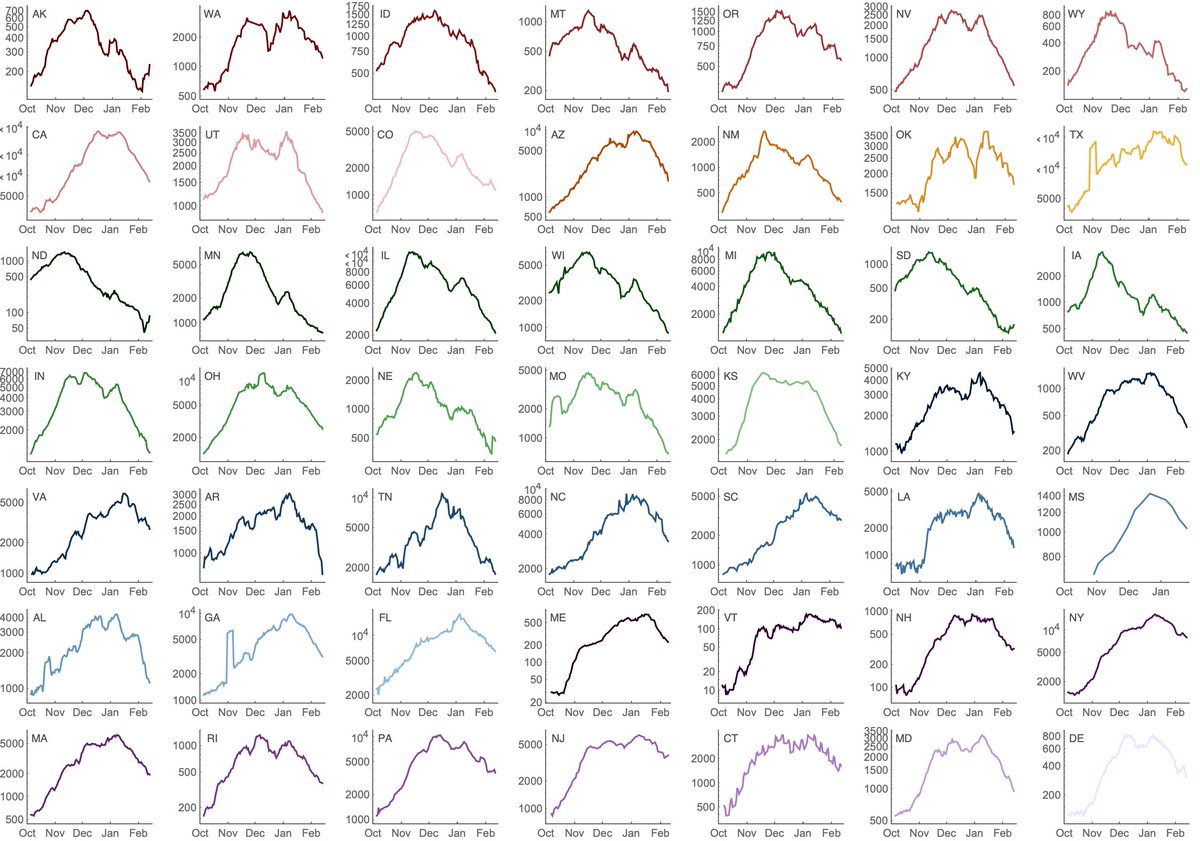
Working with case counts from @COVID19Tracking and Rt estimates from epiforecasts.io, I'm showing US confirmed cases broken out by state alongside transmission rate as measured by Rt through time. 2/13
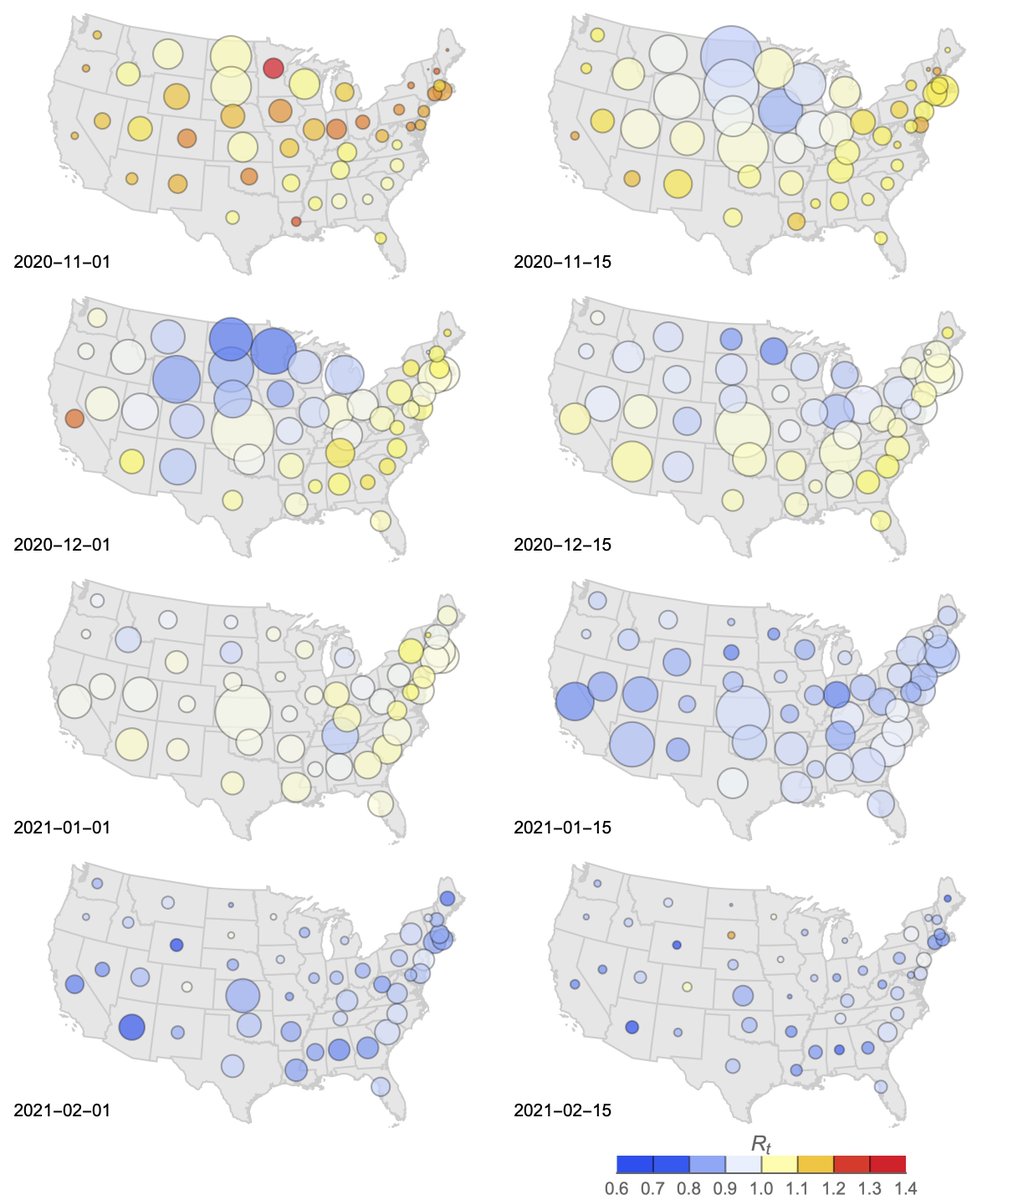
Generally, Rt > 1 in Nov and Dec corresponding to rising cases and drops below 1 in Jan corresponding to falling cases. We've seen a steady decline in Rt from Nov to Feb. Thus, current decline is not a sudden shift in circumstance, but resulted from reaching Rt < 1. 3/13
The US fall/winter epidemic is illustrated here as a series of twice monthly snapshots with bubble size representing per-capita case counts in a state and bubble color representing Rt, where red indicates growing epidemics and blue represents declining epidemics. 4/13
This shows "inflation" in Nov and Dec followed by "deflation" starting mid-Jan. The Dakotas and surroundings show a similar trajectory to other states, but were ahead of the curve with an epidemic peak in Nov. 5/13
Solely based on continued improvements to seasonality and continued increase in population immunity due to natural infection and vaccination I'd expect this trend to largely continue and the US fall/winter surge to be brought further under control. 6/13
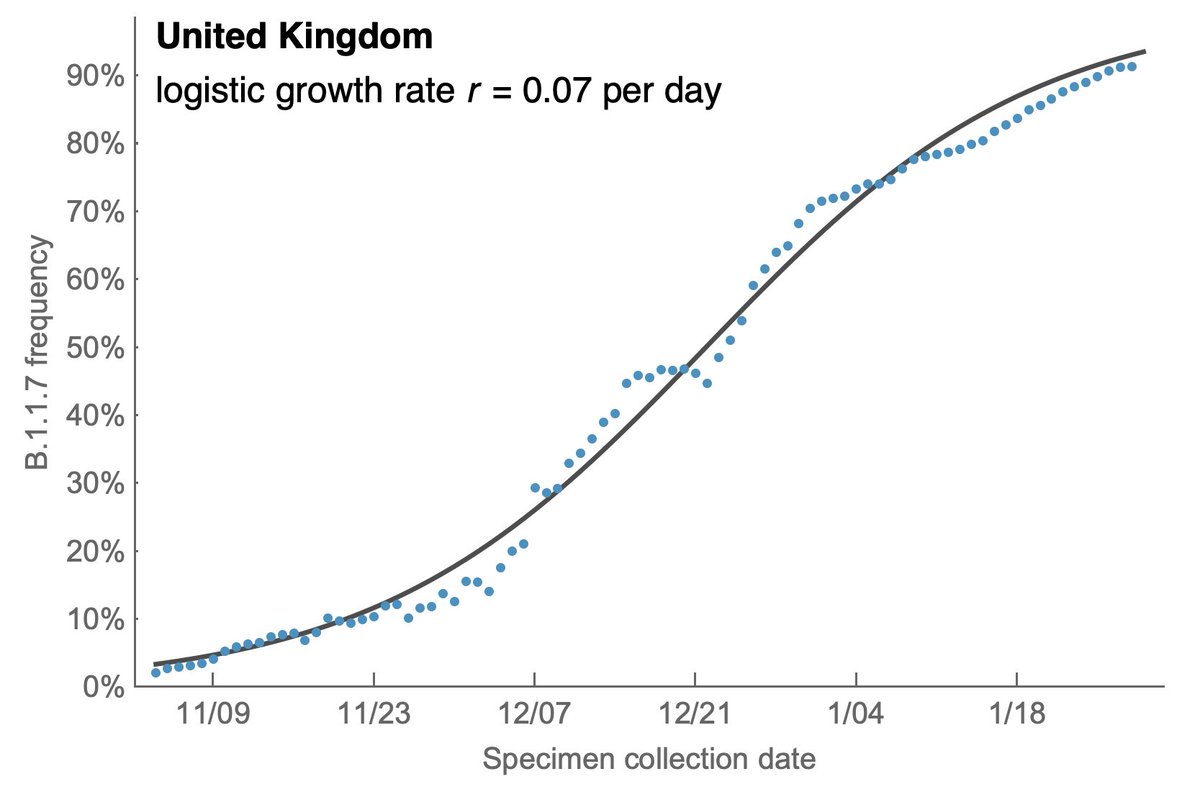
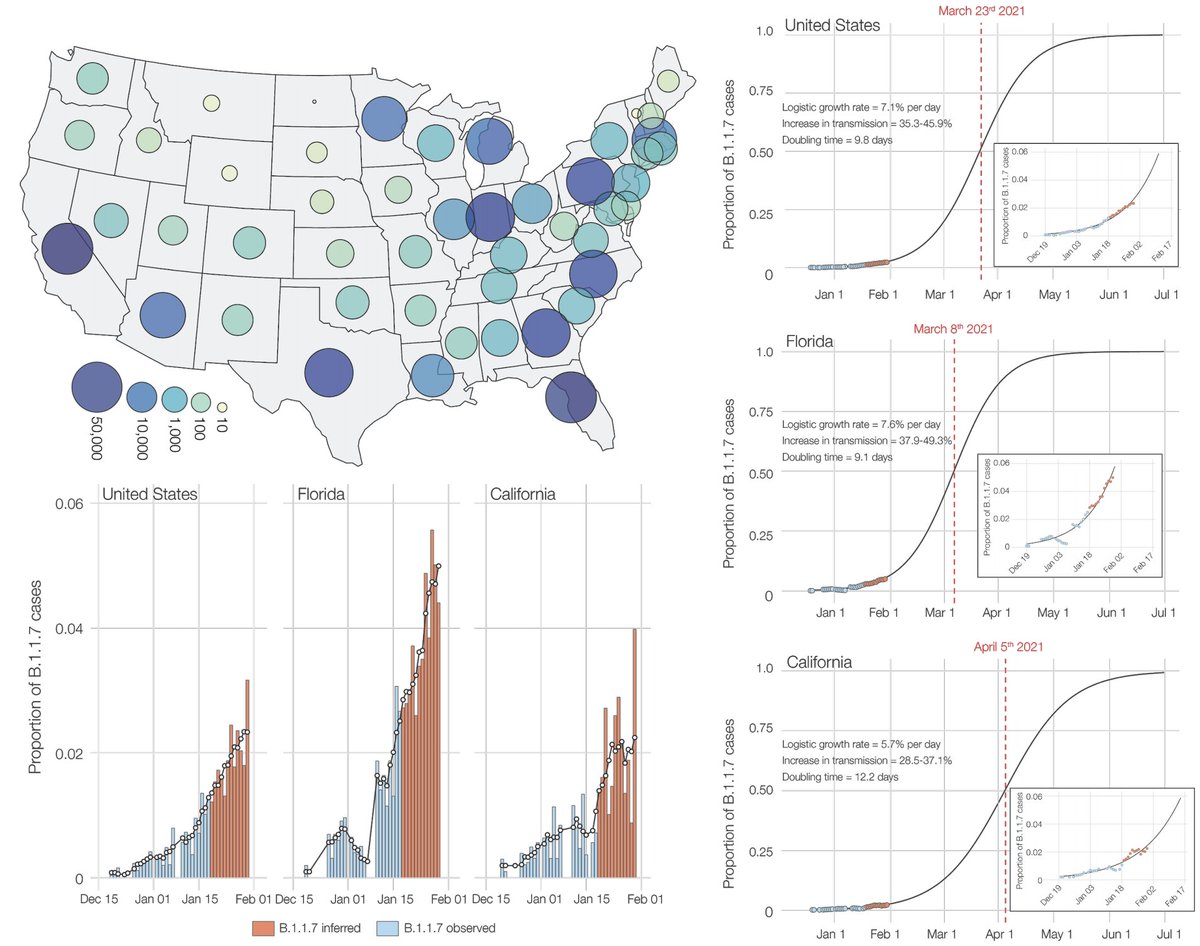
However, the rapid take-off of B.1.1.7 will push against these gains. The trajectory of B.1.1.7 in the UK decently fits a simple logistic growth model with a growth rate r of 0.07 per day as assessed using SARS-CoV-2 genome data from @GISAID. 7/13
A similar rate of growth of B.1.1.7 is observed in Denmark and Switzerland with Denmark reaching ~20% B.1.1.7 frequency and Switzerland reaching nearly 20% B.1.1.7 frequency at the end of January. 8/13
Recent work from @genesareclever, @gkay92, @K_G_Andersen and colleagues looking at B.1.1.7 in the US (medrxiv.org/content/10.110…) estimated a similar rate of frequency increase, which suggests B.1.1.7 will reach 50% frequency in the US by perhaps late March. 9/13
However, current prevalence differs across states and B.1.1.7 may become dominant in some areas of the US earlier than other areas. 10/13
It's not clear to me at this point whether biological increase in transmissibility of B.1.1.7 will "win" against further improvements to seasonality and immunity in ~6 weeks time at the end of March. 11/13
Increased transmissibility of B.1.1.7 will certainly stretch out circulation of COVID-19 and make it harder to bring under control relative to the non-B.1.1.7 scenario, but I'm not sure at this point how much of a spring B.1.1.7 wave to expect. 12/13
I do think this will become clear shortly as we observe what happens in countries like Denmark and Switzerland or states like Florida which are farther along on their B.1.1.7 trajectories relative to the US as a whole. 13/13
• • •
Missing some Tweet in this thread? You can try to
force a refresh
With emerging variants of SARS-CoV-2 and initial evidence of antigenic evolution, I've seen comparisons here to seasonal influenza and its rate of evolution. In this thread, I want to ground these comparisons with some data. 1/18
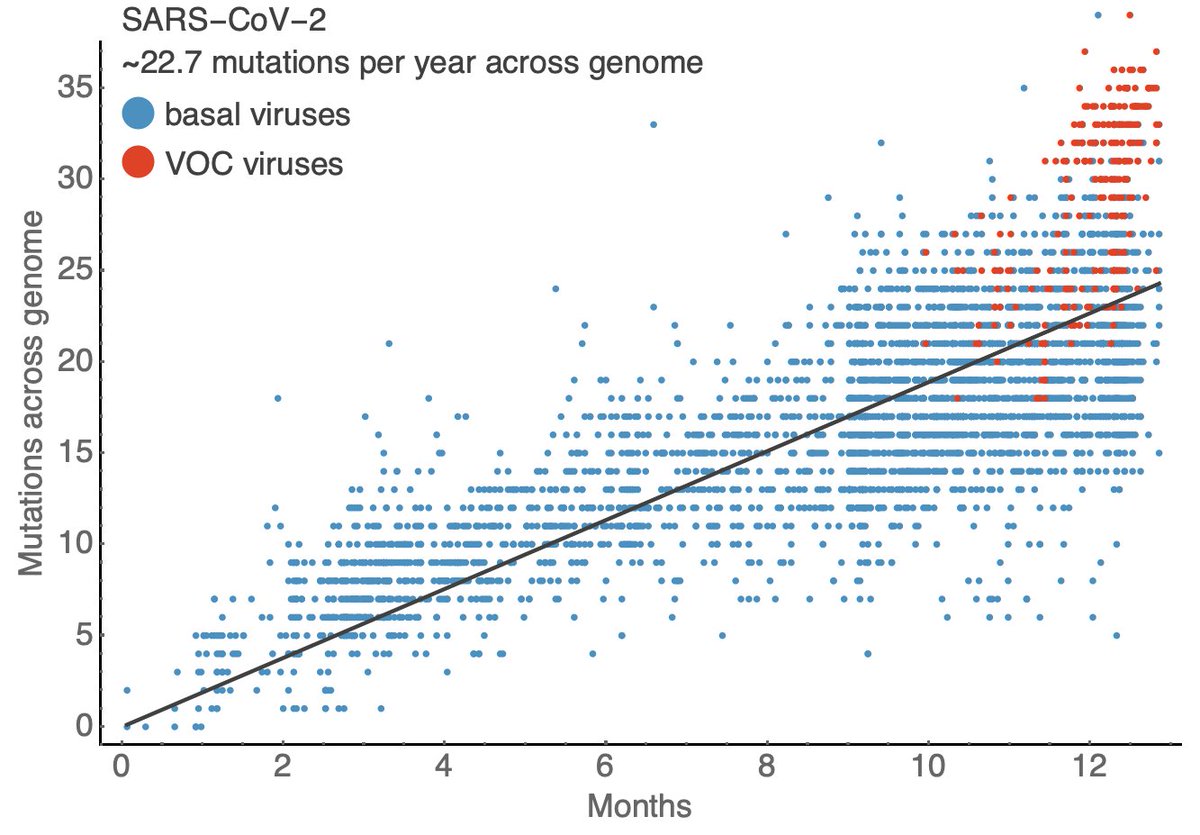
If we follow a transmission chain of SARS-CoV-2 from person to person, we'll generally see one mutation occur across the viral genome roughly every two weeks. 2/18
Here I use data from @nextstrain and @GISAID to compare sampling date to the number of mutations across the SARS-CoV-2 genome relative to initial genomes from Wuhan. This shows a steady accumulation of mutations through time with the average virus now bearing ~24 mutations. 3/18
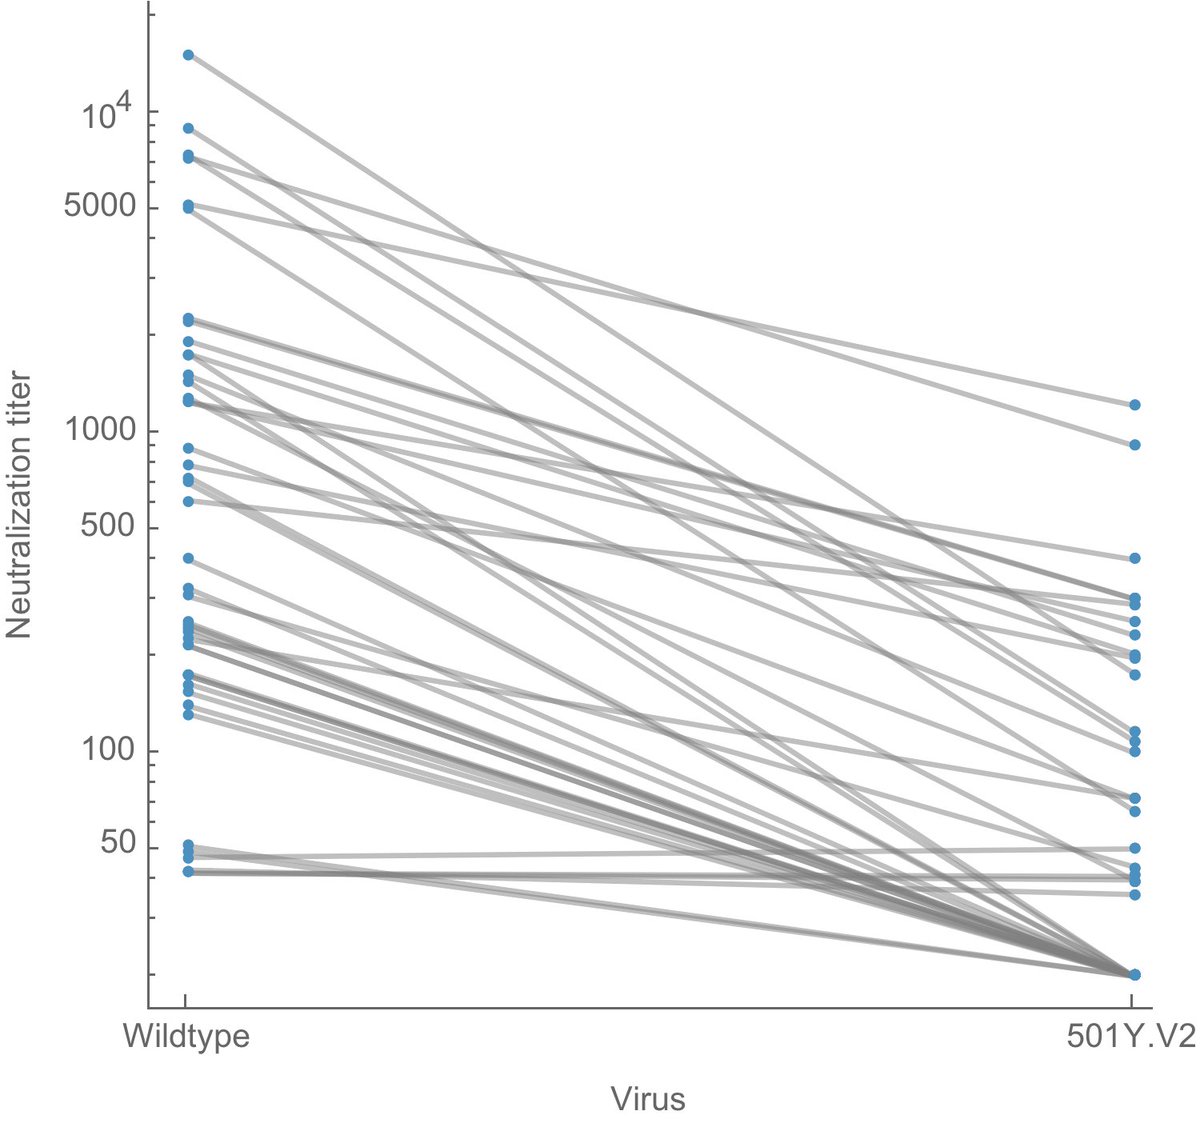
Important new study by Wibmer et al (biorxiv.org/content/10.110…) of neutralization by convalescent sera on wildtype vs 501Y.V2 variant viruses circulating in South Africa. It shows that mutations present in 501Y.V2 result in reduced neutralization capacity. 1/10
Here, I've replotted data from the preprint to make effect size a bit more clear. Each line is sera from one individual tested against wildtype virus on the left and 501Y.V2 variant virus on the right. Note the log y axis (as is common with this type of data). 2/10
It's clear that 501Y.V2 often results in reductions of neutralization titer, quantified as "fold-reduction" where, for example, a 2-fold reduction in titer would mean that you need twice as much sera to neutralize the same amount of virus in the assay. 3/10
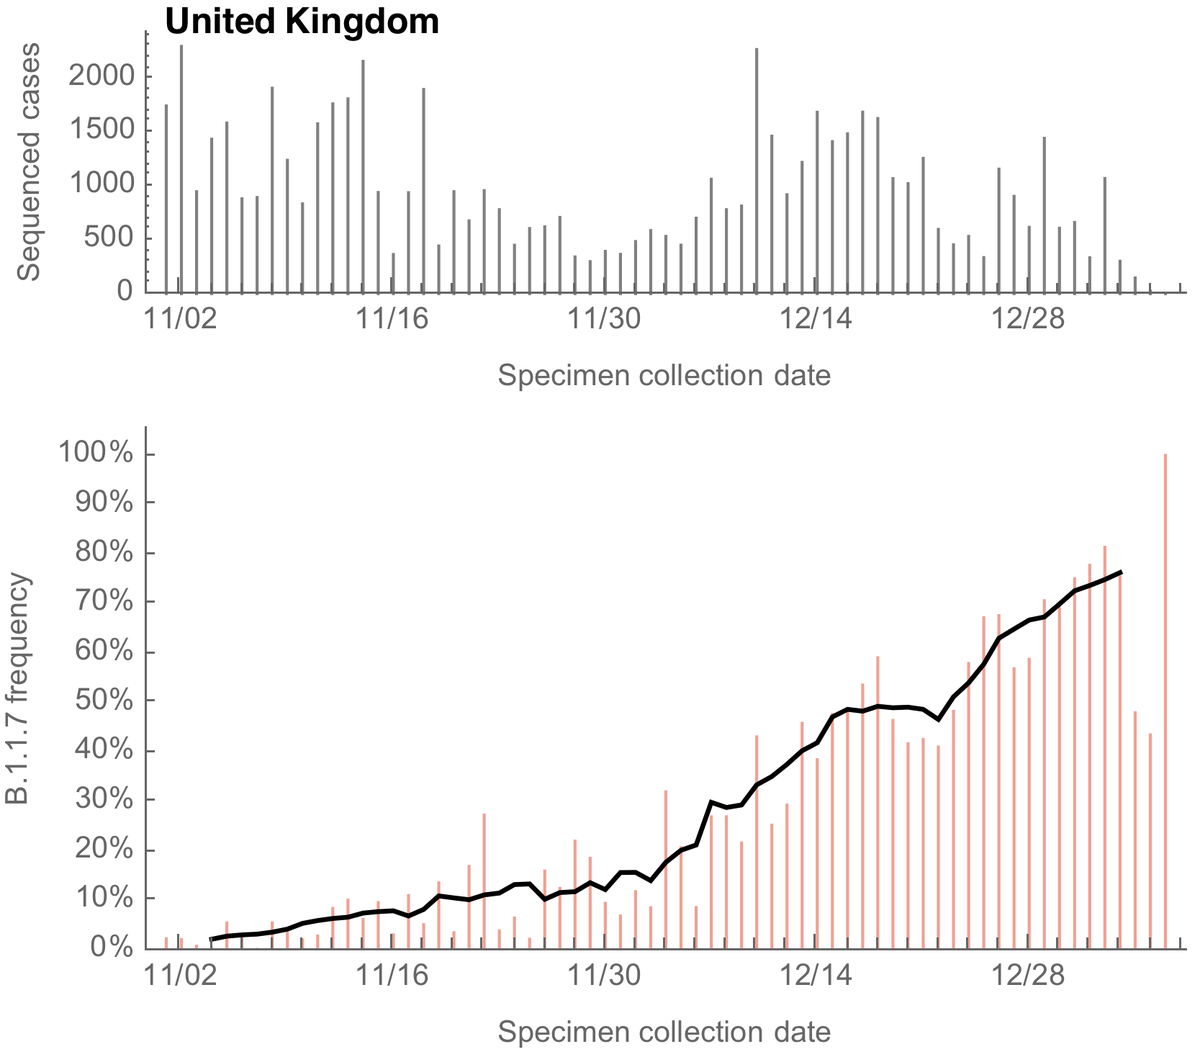
At this point, the countries with most genomic data to analyze spread of the variant virus belonging to cov-lineages.org B.1.1.7 lineage or @nextstrain clade 20I/501Y.V1 are the UK, Denmark and the USA. Here I compare growth rates of B.1.17 across these countries. 1/13
Working from @GISAID data, the UK has 18776 genomes, Denmark has 6089 genomes and the USA has 3093 genomes from specimens collected after Dec 15, 2020. Here, I'm looking at daily genomes with collection dates up to Jan 6 that were not pre-screened by "S dropout". 2/13
For the UK, we can see a steady increase in the frequency of sequenced variant viruses belonging to the B.1.1.7 lineage, reaching ~70% frequency at the end of December. Solid line is a 7 day sliding window average. 3/13
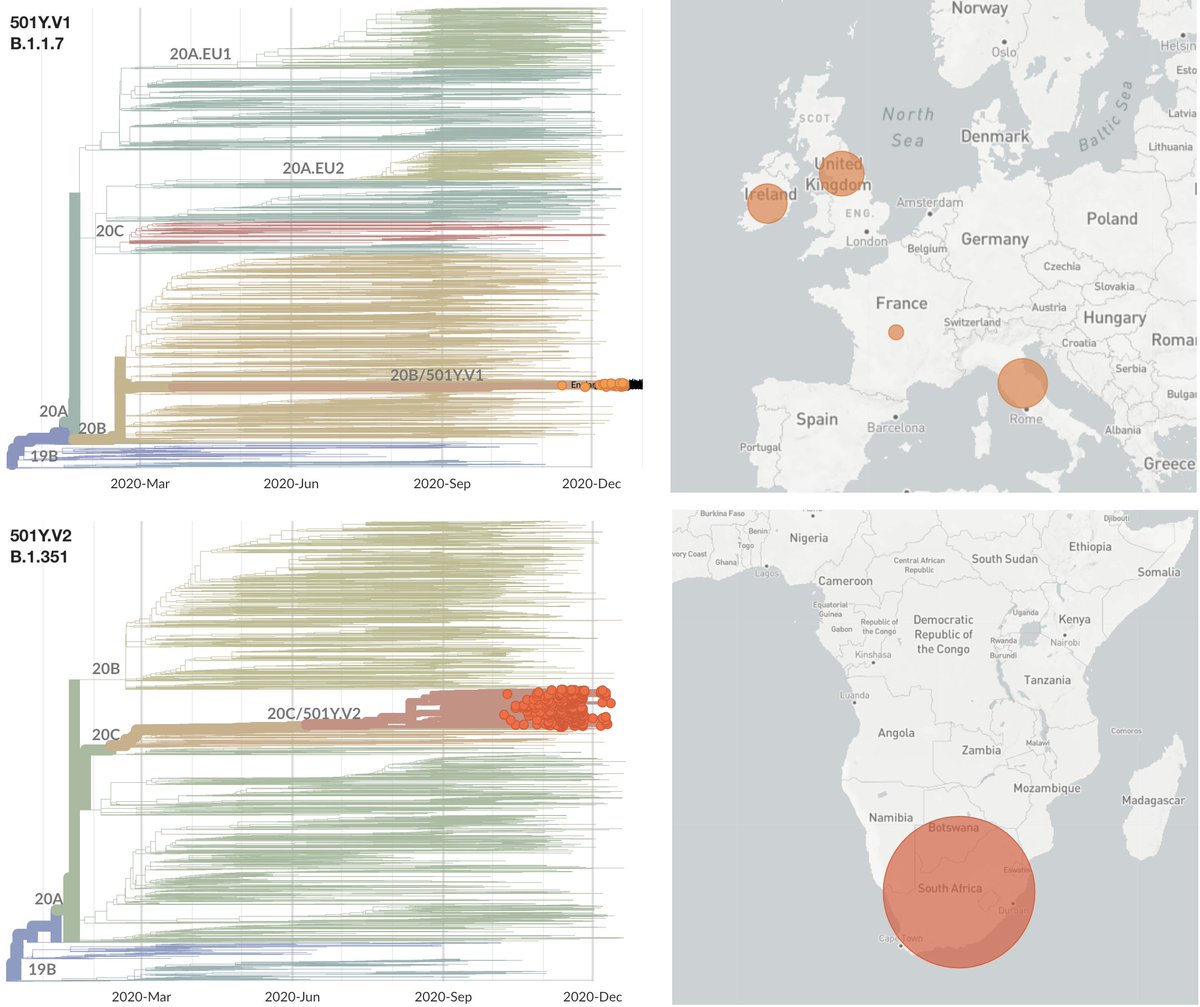
After ~10 months of relative quiescence we've started to see some striking evolution of SARS-CoV-2 with a repeated evolutionary pattern in the SARS-CoV-2 variants of concern emerging from the UK, South Africa and Brazil. 1/19
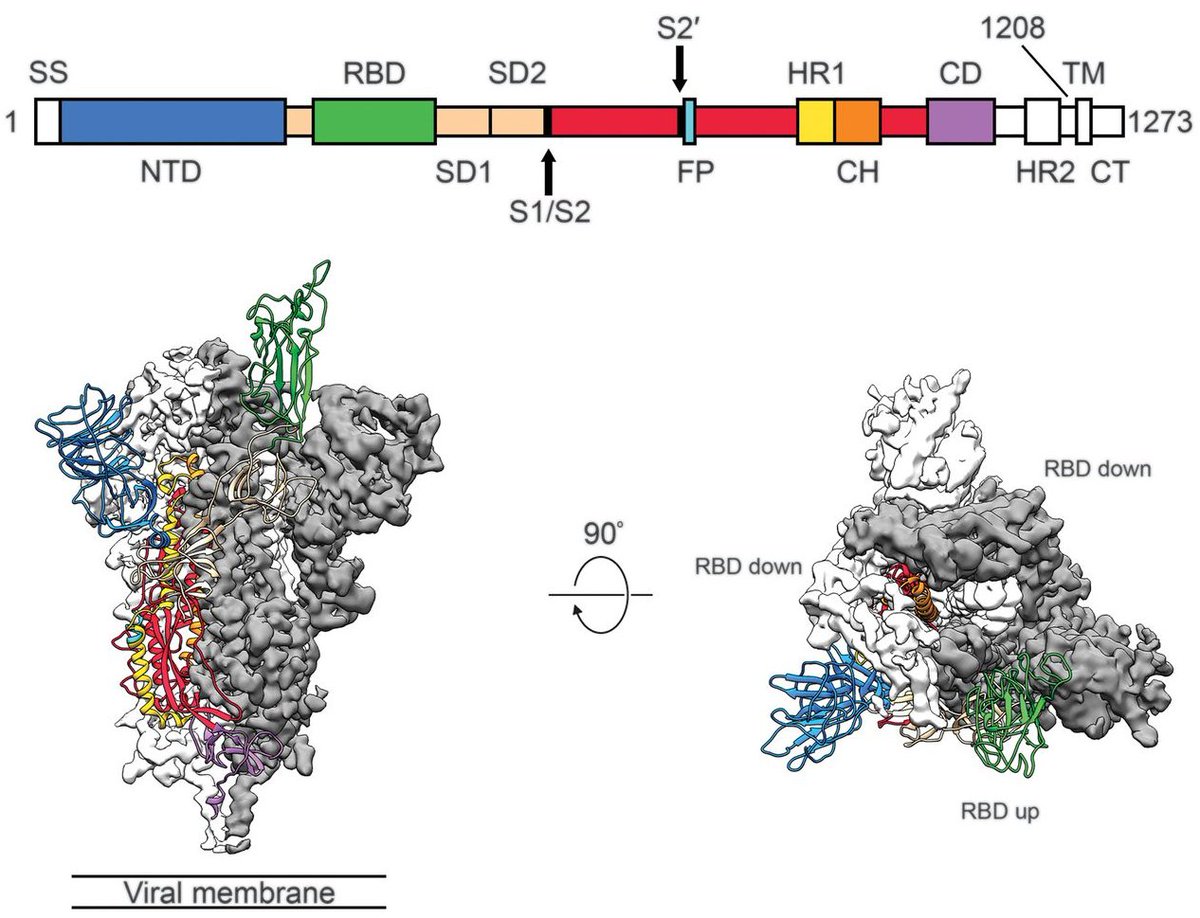
In SARS-CoV-2, the viral spike protein and in particular the receptor binding domain (RBD) is a locus for important viral evolution and is the primary target for the human immune response (figure from science.sciencemag.org/content/367/64…). 2/19
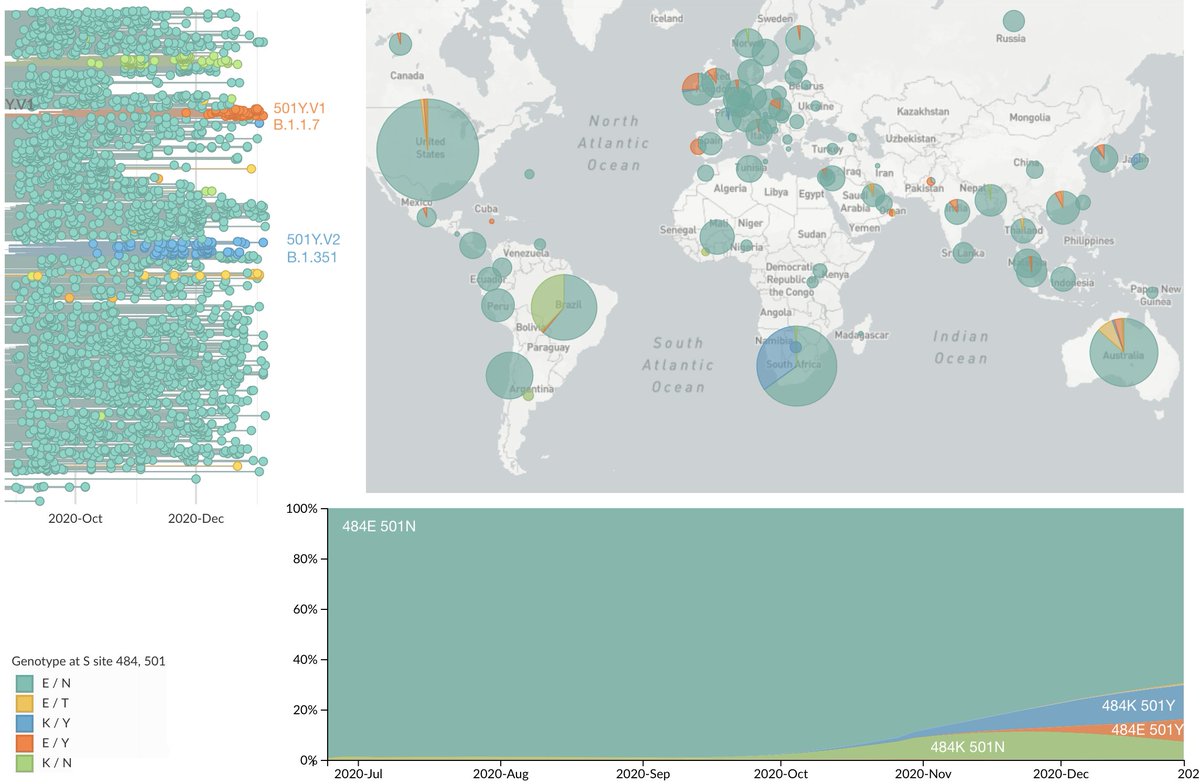
There had been little evolution in the RBD until ~Oct 2020 when we saw RBD mutations start to spread. Perhaps chief among mutations of interest are E484K and N501Y which mutate nearby sites in the RBD. The evolution of these sites can be seen here: nextstrain.org/ncov/global?c=…. 3/19
With data that has emerged in the last week, I'm now 80-90% convinced that infections by the UK variant virus (Pangolin lineage B.1.1.7, @nextstrain clade 20B/501Y.V1) result in, on average, more onward infections, ie are more transmissible. 1/10
My thinking primarily comes from three data points: 1. rapid increase in frequency of variant over wildtype 2. higher secondary attack rate of variant than wildtype 3. increased viral loads of variant over wildtype as measured by Ct
2/10
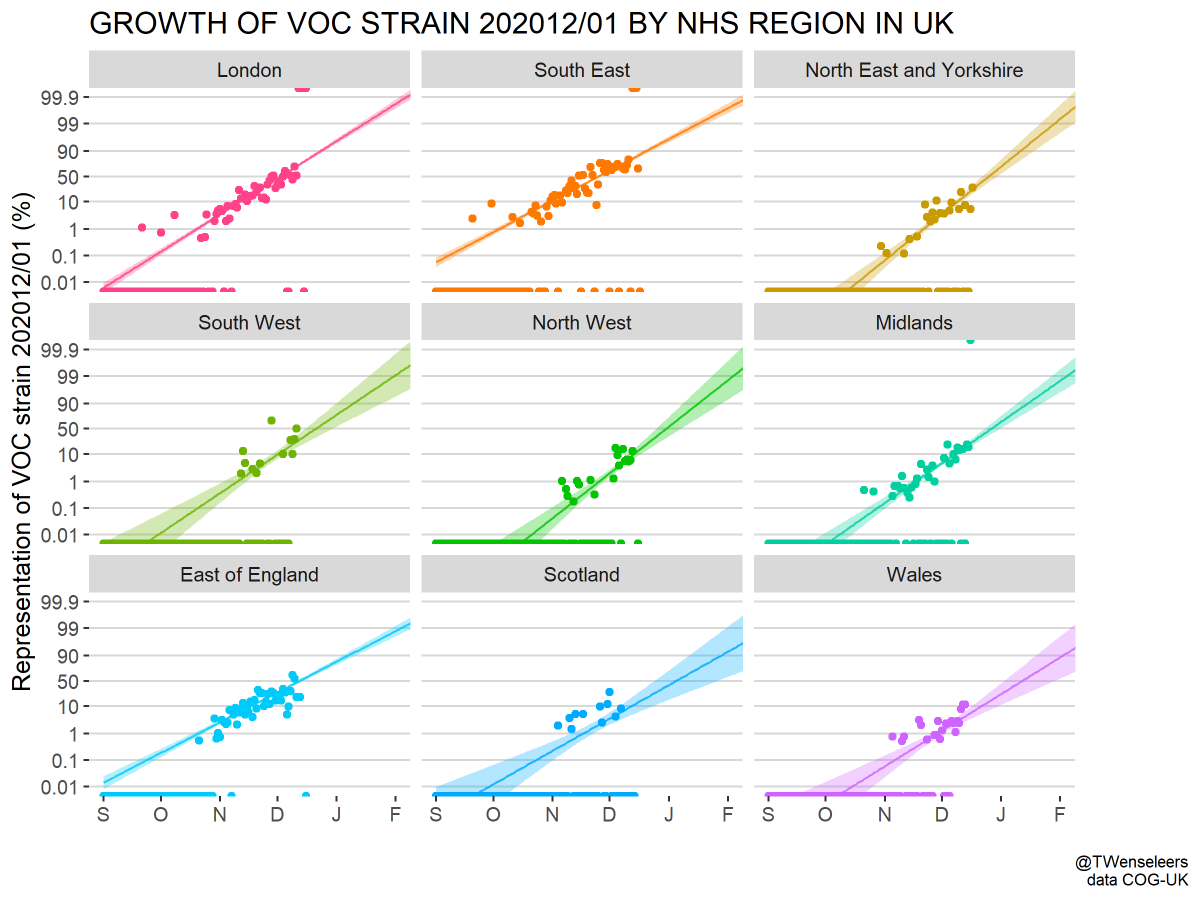
For point 1 (increase in frequency) we have pretty much the same data as of a week ago, where we see increasing frequency of variant over wildtype across the UK. This can be readily seen in this analysis by @TWenseleers. 3/10
Given that the US has not detected SARS-CoV-2 variant viruses 501Y.V1 or 501Y.V2, what bounds can we place on their current frequency in the US based on sample counts? 1/12
However, because the US is generally slower at turnaround of specimens into SARS-CoV-2 sequences than the UK, we lack confidence that 501Y.V variants are absent from the US. 3/12