Some comments on money supply, velocity, money multiplier, and GDP...
These are my thoughts - open to comments below.
(Thread)
1/
These are my thoughts - open to comments below.
(Thread)
1/

There are a lot of analysts now that discount the measure known as "velocity" which comes from the equation of exchange:
GDP = M2*V
We hear things like "velocity is only a remainder" etc, even though a lot of our data is calculated as a remainder.
2/
GDP = M2*V
We hear things like "velocity is only a remainder" etc, even though a lot of our data is calculated as a remainder.
2/
These same analysts love money supply as a signal for basically everything (inflation, collapse of the dollar, etc.)
We'll if we know that GDP = M2 * V
And V is a bad measure, but M2 is a good measure, then GDP is a bad measure....
3/
We'll if we know that GDP = M2 * V
And V is a bad measure, but M2 is a good measure, then GDP is a bad measure....
3/
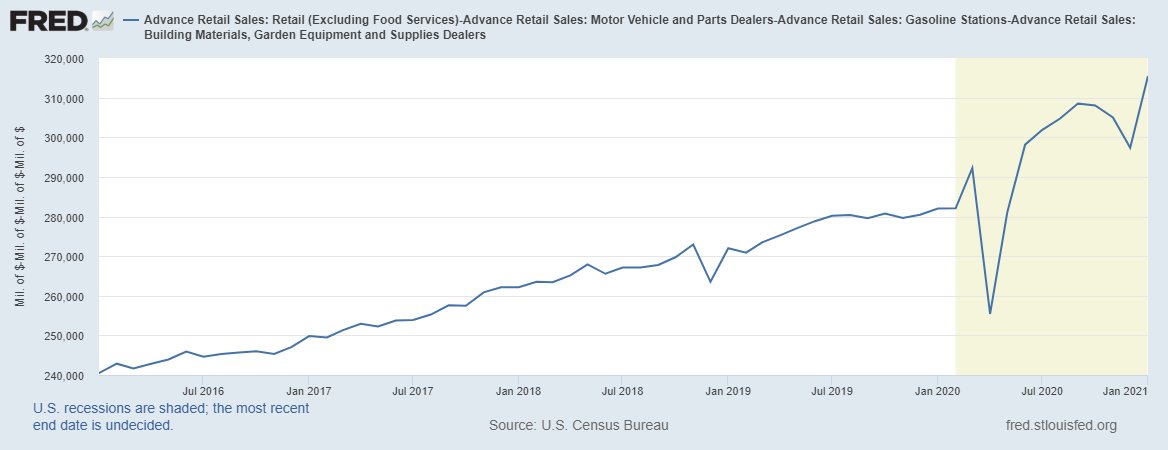
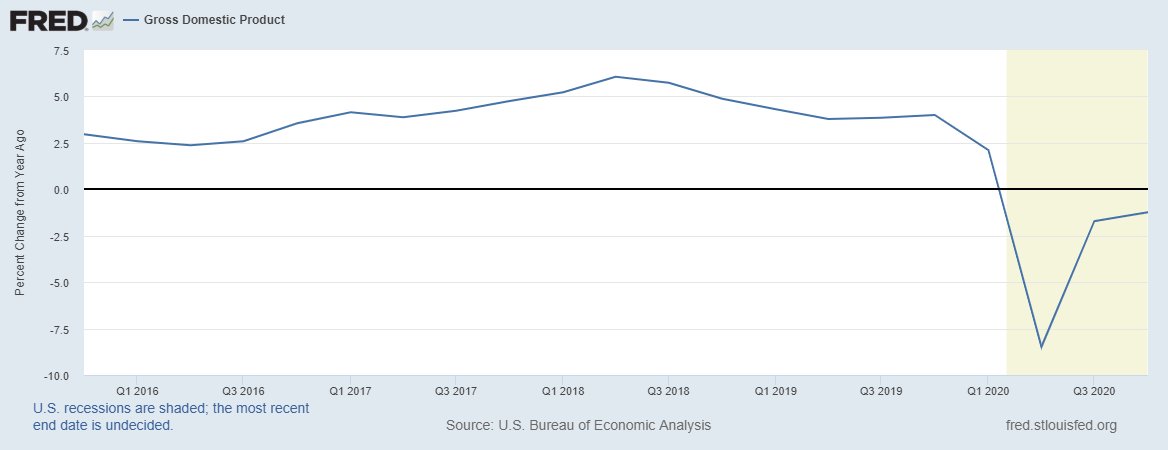
Nominal GDP is the best economic data series we have, revised three times, on an annual basis and then on a 5-year "benchmark" basis.
There is no price mismeasurement because it's a nominal series.
4/
There is no price mismeasurement because it's a nominal series.
4/
What is a secular decline in velocity telling us?
Declining velocity is telling us that increases in money supply are not going to goods and services or "final sales" which boosts GDP.
The money is rather sitting in financial assets or some financial account.
5/
Declining velocity is telling us that increases in money supply are not going to goods and services or "final sales" which boosts GDP.
The money is rather sitting in financial assets or some financial account.
5/

If the government increases debt and hands you $100, and you buy shares of the $SPY, GDP doesn't budge
Velocity captures this on a coincident basis
For various reasons and incentives, it makes more sense for people to take $$ and put it into financial assets or accounts.
6/
Velocity captures this on a coincident basis
For various reasons and incentives, it makes more sense for people to take $$ and put it into financial assets or accounts.
6/
Same thing with the money multiplier which is measured as M2/MB.
If the Fed increases the MB (what they control) and deposits increase on the other end, there is a 1:1 increase in M2/MB which drags the money multiplier down.
7/
If the Fed increases the MB (what they control) and deposits increase on the other end, there is a 1:1 increase in M2/MB which drags the money multiplier down.
7/

If the MB increases but there is a credit effect from new loans etc, then M2 can rise more than the MB, and the money multiplier increases.
When velocity and the money multiplier fall together, that is strong evidence that money is trapped in financial assets/accounts
8/
When velocity and the money multiplier fall together, that is strong evidence that money is trapped in financial assets/accounts
8/
We have to move forward with the idea that GDP is our best series. If you don't like nominal GDP, there is no data set that will work for you
So if we keep nGDP and use M4 divisa including TSY securities as our money supply measure, we see what our new velocity looks like
9/
So if we keep nGDP and use M4 divisa including TSY securities as our money supply measure, we see what our new velocity looks like
9/
M4 divisa is a broad aggregate, including negotiable money-market securities, such as commercial paper, negotiable CDs, and T-bills.
Including TSYs can be informative because, in our system, TSYs are used as money at times.
10/
Including TSYs can be informative because, in our system, TSYs are used as money at times.
10/
If we divide GDP by M4 divisa, we get our new velocity measure which also collapsed after COVID and ticked down again in December.
11/
11/

If we chop off the COVID decline, we can see velocity in a downtrend, not as serious as M2 velocity but the messaging and signal is consistent that the increases in money supply are less effective at generating GDP.
12/
12/

The same goes for our new measure of the money multiplier.
Defining money is very hard and there are a lot of competing measures.
All measures, however, show the same trend of declining V and declining credit multiplier.
13/
Defining money is very hard and there are a lot of competing measures.
All measures, however, show the same trend of declining V and declining credit multiplier.
13/

If we want to fix the long-term trends, we need to figure out how and why new money refuses to go into the real economy and holds a preference for financial assets/accounts.
I have a few thoughts on this but that's another thread.
14/
I have a few thoughts on this but that's another thread.
14/
We can continue to ramp money supply if we want (today's inflationary impulse is not related to money supply - people will be mad at me for this one)
But if 25% money supply doesn't get the results we want, don't be surprised if 50% money supply doesn't do it either.
15/
But if 25% money supply doesn't get the results we want, don't be surprised if 50% money supply doesn't do it either.
15/
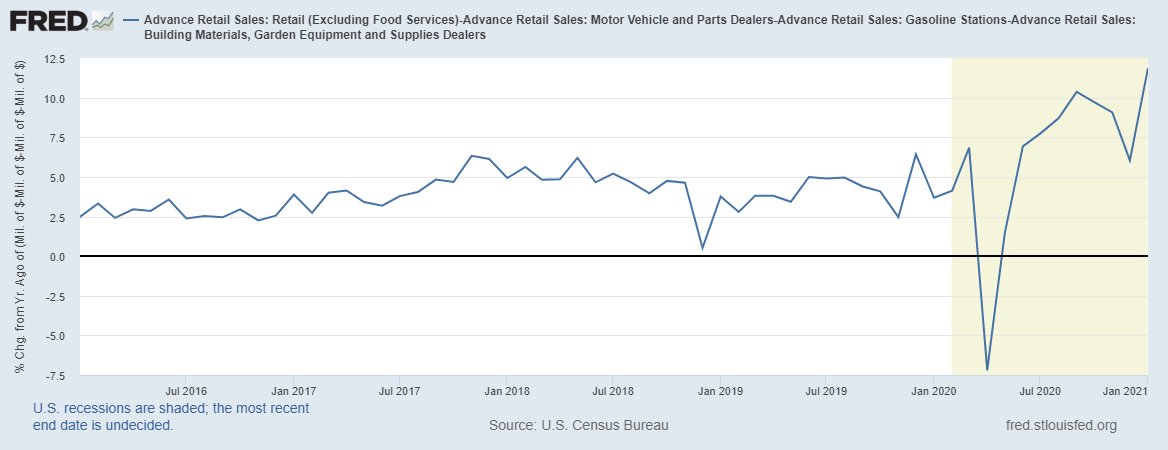
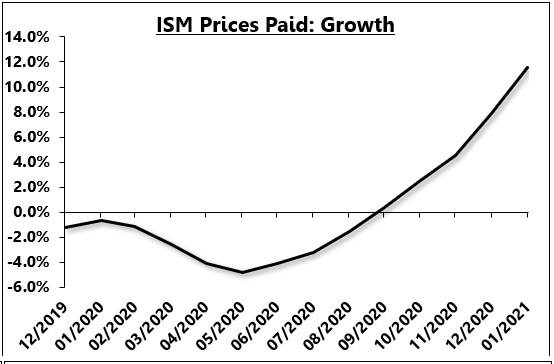
Hint: Watch the momentum in the global manufacturing sector. It is still very strong.
Once that fades, we can stomp on money supply and the diminished efficacy will reveal itself once the tailwind of the Zarnowitz rule and reopening is no longer at our backs.
(End)
16/16
Once that fades, we can stomp on money supply and the diminished efficacy will reveal itself once the tailwind of the Zarnowitz rule and reopening is no longer at our backs.
(End)
16/16
For reference, here is the ratio of M4/M2 since 1967

• • •
Missing some Tweet in this thread? You can try to
force a refresh