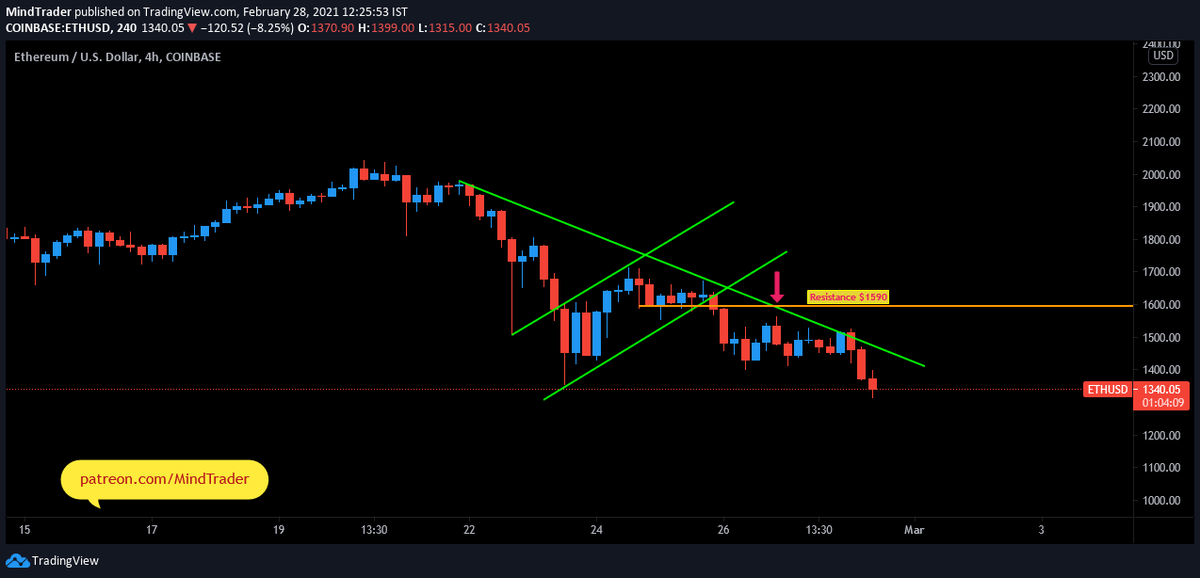
#BearishFlagPattern: When the prices are in the downtrend a bearish flag pattern shows a slow consolidation higher after an aggressive downtrend.This indicates that there is more selling pressure moving the prices down rather than up and indicates that the momentum will continue. 


$BTC (Bitstamp Chart)- Resistance $49100 & $ETH (Bitstamp Chart)- Resistance at $1590, be careful and play light. #BTC #ETH #BearFlagPattern 


$BTC (Bitstamp Chart)-Already alerted, Price fail to break out above $49100 and crashed, low $43782 so far & $ETH (Bitstamp Chart)- Failed to break out above $1590 and crashed, Low $1315 so far. #BTC #ETH #BearFlagPattern 


$BTC (Bitstamp Chart)- Bear Flag probably will end somewhere between $41042 & $39138 and $ETH (Bitstamp Chart)- Bear Flag probably will end somewhere between $1153 & $1055. #BTC #ETH #BearFlagPattern 


$BTC- Resistance $48000 & $49100 and $ETH- Resistance $1545 & $1590, watch out, these levels. #BTC #ETH #BearFlagPattern 


Slight adjustment here, $BTC - Resistance now at $49730 & $ETH- Resistance now at $1600, above that big move possible. #BTC #ETH 


Still goes either way here, not convincing at all, $BTC dropped nearly $1000 from near $49730 resistance and $ETH also not find any strength so far to break out above $1600 resistance.#BTC #ETH #BearFlagPattern 


• • •
Missing some Tweet in this thread? You can try to
force a refresh


