Mar 12

Excess deaths/100K in #Canadians 45+ years old
(fold difference compared to Atlantic & Northern Canadians)

-from 1st week province reached 1 reported #COVID19 death/million people
-to Nov 14, 2020 (latest date of full excess mortality reporting in all provinces)
Excess deaths/100K in #Canadians (all ages, and 45+ years) compared to reported #COVID19 deaths

-from 1st week province reached 1 reported #COVID19 death/million people
-to Nov 14, 2020 (latest date of full excess mortality reporting in all provinces)
Total excess deaths in #Canadians (all ages, and 45+ years) compared to reported #COVID19 deaths

-from 1st week province reached 1 reported #COVID19 death/million people
-to Nov 14, 2020 (latest date of full excess mortality reporting in all provinces)
By suggestion of @picardonhealth a short explainer on estimates of excess death/mortality.

First, these data come from @StatCan_eng:

Table 13-10-0784-01 Adjusted number of deaths, expected number of deaths and estimates of excess mortality, by week

doi.org/10.25318/13100…
Estimates of excess mortality/deaths take the number of OBSERVED DEATHS from any cause reported in a given period (for example, during the #COVID19 epidemic), and compare these numbers to EXPECTED DEATHS for the same period.
The expected deaths from Mar-Nov 2020 (the period covered in the analyses I've shown) is the average number of deaths from all causes that occurred during this period from 2015-2019. This gives an average baseline of how many deaths we'd normally expect from Mar-Nov.
Estimated excess mortality is calculated by subtracting average number of deaths for the period of interest over the previous 5 years from the number of deaths that actually occurred in that period.

Excess deaths = (Mar-Nov 2020 deaths) - (avg Mar-Nov deaths from 2015-2019)
In plain language, excess death is how many more people died in a given period than you expected to die, based on previous years.
Baseline/expected deaths include deaths due to all the "normal" causes of death. The excess death is on top of that and is due to something new.

The numbers I've provided are just that, the number of "extra" deaths that occurred from Mar-Nov 2020, after the arrival of #COVID19.
Please let me know if I can help clarify anything! As a scientist I'm not always very good at explaining things clearly, so tell me if this is as clear as mud to you!
Finally, something else I should have explained is why to focus on excess deaths in people 45 years and older. This is to try to focus as much as possible on adults most likely to die from #COVID19 AND to reduce confounding from excess deaths due to accidental opioid overdose.
The accidental opioid poisoning epidemic in Canada has been worsening during the COVID-19 epidemic. Most opioid deaths occur in people aged 20-49. The StatsCan excess death age boundary for people in their 40s is 45, so that's why I'm looking at ages 45+y.

• • •

Missing some Tweet in this thread? You can try to force a refresh
 

Keep Current with Tara Moriarty

Tara Moriarty Profile picture

Stay in touch and get notified when new unrolls are available from this author!

Read all threads

This Thread may be Removed Anytime!

PDF

Twitter may remove this content at anytime! Save it as PDF for later use!

Try unrolling a thread yourself!

how to unroll video
  1. Follow @ThreadReaderApp to mention us!

  2. From a Twitter thread mention us with a keyword "unroll"
@threadreaderapp unroll

Practice here first or read more on our help page!

More from @MoriartyLab

13 Mar
Mar 12

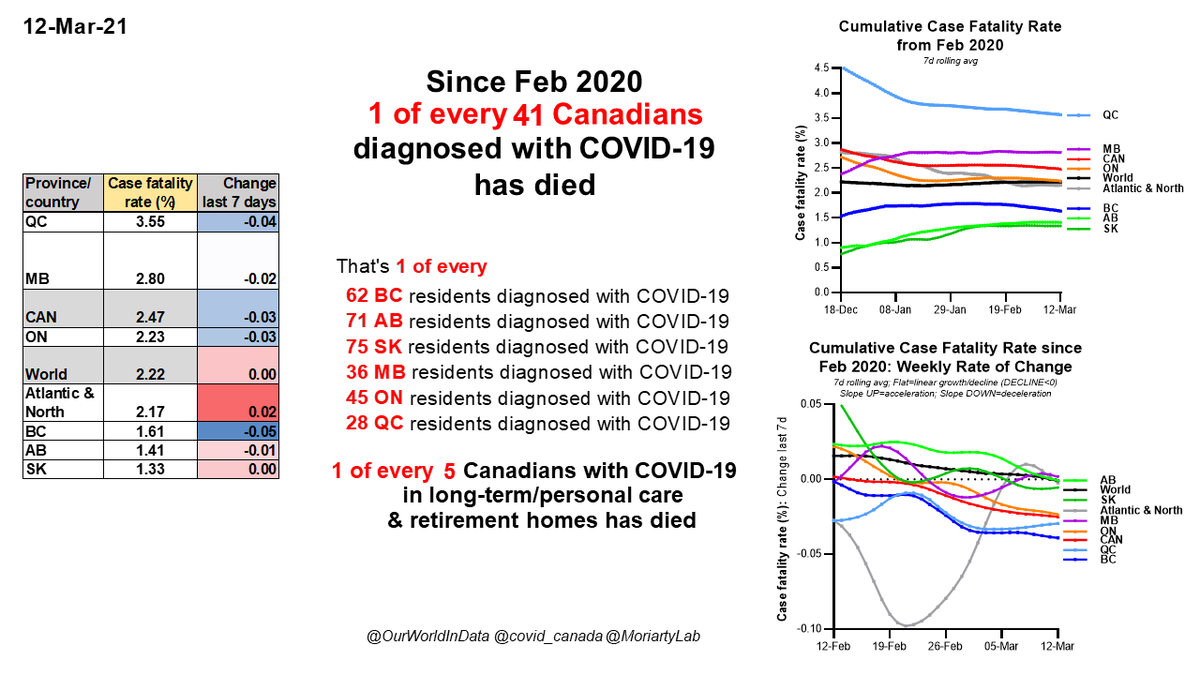
1 of every 41 #Canadians with #COVID19 has died since Feb 2020

1 in 62 BC
1 in 71 AB
1 in 75 SK
1 in 36 MB
1 in 45 ON
1 in 28 QC

1 of every 5 Cdns w/ C19 in long-term care & retirement homes has died

LAST 28 DAYS: 1,310 deaths, 2,064 LTC/RH cases, 811 LTC/RH deaths
Mar 12

-#COVID19 is in top 4 largest mortality events in #Canadian history

-Last 28 days: 1,310 Canadians died of C19

-If every week is like this week, 1,100 Canadians may die in next 28 days
From Mar-Nov 14, 2020

For every excess death of Atlantic and Northern Canadians 45 years and older

This is how many excess deaths in same age group there were in other regions:

BC 62X
AB 39X
SK 51X
MB 24X
ON 65X
QC 108X
Canada outside Atlantic & Northern regions: 68X
Read 19 tweets
20 Feb
Feb 19

1 of every 39 #Canadians with #COVID19 has died since Feb 2020

1 in 57 BC
1 in 72 AB
1 in 75 SK
1 in 36 MB
1 in 43 ON
1 in 27 QC

1 of every 5 Cdns w/ C19 in long-term care & retirement homes has died

LAST 28 DAYS: 2,745 deaths, 7,433 LTC/RH cases, 1,885 LTC/RH deaths
Feb 19

-#COVID19 is in top 5 largest mortality events in #Canadian history

-Last 28 days: 2,745 Canadians died of C19

-If every week is like this week, 2,267 Canadians may die in next 28 days
Feb 19

1 of every 5 #Canadians with #COVID19 in long-term/ personal care & retirement homes has died since Feb 2020

1 in 6 BC
1 in 7 AB
1 in 5 SK
1 in 4 MB
1 in 8 ON
1 in 4 QC

There are 7,433 LTC/RH cases in last 28 days

We MUST vaccinate everyone in LTC & RHs NOW
Read 13 tweets
15 Feb
Big day!!!!!!!

The new @COVID_19_Canada website is now live!

We've got a helluva lot done since we began on March 20, 2020, but we're not always great at tooting our own horns.

So, today, I will tell you about us, and most importantly, how we can help.

covid19resources.ca/about-us/
First, our work is financially supported by the @TrottierFdn @GenomeCanada and @calculquebec, with in-kind labour from @UofT @mcgillu @NRC_CNRC @OICR_news @uofg @usask.

Our partners include @CanCovid @ScienceUpFirst @labcrunch @SkeenaStrong @cactushive
Here's how we get the work done:

Our core team of 23 consists of a few paid staff plus MANY volunteers running & developing our programs. You can find them at the link below.

BTW we are still seeking volunteer regional leads for AB, BC & the North.

covid19resources.ca/about-us/
Read 22 tweets
13 Feb
Feb 12

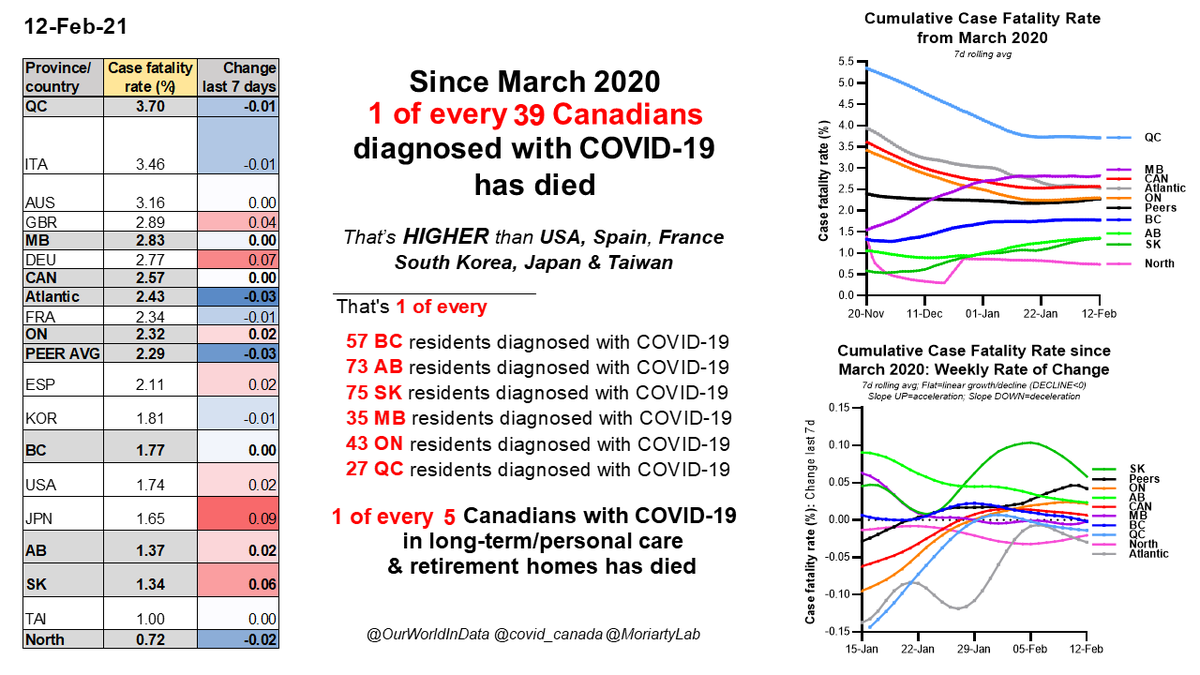
1 of every 39 #Canadians with #COVID19 has died since Mar 2020

1 in 57 BC
1 in 73 AB
1 in 75 SK
1 in 35 MB
1 in 43 ON
1 in 27 QC

1 of every 5 Cdns w/ C19 in long-term care & retirement homes has died

LAST 28 DAYS: 3,547 deaths, 10,081 LTC/RH cases, 2,029 LTC/RH deaths
Feb 12

-More #Canadians have died of #COVID19 than died each year during 1918-1920 "Spanish" flu

-COVID-19 is in top 10 largest mortality events in Cdn history

-Last 28 days: 3,547 Canadians died of C19

-If every week is like this week, 3,100 Cdns may die in next 28 days
Feb 12

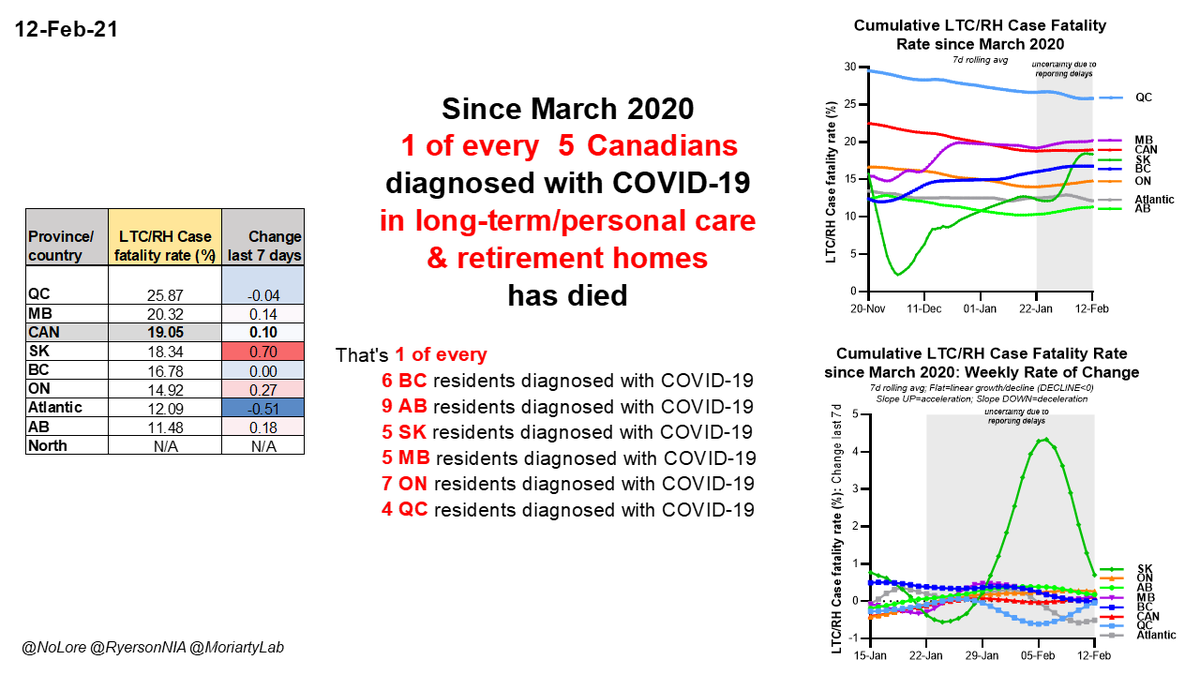
1 of every 5 #Canadians with #COVID19 in long-term/ personal care & retirement homes has died since March 2020

1 in 6 BC
1 in 9 AB
1 in 5 SK
1 in 5 MB
1 in 7 ON
1 in 4 QC

There are 10,081 LTC/RH cases in last 28 days

We MUST vaccinate everyone in LTC & RHs NOW
Read 15 tweets
11 Feb
Just sitting here, entering #COVID19 #Canada data, wondering if I've missed any recent expressions of concern from certain premiers about the wisdom of recent re-opening decisions.

Oh, I don't know, maybe from premiers of QC, ON, MB, SK?

Why you ask?

Well.....
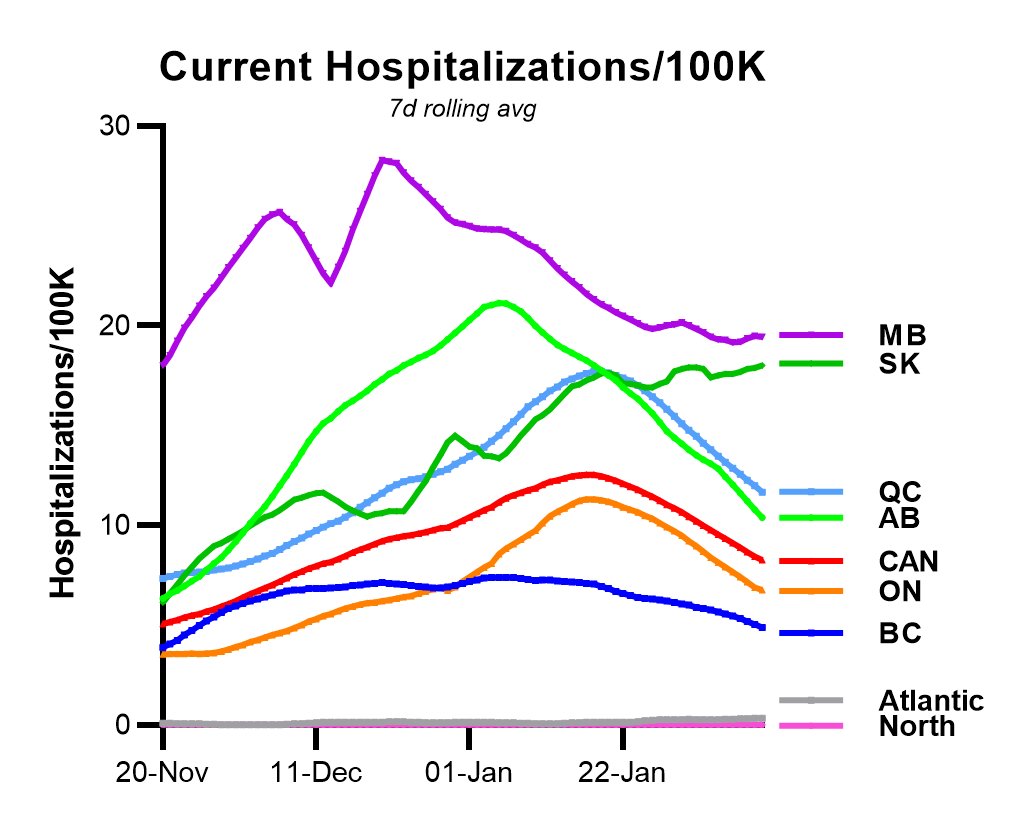
@roussin_brent is looking forward to some light re-opening, when MB still has the highest per capita rate of #COVID19 hospitalizations in the country, a record held for months.

But look, SK might soon catch up. Image
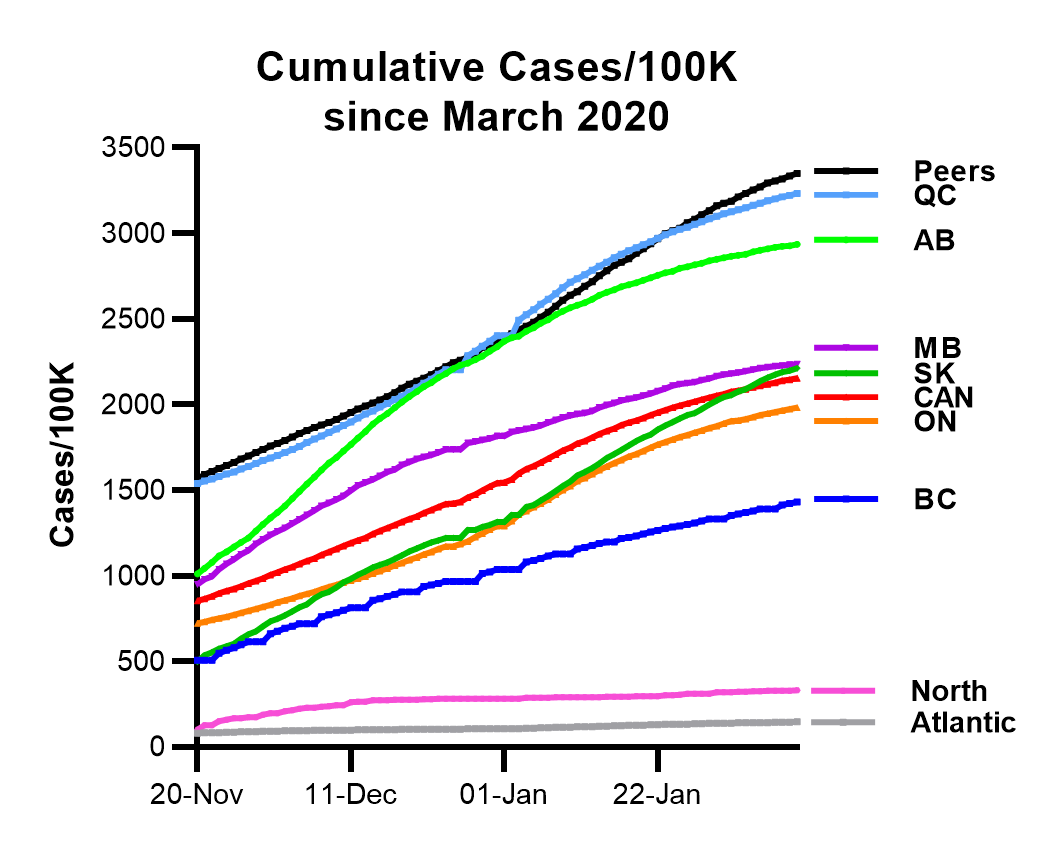
Speaking of SK, @PremierScottMoe must be proud not only that SK is about to overtake MB for highest #COVID19 hospitalizations per capita in #Canada, but that SK is also just about to pass MB for total per capita cases in the epidemic.

Yes, that's since Feb 2020, not 2021. Image
Read 6 tweets
6 Feb
Feb 5

1 of every 39 #Canadians with #COVID19 has died since March 2020

1 in 56 BC
1 in 74 AB
1 in 75 SK
1 in 36 MB
1 in 43 ON
1 in 27 QC

1 of every 5 Cdns w/ C19 in long-term, personal care & retirement homes has died

There are 14,4457 LTC cases in last 28 days ⬇️

🧵
I'm simplifying these threads & will now show sliding window views of last 3 months of cumulative data for whole epidemic (except for province-specific summaries at end).

Rate of change graphs are provided for preceding 28 days to give a better sense of most recent dynamics.
Please note that though it's tempting to speculate about recent trends for long-term/personal care & retirement homes, reporting for this sector is VERY delayed & is almost always incomplete for preceding 3-4 weeks. The period of uncertainty is now highlighted in gray in graphs.
Read 25 tweets

Did Thread Reader help you today?

Support us! We are indie developers!


This site is made by just two indie developers on a laptop doing marketing, support and development! Read more about the story.

Become a Premium Member ($3/month or $30/year) and get exclusive features!

Become Premium

Too expensive? Make a small donation by buying us coffee ($5) or help with server cost ($10)

Donate via Paypal Become our Patreon

Thank you for your support!

Follow Us on Twitter!