Memphis/Shelby County
Covid Wk-In-Review
tl;dr
* It's a race: Vax's Vs Variants
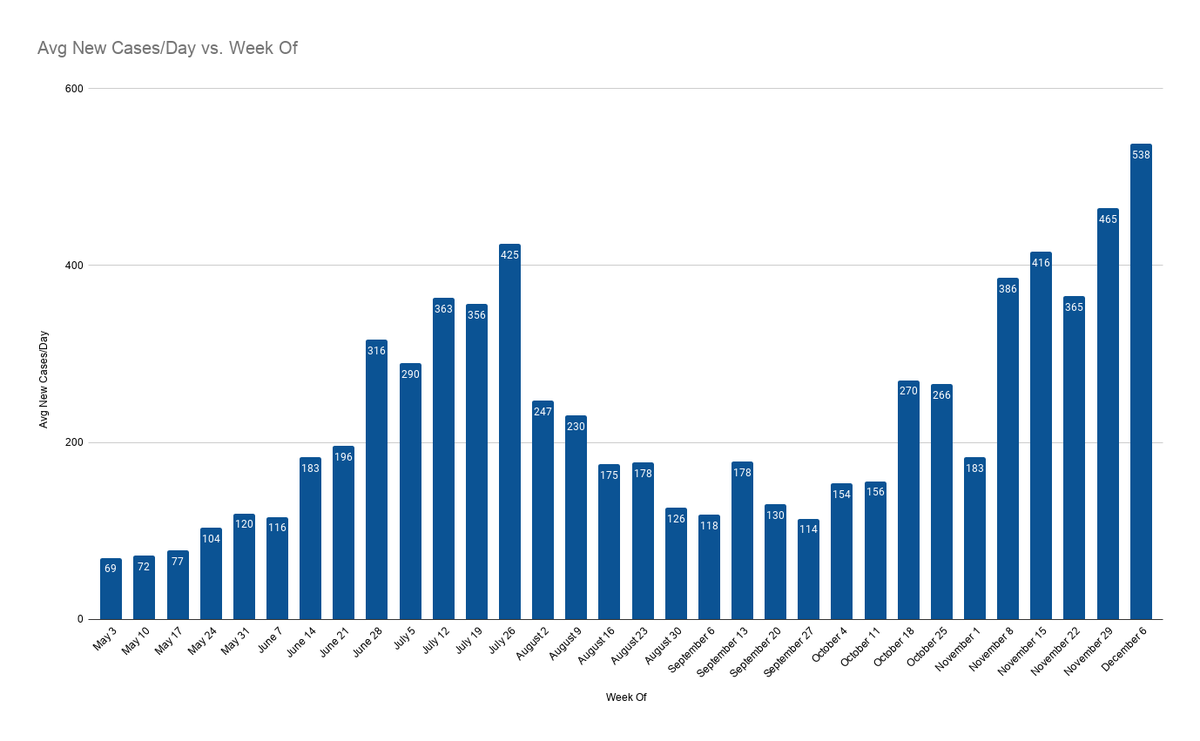
* Cases are up slightly this wk
* Positivity is up as well
* Hospitalizations are also up
* Deaths are up too
* Fortunately, vax's are up (though mainly 2nd dose)
1/
Covid Wk-In-Review
tl;dr
* It's a race: Vax's Vs Variants
* Cases are up slightly this wk
* Positivity is up as well
* Hospitalizations are also up
* Deaths are up too
* Fortunately, vax's are up (though mainly 2nd dose)
1/
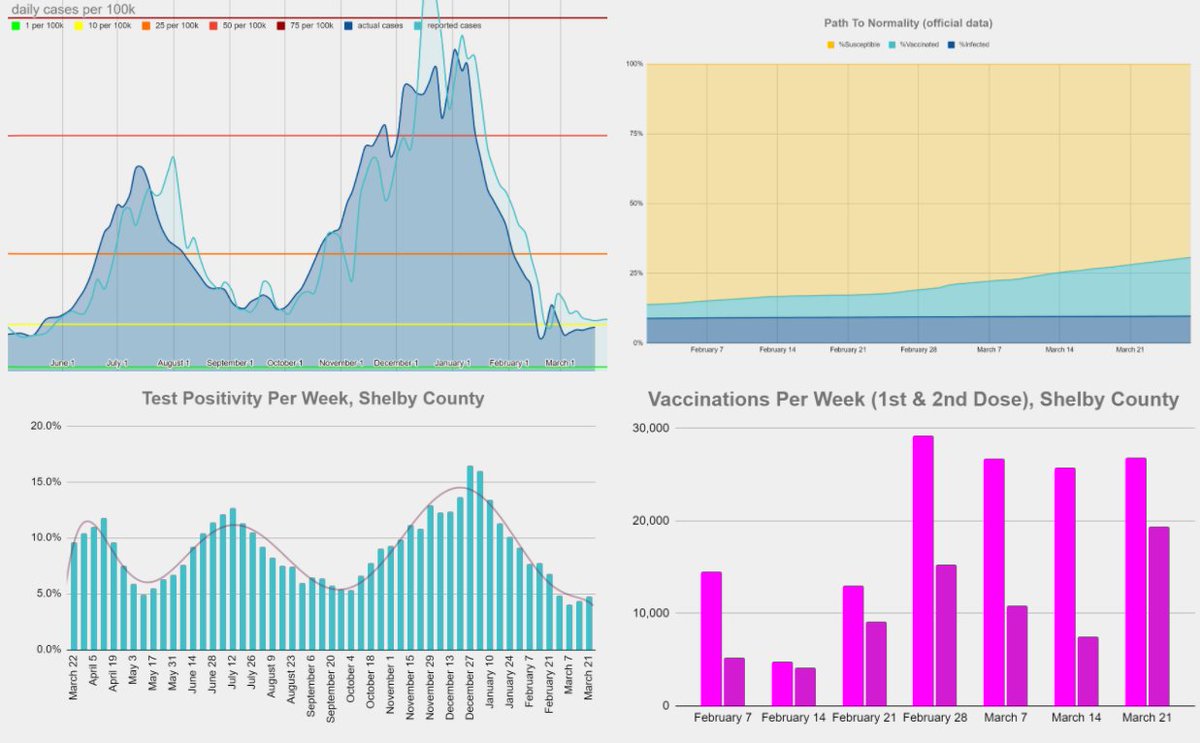
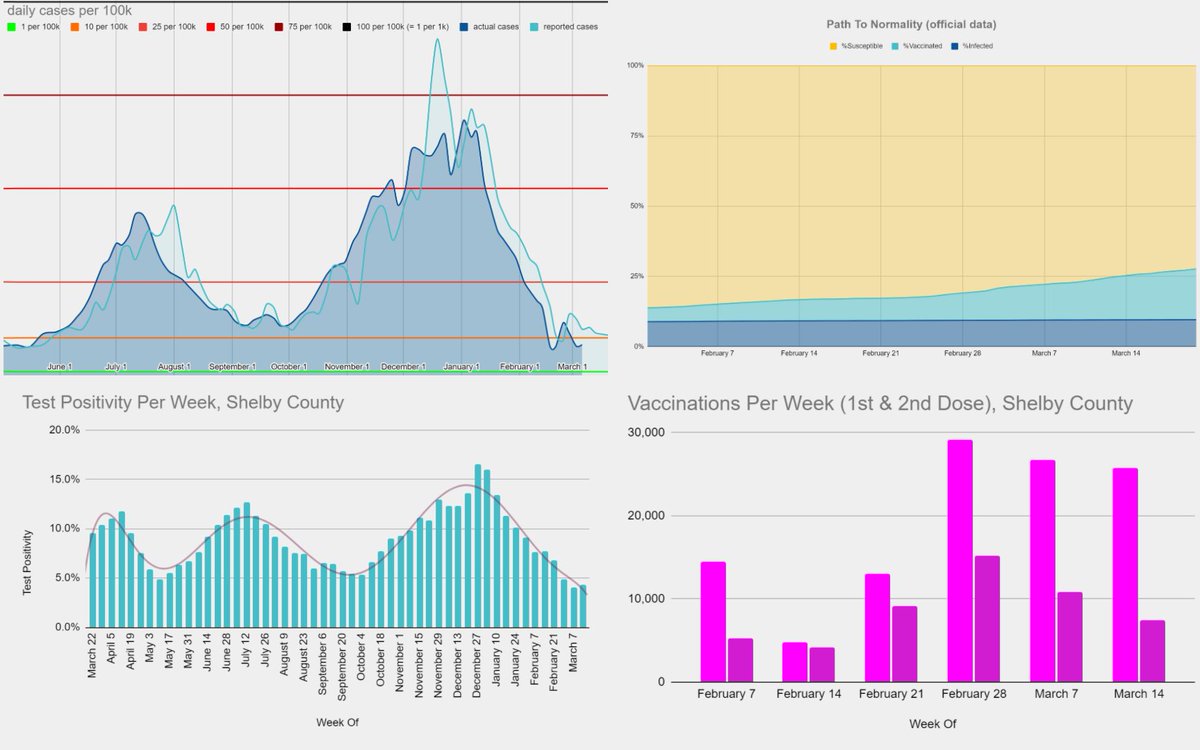
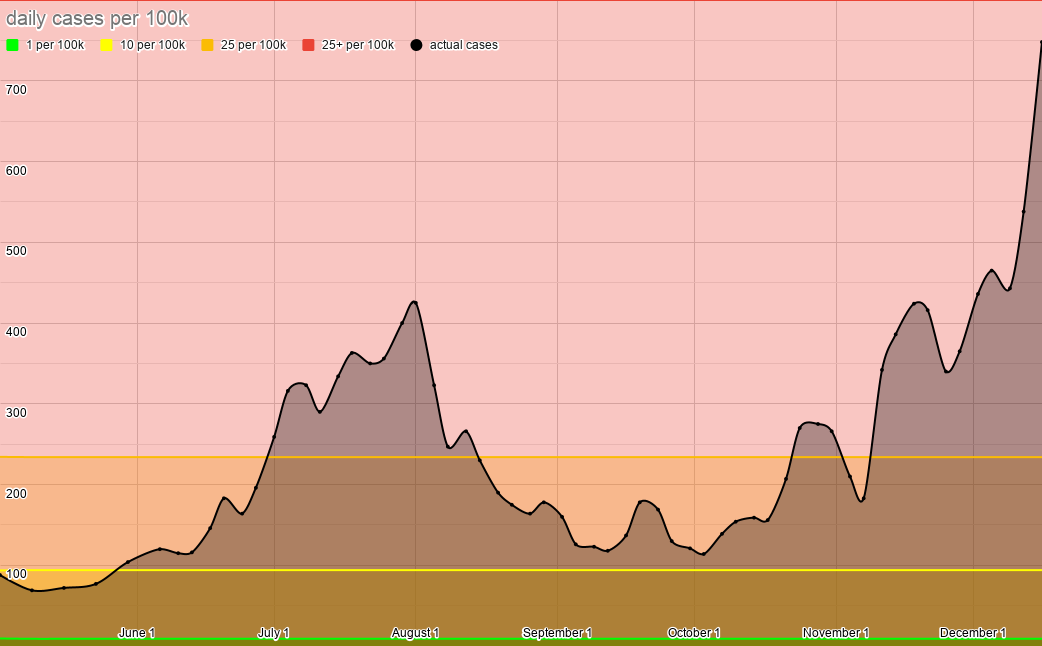
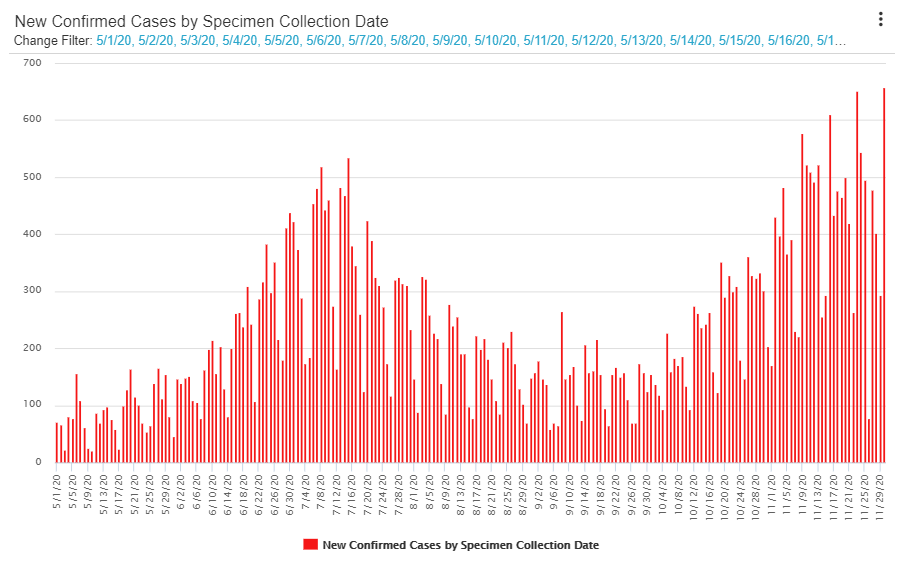
Case Rate
The Goal: < 10 daily cases per 100,000 ppl
The Data: 11.1 per 100k
We got down to 10.8 per 100k last wk, then cases ticked up slightly.
This is cause for concern, not alarm. We're holding at a relatively low case rate. But we need to get under 10 per 100k.
2/
The Goal: < 10 daily cases per 100,000 ppl
The Data: 11.1 per 100k
We got down to 10.8 per 100k last wk, then cases ticked up slightly.
This is cause for concern, not alarm. We're holding at a relatively low case rate. But we need to get under 10 per 100k.
2/
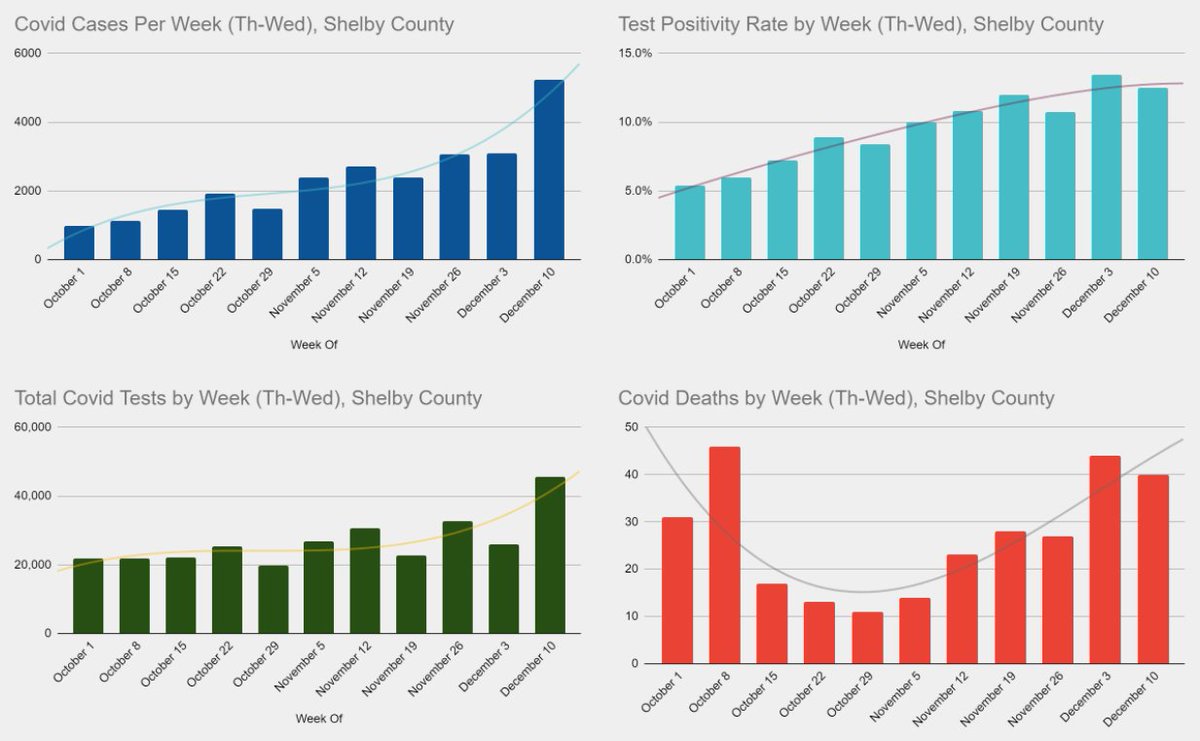
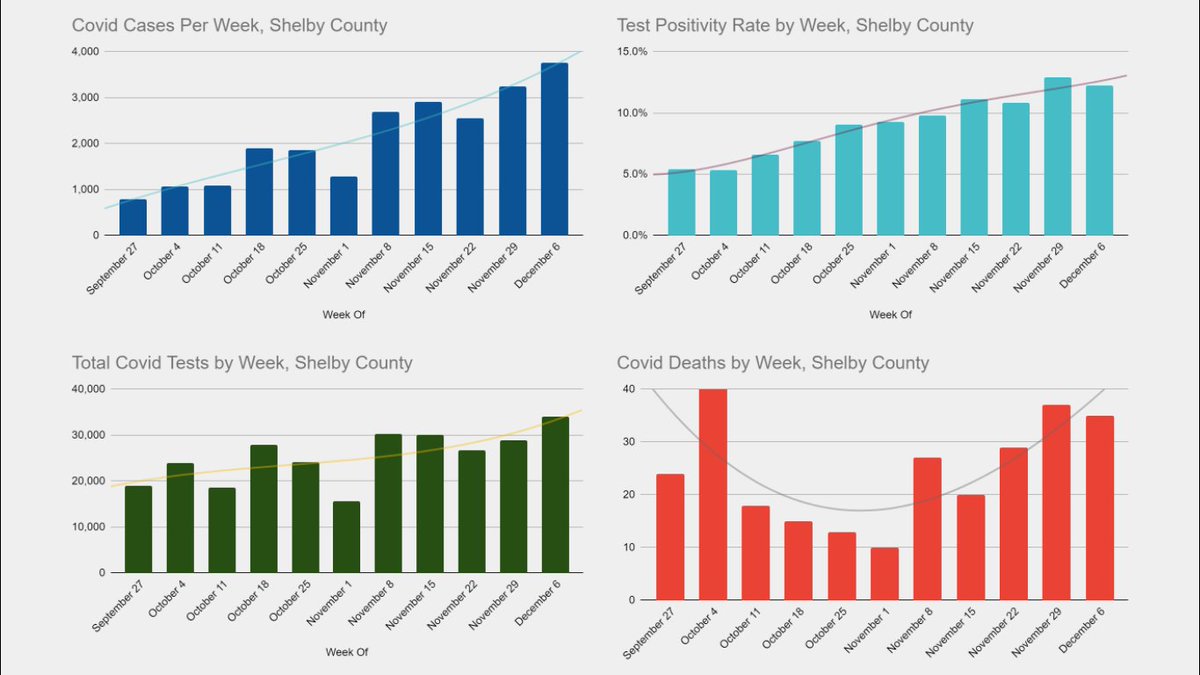
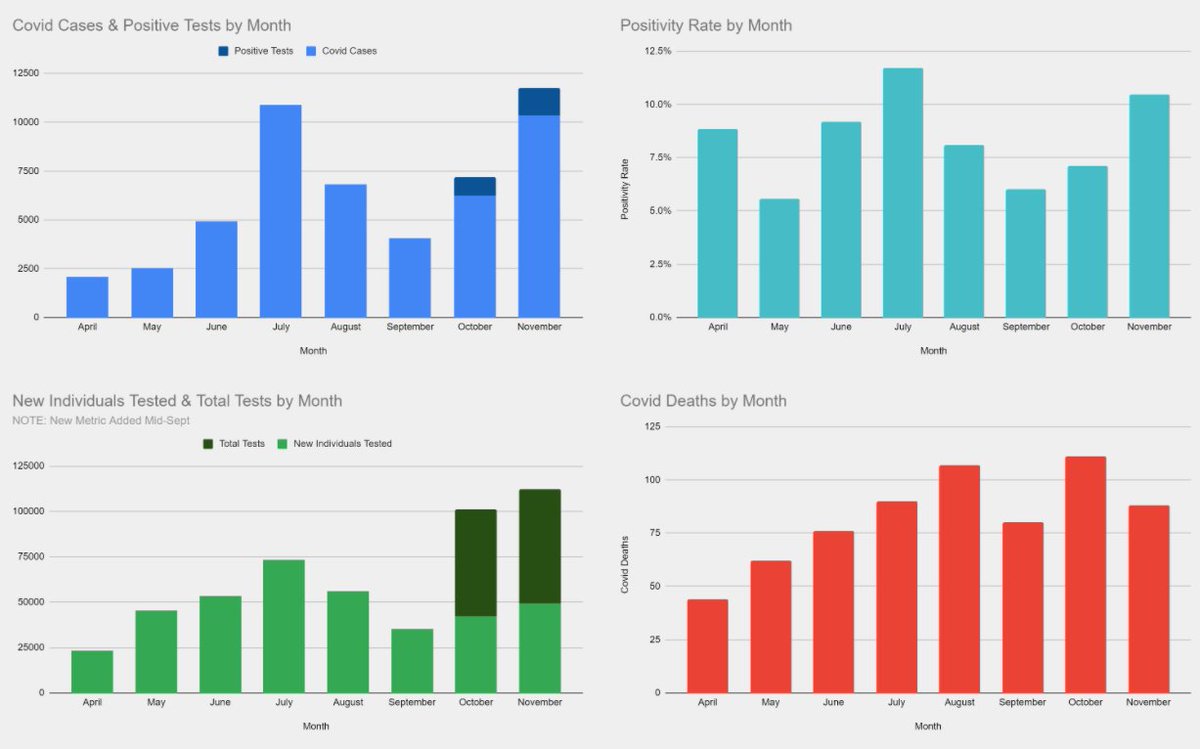
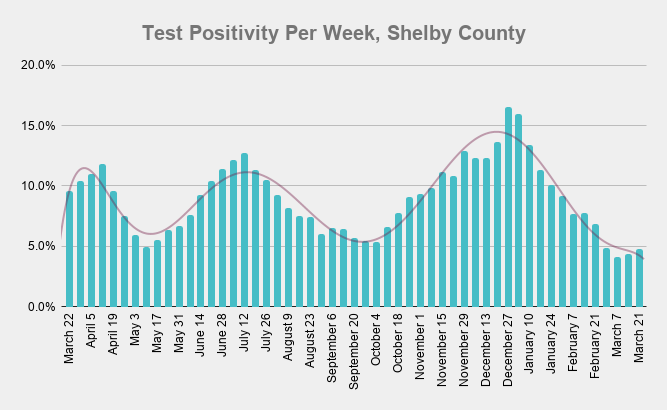
Test Positivity Rate
Goal: < 5%
Data: 4.8%
We got down to 4.1% two wks ago, but have ticked upward since.
Again, cause for concern, not alarm. We're still at a low rate, lower than any wk before the last two. But we need to reverse this trend and keep it under 5%.
3/
Goal: < 5%
Data: 4.8%
We got down to 4.1% two wks ago, but have ticked upward since.
Again, cause for concern, not alarm. We're still at a low rate, lower than any wk before the last two. But we need to reverse this trend and keep it under 5%.
3/
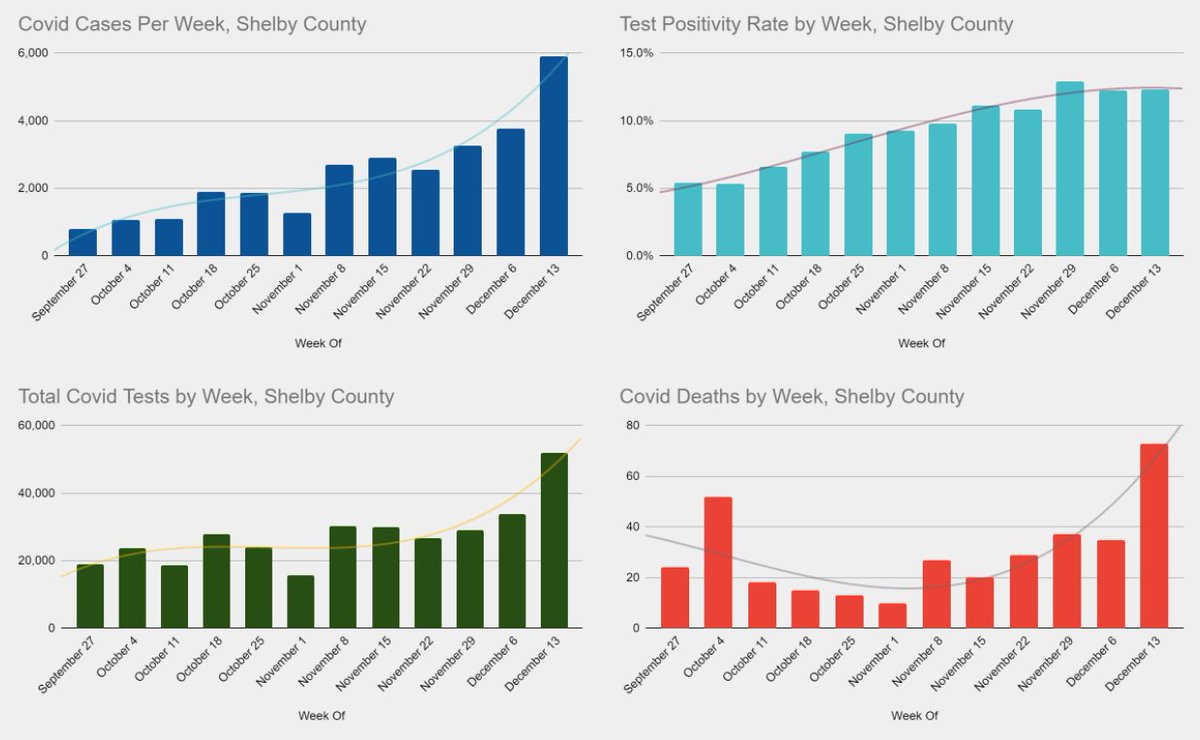
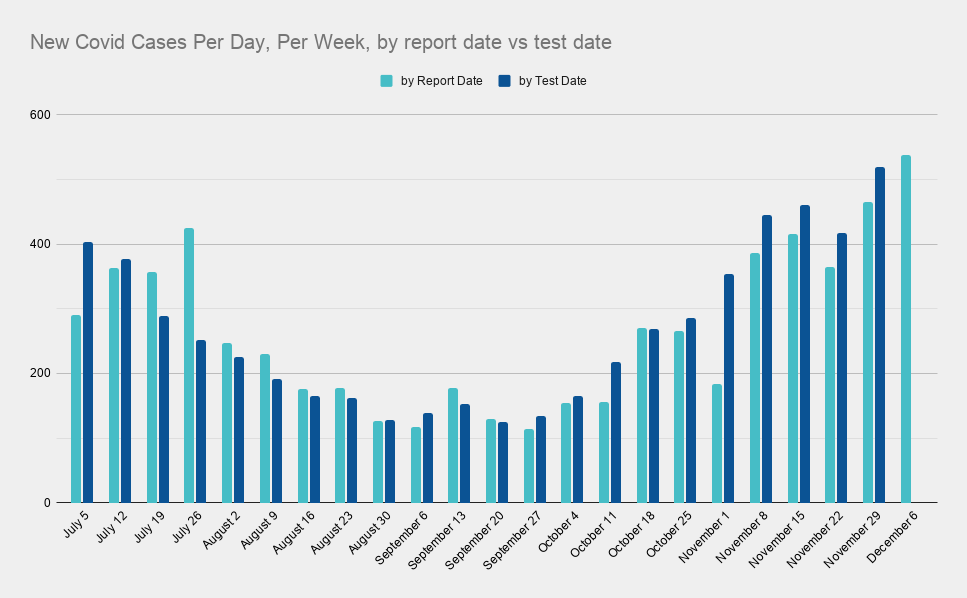
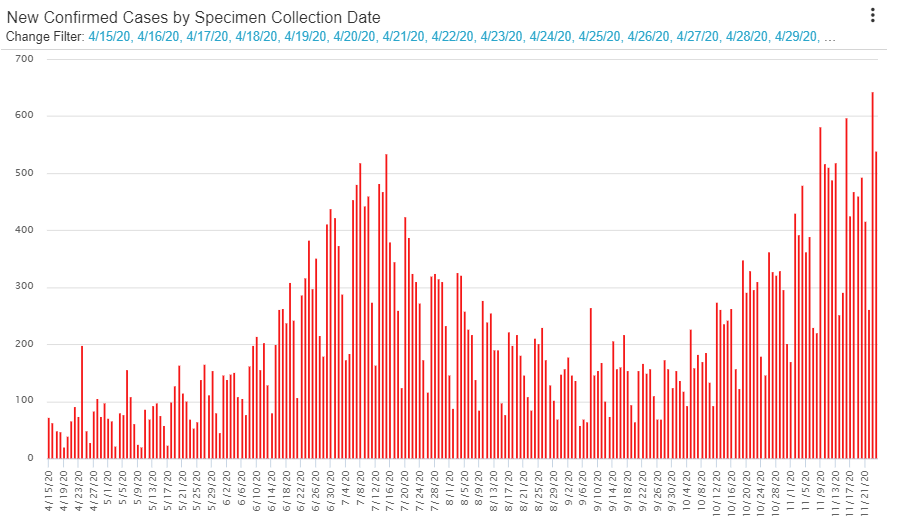
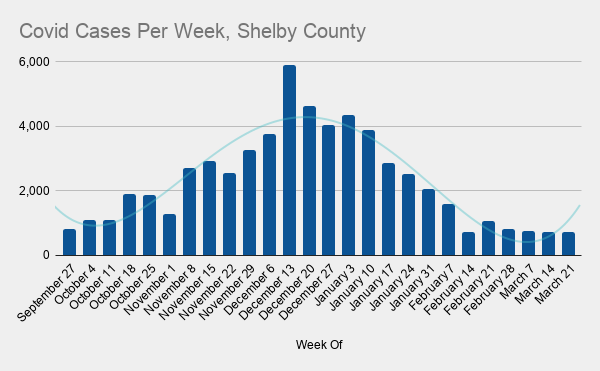
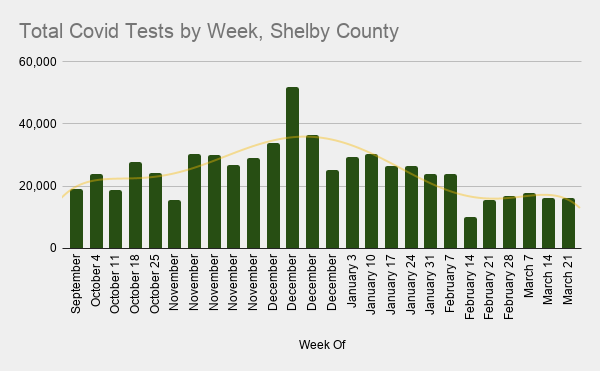
Cases Vs Tests
Testing is down. Meanwhile, cases are starting to rise, if only slightly. This is why the positivity rate is up. And it threatens our return to normality. We can't rush it.
1wk, +3% vs -1%
2wks, -3% vs -11%
3wks, -10% vs -5%
4/
Testing is down. Meanwhile, cases are starting to rise, if only slightly. This is why the positivity rate is up. And it threatens our return to normality. We can't rush it.
1wk, +3% vs -1%
2wks, -3% vs -11%
3wks, -10% vs -5%
4/
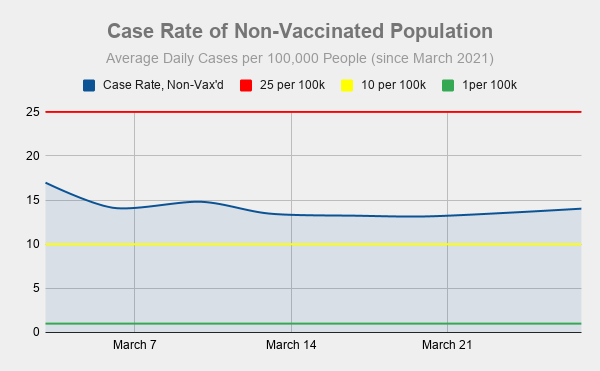
But it's important to keep in mind that the susceptible population is shrinking rapidly bc of vax's.
And when you start subtracting out vax'd ppl, the case rate among those who have not been vax'd is on the rise, up to 14.0 per 100k.
This is a concern.
5/
And when you start subtracting out vax'd ppl, the case rate among those who have not been vax'd is on the rise, up to 14.0 per 100k.
This is a concern.
5/
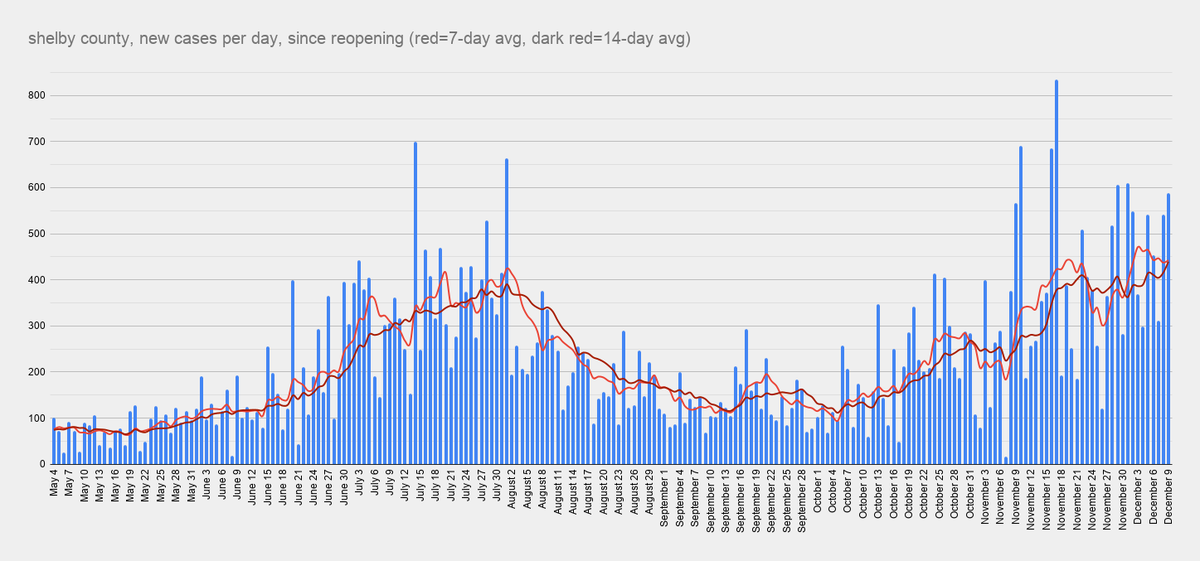
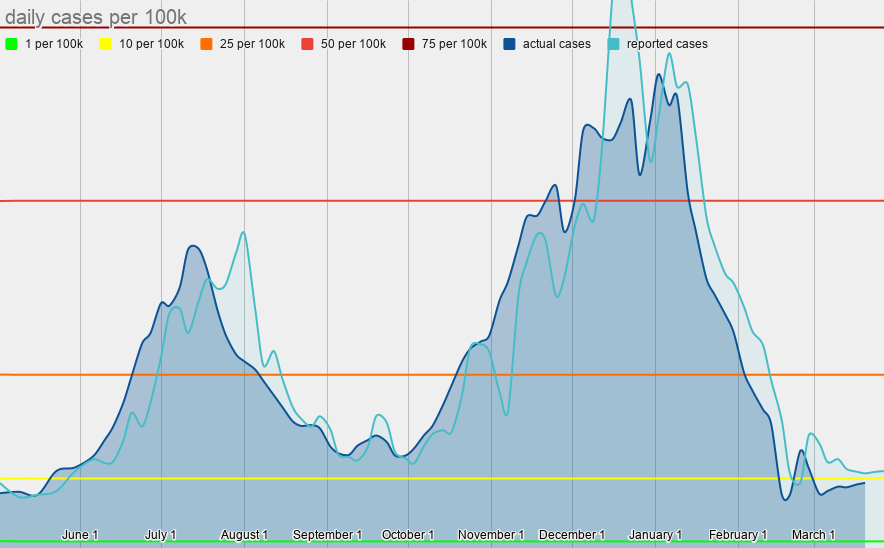
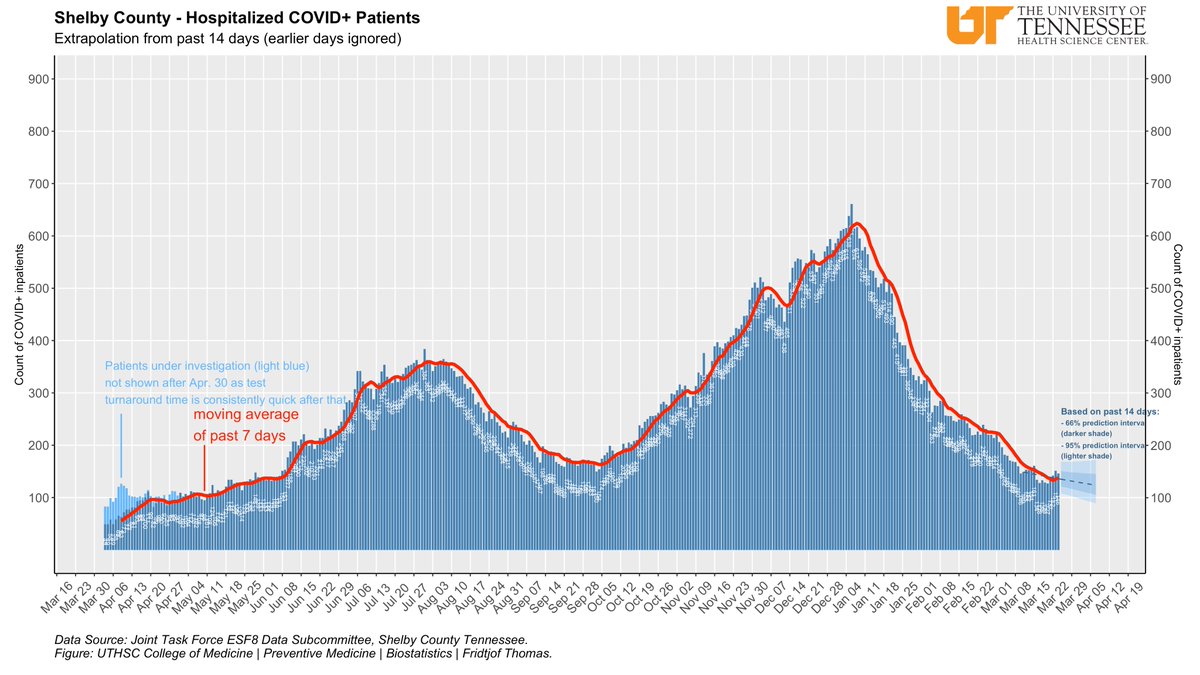
Covid Hospitalizations
As you can see, we've plateaued and even started rising again.
Again, this is more a cause for concern than alarm, as we're still at relatively low levels. But this is something to keep an eye on.
6/
As you can see, we've plateaued and even started rising again.
Again, this is more a cause for concern than alarm, as we're still at relatively low levels. But this is something to keep an eye on.
6/
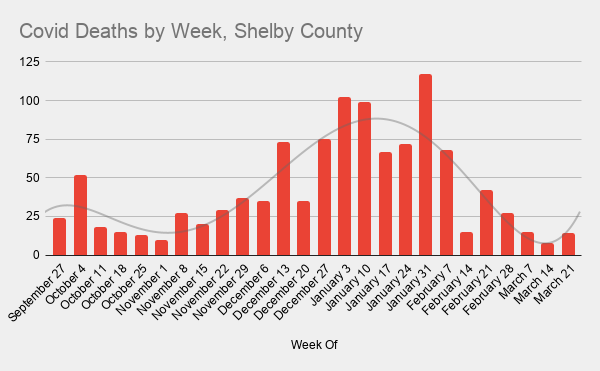
Deaths are up.
One wk doesn't make a trend, esp since there is usually a pretty substantial lag between the actual death and the date it's reported. And we're still at fairly low levels. So, again, nothing to be alarmed by yet. But we'll need to keep an eye on this.
7/
One wk doesn't make a trend, esp since there is usually a pretty substantial lag between the actual death and the date it's reported. And we're still at fairly low levels. So, again, nothing to be alarmed by yet. But we'll need to keep an eye on this.
7/
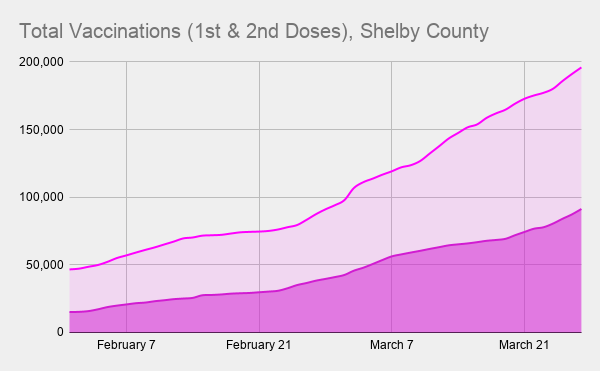
Vaccinations
Nearly 200,000 ppl have received at least one dose of vaccination. That's 21%, or 1 in every 5 ppl.
And since it's mostly adults getting vax'd, around 28% of adults are vax'd.
This is exciting, but we're not even halfway to our goal of 70% vax'd.
8/
Nearly 200,000 ppl have received at least one dose of vaccination. That's 21%, or 1 in every 5 ppl.
And since it's mostly adults getting vax'd, around 28% of adults are vax'd.
This is exciting, but we're not even halfway to our goal of 70% vax'd.
8/
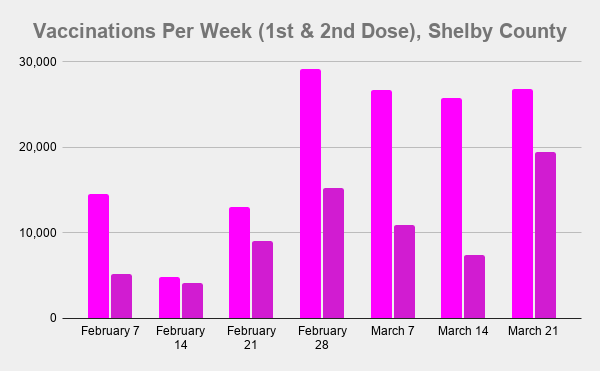
We administered 26,835 first doses + 19,410 second doses, for a total of 46,245 total doses this week. This is a significant increase, mainly driven by 2nd doses.
1wk, 2wks, 4wks
* 1st doses, +4%, +0%, +105%
* 2nd doses, +160%, +78%, +114%
* Total doses, +39%, +23%, +109%
8/
1wk, 2wks, 4wks
* 1st doses, +4%, +0%, +105%
* 2nd doses, +160%, +78%, +114%
* Total doses, +39%, +23%, +109%
8/
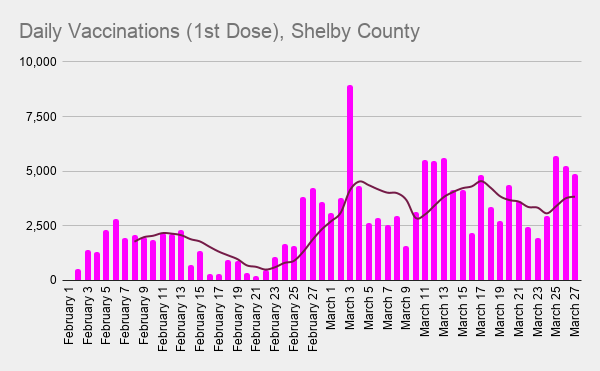
1st Doses
The bad news here is that we've essentially been flat for the past few wks.
The good news is that we jumped the past few days. Let's hope we can sustain this.
9/
The bad news here is that we've essentially been flat for the past few wks.
The good news is that we jumped the past few days. Let's hope we can sustain this.
9/
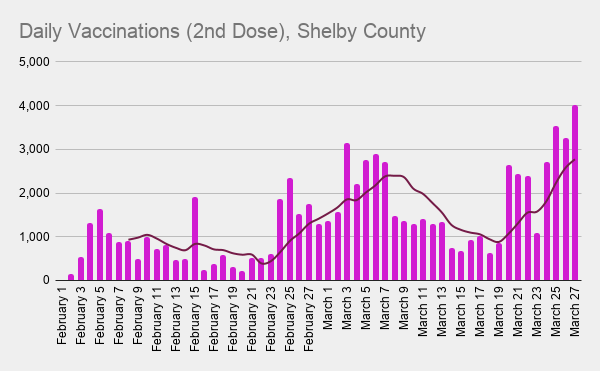
2nd Doses
Nothing but good news here.
Of course, the 2nd dose will follow the 1st, with a 3-4wk lag, which is why I predicted a big 2nd dose spike in last wk's report.
But since 1st doses have been flat the past few wks, expect 2nd doses to also be flat the next few wks.
10/
Nothing but good news here.
Of course, the 2nd dose will follow the 1st, with a 3-4wk lag, which is why I predicted a big 2nd dose spike in last wk's report.
But since 1st doses have been flat the past few wks, expect 2nd doses to also be flat the next few wks.
10/
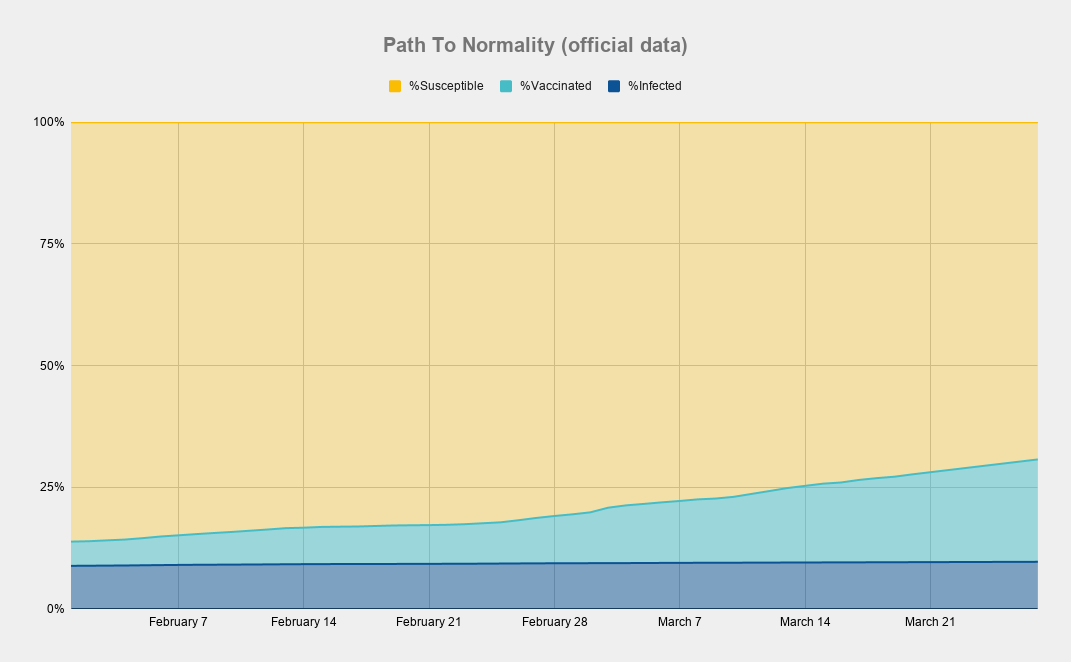
We've heard a lot of talk about "herd immunity."
Estimates are that 60-70% of the population needs immunity, either thru infection or vaccination, to essentially stop transmission.
We're at 21% vax'd & 10% infected (minus those who've been both).
11/
Estimates are that 60-70% of the population needs immunity, either thru infection or vaccination, to essentially stop transmission.
We're at 21% vax'd & 10% infected (minus those who've been both).
11/
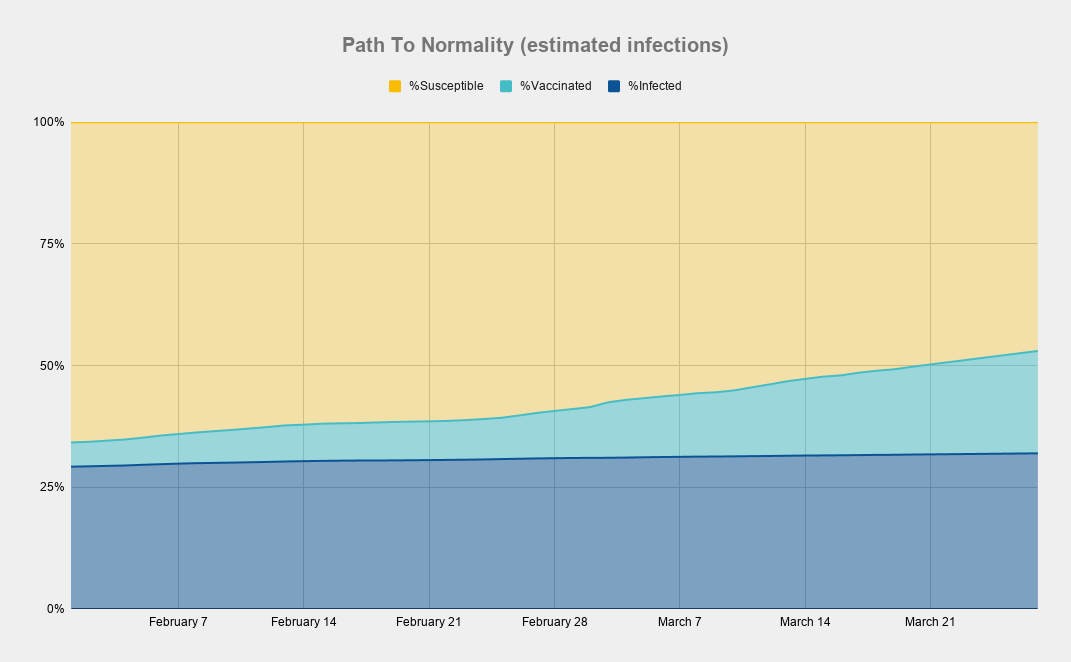
That said, our data likely significantly undercount infections bc of lack of testing. In fact, @youyanggu estimates that local infections are over 3x higher than reported.
With that in mind, over half of the population likely has some level of immunity.
12/
With that in mind, over half of the population likely has some level of immunity.
12/
We know that somewhere between 10% and 32% of the population has been infected at some point over the past year.
And we know that 21% has at least one dose of vax.
So between 69% and 47% are still susceptible.
That's a lot of ppl. And it's why we must stay vigilant.
13/
And we know that 21% has at least one dose of vax.
So between 69% and 47% are still susceptible.
That's a lot of ppl. And it's why we must stay vigilant.
13/
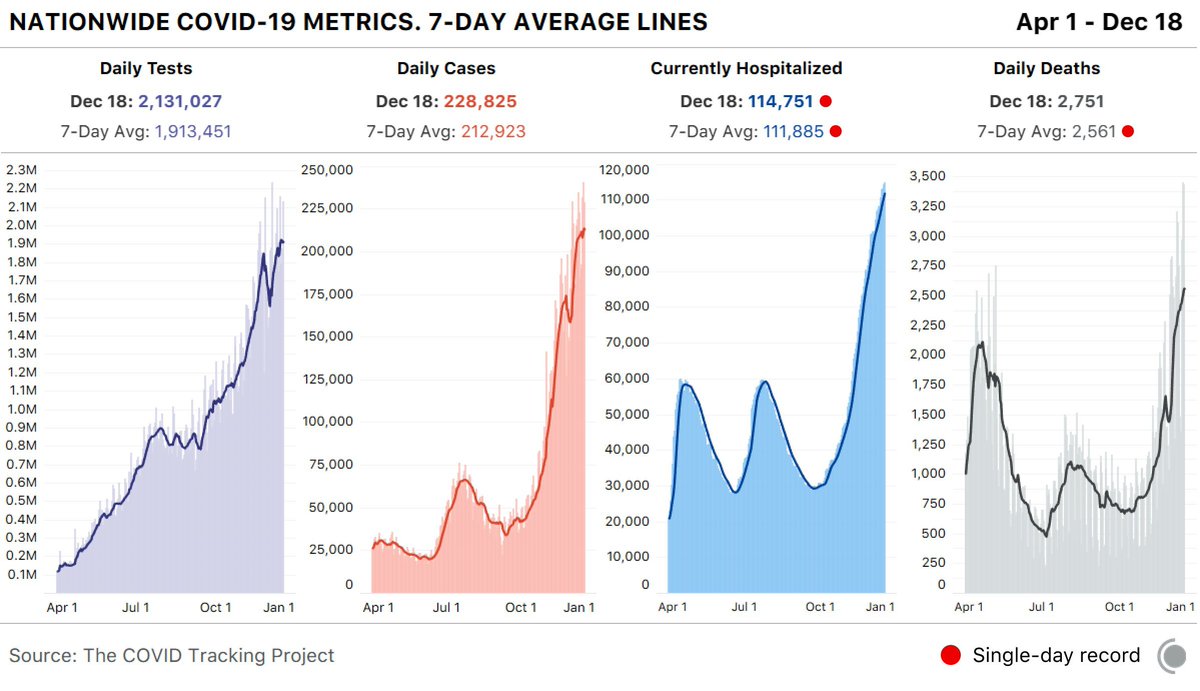
This pandemic is not over. We're already seeing cases rise, positivity rise, hospitalizations rise, deaths rise.
It's a race between the vaccines and the variants.
We've got to get more vax out. And we've got to take precautions against the variants.
14/
It's a race between the vaccines and the variants.
We've got to get more vax out. And we've got to take precautions against the variants.
14/
I'm hopeful. And I think you should be too. But I'm only hopeful bc we know how to beat this thing.
It's nothing new.
1) Vax.
2) Mask.
3) Distance.
4) Outdoors.
If we don't do these things, then I'm not hopeful.
But I think we can do it. What say you?
15/15
It's nothing new.
1) Vax.
2) Mask.
3) Distance.
4) Outdoors.
If we don't do these things, then I'm not hopeful.
But I think we can do it. What say you?
15/15
• • •
Missing some Tweet in this thread? You can try to
force a refresh