Apr 2
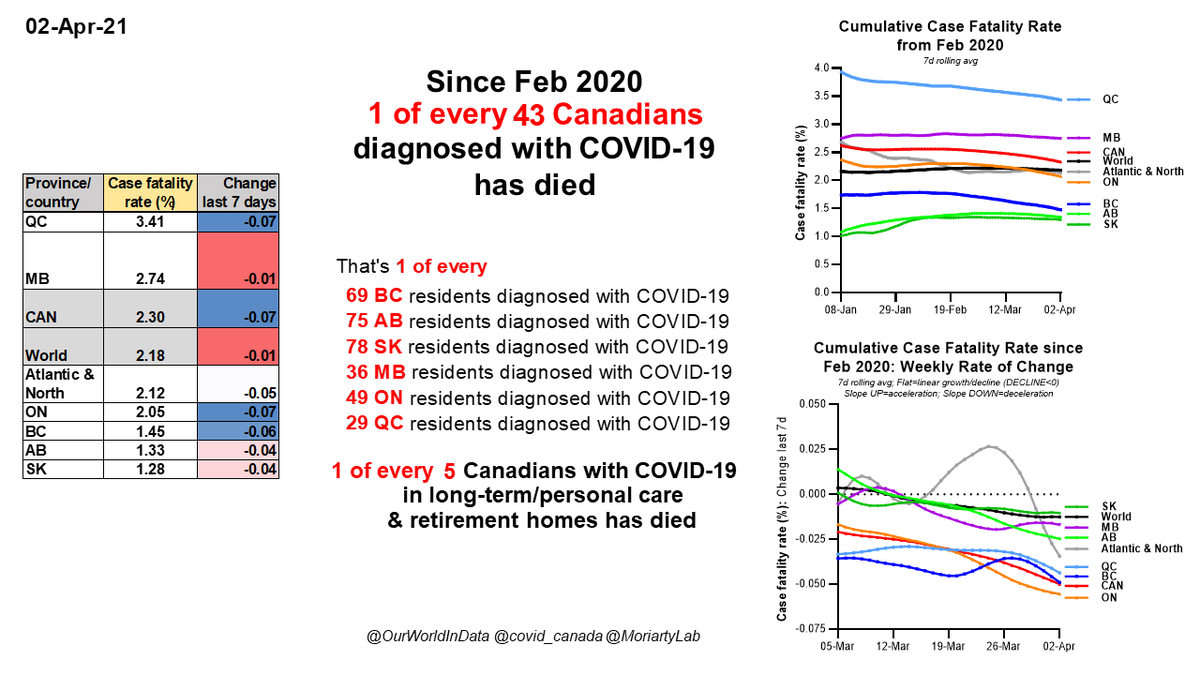
1 of every 43 #Canadians with #COVID19 has died since Feb 2020
1 in 69 BC
1 in 75 AB
1 in 78 SK
1 in 36 MB
1 in 49 ON
1 in 29 QC
1 of every 5 Cdns w/ C19 in long-term care & retirement homes has died
LAST 28 DAYS: 817 deaths, 1,335 LTC/RH cases, 368 LTC/RH deaths
1 of every 43 #Canadians with #COVID19 has died since Feb 2020
1 in 69 BC
1 in 75 AB
1 in 78 SK
1 in 36 MB
1 in 49 ON
1 in 29 QC
1 of every 5 Cdns w/ C19 in long-term care & retirement homes has died
LAST 28 DAYS: 817 deaths, 1,335 LTC/RH cases, 368 LTC/RH deaths
Apr 2
-#COVID19 is in top 4 largest mortality events in #Canadian history
-Last 28 days: 817 Canadians died of C19
-If every week is like this week, 834 Canadians may die in next 28 days
-#COVID19 is in top 4 largest mortality events in #Canadian history
-Last 28 days: 817 Canadians died of C19
-If every week is like this week, 834 Canadians may die in next 28 days

Apr 2
#COVID19 #Canada
CASE FATALITY RATES
Wave 1 (to Aug 17)
Wave 2 (to Feb 18)
Wave 3 (Feb 19 to date)
#COVID19 #Canada
CASE FATALITY RATES
Wave 1 (to Aug 17)
Wave 2 (to Feb 18)
Wave 3 (Feb 19 to date)

Apr 2
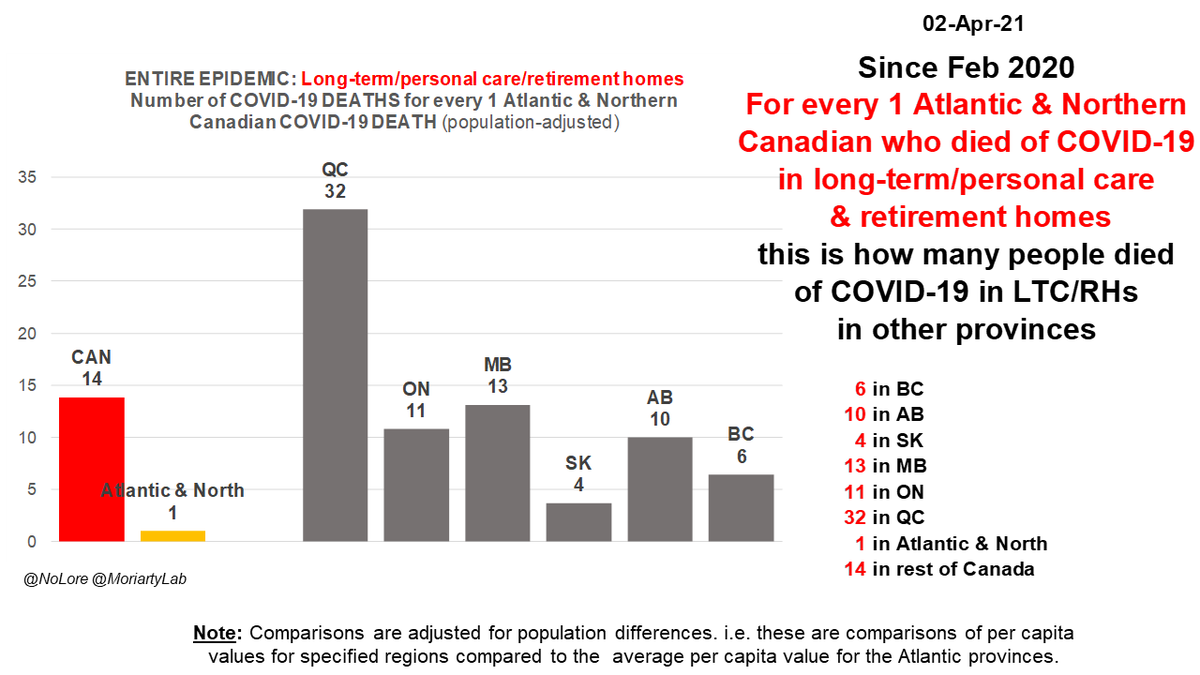
Since Feb 2020
For every 1 Atlantic & Northern #Canadian who DIED of #COVID19 this many people died of COVID-19 in other regions*
BC 7X
AB 11X
SK 9X
MB 16X
ON 12X
QC 30X
Rest of #Canada 14X
Rest of World 9X
*after adjusting for population differences
Since Feb 2020
For every 1 Atlantic & Northern #Canadian who DIED of #COVID19 this many people died of COVID-19 in other regions*
BC 7X
AB 11X
SK 9X
MB 16X
ON 12X
QC 30X
Rest of #Canada 14X
Rest of World 9X
*after adjusting for population differences

Apr 2
#COVID19 #Canada DEATHS since Feb 2020
Table: Deaths/100K & change last 7 days for provinces, Canada, rest of world
Graphs
-Total deaths (mid top)
-Total deaths per 100K (mid bottom)
-Wkly rate of change in deaths (bottom right)
#COVID19 #Canada DEATHS since Feb 2020
Table: Deaths/100K & change last 7 days for provinces, Canada, rest of world
Graphs
-Total deaths (mid top)
-Total deaths per 100K (mid bottom)
-Wkly rate of change in deaths (bottom right)


Apr 2
1 of every 5 #Canadians with #COVID19 in long-term/ personal care & retirement homes has died since Feb 2020
1 in 5 BC
1 in 7 AB
1 in 5 SK
1 in 4 MB
1 in 8 ON
1 in 4 QC
There are 1,335 LTC/RH cases in last 28 days
1 of every 5 #Canadians with #COVID19 in long-term/ personal care & retirement homes has died since Feb 2020
1 in 5 BC
1 in 7 AB
1 in 5 SK
1 in 4 MB
1 in 8 ON
1 in 4 QC
There are 1,335 LTC/RH cases in last 28 days

Apr 2
#COVID19 #Canada
Long-term care/retirement home CASE FATALITY RATES
Wave 1 (to Aug 17)
Wave 2 (to Feb 18)
Wave 3 (Feb 19 to date)
Note: some of deaths reported in W3 may have happened in W2 due to slow reporting in this sector.
#COVID19 #Canada
Long-term care/retirement home CASE FATALITY RATES
Wave 1 (to Aug 17)
Wave 2 (to Feb 18)
Wave 3 (Feb 19 to date)
Note: some of deaths reported in W3 may have happened in W2 due to slow reporting in this sector.

Apr 2
Since Feb 2020
For every 1 Atlantic and Northern #Canadian in long-term care & retirement homes who DIED of #COVID19, this many people in LTC/RHs died of C19 in other regions*
BC 6X
AB 10X
SK 4X
MB 13X
ON 11X
QC 32X
#Canada 14X
*adjusted for population differences
Since Feb 2020
For every 1 Atlantic and Northern #Canadian in long-term care & retirement homes who DIED of #COVID19, this many people in LTC/RHs died of C19 in other regions*
BC 6X
AB 10X
SK 4X
MB 13X
ON 11X
QC 32X
#Canada 14X
*adjusted for population differences
Apr 2
#COVID19 #Canada long-term care & retirement home DEATHS since Feb 2020
Tables: Per capita deaths + change last 7 days, % total deaths in LTC/RH
Graphs:
-Total & per capita values (L)
-% total deaths in LTC/RH (R top)
#COVID19 #Canada long-term care & retirement home DEATHS since Feb 2020
Tables: Per capita deaths + change last 7 days, % total deaths in LTC/RH
Graphs:
-Total & per capita values (L)
-% total deaths in LTC/RH (R top)

Apr 2
#COVID19 #Canada
Long-term care/retirement homes
-DEATHS/100K
-% TOTAL DEATHS IN LTC/RH
Wave 1 (to Aug 17)
Wave 2 (to Feb 18)
Wave 3 (Feb 19 to date)
#COVID19 #Canada
Long-term care/retirement homes
-DEATHS/100K
-% TOTAL DEATHS IN LTC/RH
Wave 1 (to Aug 17)
Wave 2 (to Feb 18)
Wave 3 (Feb 19 to date)

Mar-Nov 14, 2020
For every excess death of Atlantic and Northern Canadians 45+ years
This is how many excess deaths in same age group there were in other regions (after adjusting for toxic drug deaths)
BC 20X
AB 10X
SK 15X
MB 8X
ON 19X
QC 35X
Canada outside Atlantic, North 21X
For every excess death of Atlantic and Northern Canadians 45+ years
This is how many excess deaths in same age group there were in other regions (after adjusting for toxic drug deaths)
BC 20X
AB 10X
SK 15X
MB 8X
ON 19X
QC 35X
Canada outside Atlantic, North 21X

Mar-Nov 14, 2020
#COVID19 #Canada
Estimated excess deaths/100K in different age groups (all, 45+, 65+) compared to reported C19 deaths and C19 deaths estimated from seroprevalence data and current case fatality rates
Estimated excess deaths are adjusted for toxic drug deaths.
#COVID19 #Canada
Estimated excess deaths/100K in different age groups (all, 45+, 65+) compared to reported C19 deaths and C19 deaths estimated from seroprevalence data and current case fatality rates
Estimated excess deaths are adjusted for toxic drug deaths.

Mar-Nov 14, 2020
#COVID19 #Canada
Reported C19 deaths/100K over time compared to estimated excess deaths/100K in different age groups (all, 45+, 65+)
Estimated excess deaths are adjusted for toxic drug deaths.
#COVID19 #Canada
Reported C19 deaths/100K over time compared to estimated excess deaths/100K in different age groups (all, 45+, 65+)
Estimated excess deaths are adjusted for toxic drug deaths.

Mar-Nov 14, 2020
#COVID19 #Canada
Reported C19 deaths/100K over time compared to estimated excess deaths/100K in different age and sex groups (all, 45+, 65+)
Estimated excess deaths are adjusted for toxic drug deaths.
#COVID19 #Canada
Reported C19 deaths/100K over time compared to estimated excess deaths/100K in different age and sex groups (all, 45+, 65+)
Estimated excess deaths are adjusted for toxic drug deaths.

Mar-Nov 14, 2020
#COVID19 Atlantic & Northern #Canada
Reported C19 deaths/100K over time compared to estimated excess deaths/100K in different age and sex groups (all, 45+, 65+)
Estimated excess deaths are adjusted for toxic drug deaths.
#COVID19 Atlantic & Northern #Canada
Reported C19 deaths/100K over time compared to estimated excess deaths/100K in different age and sex groups (all, 45+, 65+)
Estimated excess deaths are adjusted for toxic drug deaths.

Mar-Nov 14, 2020
#COVID19 #Quebec
Reported C19 deaths/100K over time compared to estimated excess deaths/100K in different age and sex groups (all, 45+, 65+)
Estimated excess deaths are adjusted for toxic drug deaths.
#COVID19 #Quebec
Reported C19 deaths/100K over time compared to estimated excess deaths/100K in different age and sex groups (all, 45+, 65+)
Estimated excess deaths are adjusted for toxic drug deaths.

Mar-Nov 14, 2020
#COVID19 #Manitoba
Reported C19 deaths/100K over time compared to estimated excess deaths/100K in different age and sex groups (all, 45+, 65+)
Estimated excess deaths are adjusted for toxic drug deaths.
#COVID19 #Manitoba
Reported C19 deaths/100K over time compared to estimated excess deaths/100K in different age and sex groups (all, 45+, 65+)
Estimated excess deaths are adjusted for toxic drug deaths.

Mar-Nov 14, 2020
#COVID19 #Ontario
Reported C19 deaths/100K over time compared to estimated excess deaths/100K in different age and sex groups (all, 45+, 65+)
Estimated excess deaths are adjusted for toxic drug deaths.
#COVID19 #Ontario
Reported C19 deaths/100K over time compared to estimated excess deaths/100K in different age and sex groups (all, 45+, 65+)
Estimated excess deaths are adjusted for toxic drug deaths.

Mar-Nov 14, 2020
#COVID19 #Alberta
Reported C19 deaths/100K over time compared to estimated excess deaths/100K in different age and sex groups (all, 45+, 65+)
Estimated excess deaths are adjusted for toxic drug deaths.
#COVID19 #Alberta
Reported C19 deaths/100K over time compared to estimated excess deaths/100K in different age and sex groups (all, 45+, 65+)
Estimated excess deaths are adjusted for toxic drug deaths.

Mar-Nov 14, 2020
#COVID19 #Saskatchewan
Reported C19 deaths/100K over time compared to estimated excess deaths/100K in different age and sex groups (all, 45+, 65+)
Estimated excess deaths are adjusted for toxic drug deaths.
#COVID19 #Saskatchewan
Reported C19 deaths/100K over time compared to estimated excess deaths/100K in different age and sex groups (all, 45+, 65+)
Estimated excess deaths are adjusted for toxic drug deaths.

Mar-Nov 14, 2020
#COVID19 #BritishColumbia
Reported C19 deaths/100K over time compared to estimated excess deaths/100K in different age and sex groups (all, 45+, 65+)
Estimated excess deaths are adjusted for toxic drug deaths.
#COVID19 #BritishColumbia
Reported C19 deaths/100K over time compared to estimated excess deaths/100K in different age and sex groups (all, 45+, 65+)
Estimated excess deaths are adjusted for toxic drug deaths.

Apr 2
Since Feb 2020
For every 1 Atlantic & Northern #Canadian DIAGNOSED with #COVID19 this many people were diagnosed with COVID-19 in other regions*
BC 10X
AB 17X
SK 15X
MB 13X
ON 13X
QC 19X
Rest of #Canada 13X
Rest of World 8X
*after adjusting for population differences
Since Feb 2020
For every 1 Atlantic & Northern #Canadian DIAGNOSED with #COVID19 this many people were diagnosed with COVID-19 in other regions*
BC 10X
AB 17X
SK 15X
MB 13X
ON 13X
QC 19X
Rest of #Canada 13X
Rest of World 8X
*after adjusting for population differences

Apr 2
#COVID19 #Canada CASES since Feb 2020
Table: Cases/100K & change last 7 days for provinces, Canada, rest of world
Graphs
-Total cases (mid top)
-Total cases per 100K (mid bottom)
-Wkly rate of change in cases (bottom right)
#COVID19 #Canada CASES since Feb 2020
Table: Cases/100K & change last 7 days for provinces, Canada, rest of world
Graphs
-Total cases (mid top)
-Total cases per 100K (mid bottom)
-Wkly rate of change in cases (bottom right)


Apr 2
Since Feb 2020
For every 1 Atlantic & Northern #Canadian in long-term care & retirement homes DIAGNOSED with #COVID19, this many people in LTC/RHs were DIAGNOSED in other regions*
BC 4X
AB 9X
SK 2X
MB 7X
ON 10X
QC 15X
#Canada 9X
*adjusted for population differences
Since Feb 2020
For every 1 Atlantic & Northern #Canadian in long-term care & retirement homes DIAGNOSED with #COVID19, this many people in LTC/RHs were DIAGNOSED in other regions*
BC 4X
AB 9X
SK 2X
MB 7X
ON 10X
QC 15X
#Canada 9X
*adjusted for population differences

Apr 2
#COVID19 #Canada long-term care & retirement home CASES since Feb 2020
Tables: Per capita cases + change last 7 days, % total cases in LTC/RH
Graphs:
-Total & per capita values (L)
-% total cases in LTC/RH (R top)
#COVID19 #Canada long-term care & retirement home CASES since Feb 2020
Tables: Per capita cases + change last 7 days, % total cases in LTC/RH
Graphs:
-Total & per capita values (L)
-% total cases in LTC/RH (R top)

Apr 2
#COVID19 #Canada
Long-term care/retirement homes
-CASES/100K
-% TOTAL CASES IN LTC/RH
Wave 1 (to Aug 17)
Wave 2 (to Feb 18)
Wave 3 (Feb 19 to date)
#COVID19 #Canada
Long-term care/retirement homes
-CASES/100K
-% TOTAL CASES IN LTC/RH
Wave 1 (to Aug 17)
Wave 2 (to Feb 18)
Wave 3 (Feb 19 to date)

Apr 2
WHAT TO WATCH FOR:
-Weekly rate of change in CASES
WHY?
This shows:
1) if our efforts over the last month are helping
2) when there are warning signs that epidemic may be speeding up again.
WHAT TO WATCH FOR:
-Weekly rate of change in CASES
WHY?
This shows:
1) if our efforts over the last month are helping
2) when there are warning signs that epidemic may be speeding up again.

Apr 2
WHAT TO WATCH FOR:
-Weekly rate of change in HOSPITALIZATIONS
WHY?
This shows:
1) if our efforts over the last month are helping
2) when there are warning signs that hospitalizations may be speeding up again.
WHAT TO WATCH FOR:
-Weekly rate of change in HOSPITALIZATIONS
WHY?
This shows:
1) if our efforts over the last month are helping
2) when there are warning signs that hospitalizations may be speeding up again.

Apr 2
WHAT TO WATCH FOR:
-Weekly rate of change in DEATHS
WHY?
Shows:
1) if efforts ONE MONTH AGO helped
2) warning clues if deaths may be speeding up
ALSO: Rates of change in deaths help us estimate effects of measures such as vaccination in LTC/RHs, where reporting is slow
WHAT TO WATCH FOR:
-Weekly rate of change in DEATHS
WHY?
Shows:
1) if efforts ONE MONTH AGO helped
2) warning clues if deaths may be speeding up
ALSO: Rates of change in deaths help us estimate effects of measures such as vaccination in LTC/RHs, where reporting is slow

Link to explainer of excess mortality estimates and what they mean:
https://twitter.com/MoriartyLab/status/1370498078063656961?s=20
Sources of collated official data (in addition to @StatsCan_eng & provincial sites), with huge thanks:
@NoLore
@RyersonNIA
@CU_IIJ
@covid_canada
@OurWorldInData
Thank you to everyone protecting themselves & others by choosing vaccination.
/end
@NoLore
@RyersonNIA
@CU_IIJ
@covid_canada
@OurWorldInData
Thank you to everyone protecting themselves & others by choosing vaccination.
/end

• • •
Missing some Tweet in this thread? You can try to
force a refresh