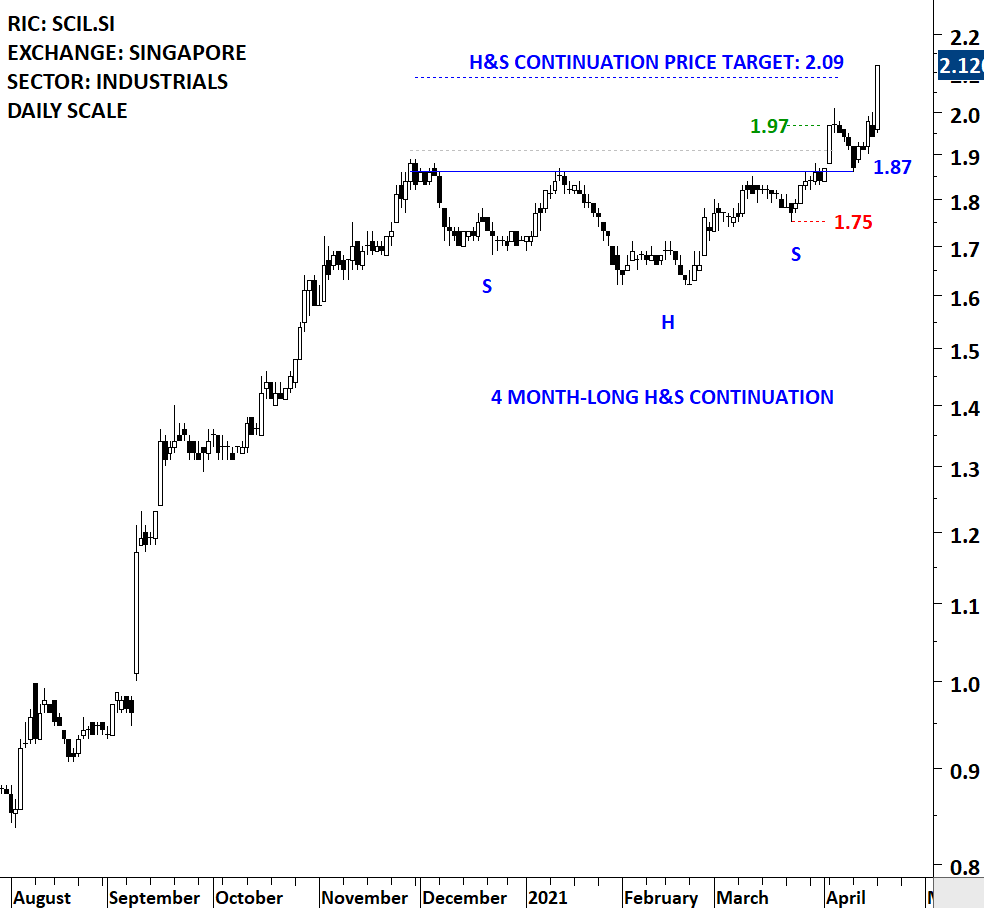
Edwards & Magee discussed H&S acting as a continuation chart pattern with a 1936 example. Somewhere in between, new smart authors, thought new generation chartists that H&S can only form as a top or bottom reversal. WRONG.
Another H&S continuation example, this time on weekly scale. A recent #breakout#alert on Tech Charts. #SWEDEN MOMENTUM GROUP reached its chart pattern price target. As you can see I find this repetitive chart pattern on #GLOBAL#EQUITIES. It is H&S acting as continuation.
• • •
Missing some Tweet in this thread? You can try to
force a refresh
The next 3 tweets will show you that all you need is a clean chart (no indicators) a ruler and a pencil to identify a possible trend period to profit from.
Before we start, our template:
1 year of data on daily scale
Candlestick chart
(my preference white background)
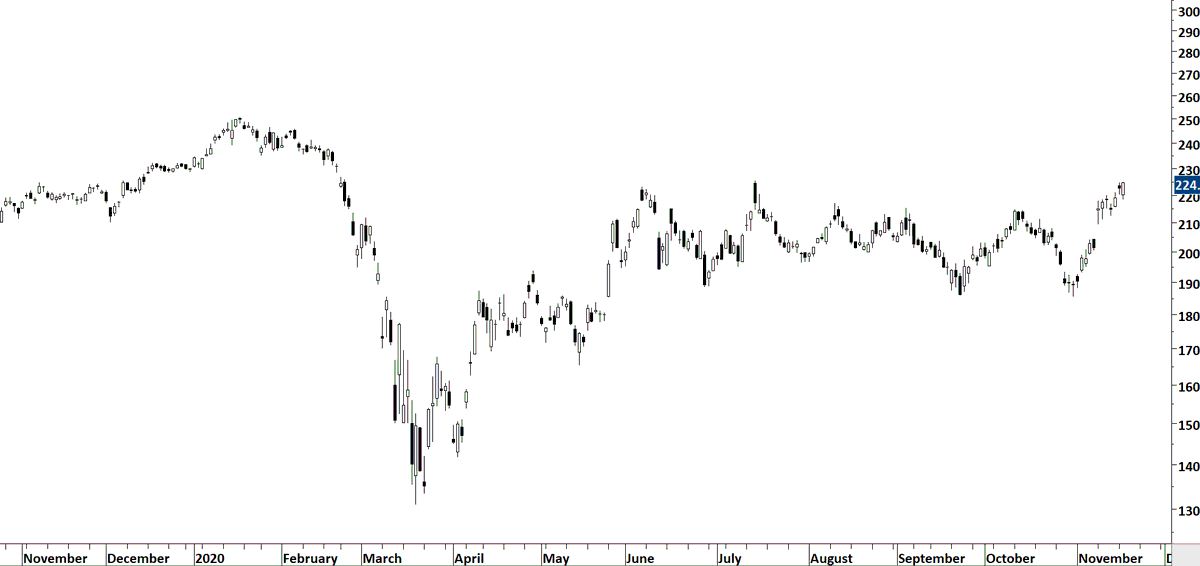
When you open your chart you will see this. Are you able to identify the lengthy and sideways consolidation?
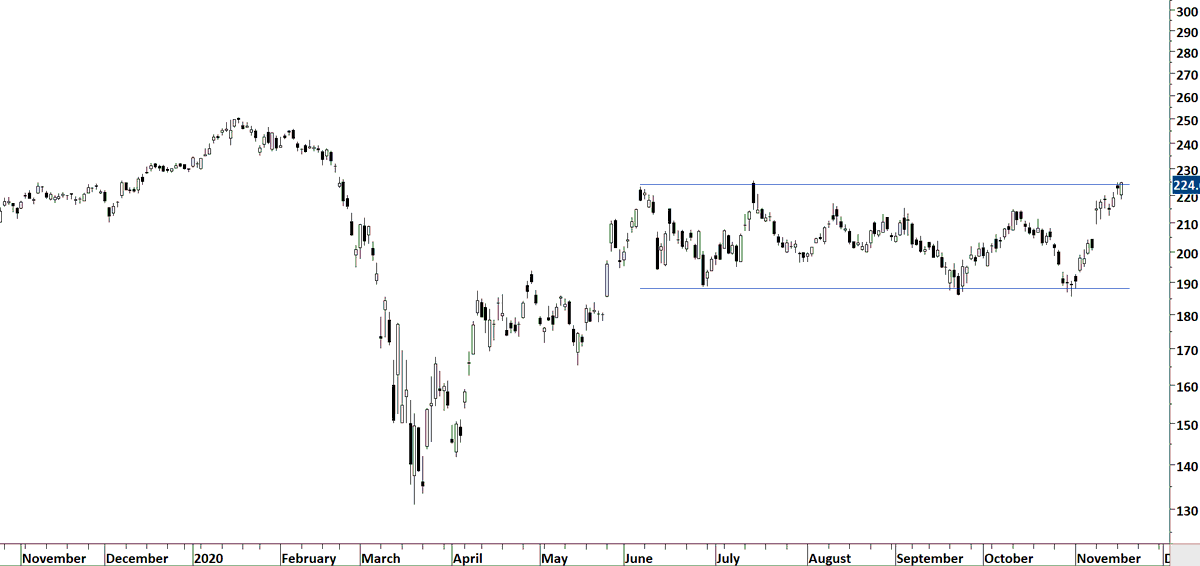
Are you able to draw horizontal boundaries that will be a well-defined rectangle?
Consolidations are usually followed by trend periods. We want to capture that.
Did you draw the boundaries like this? Do we have several tests?
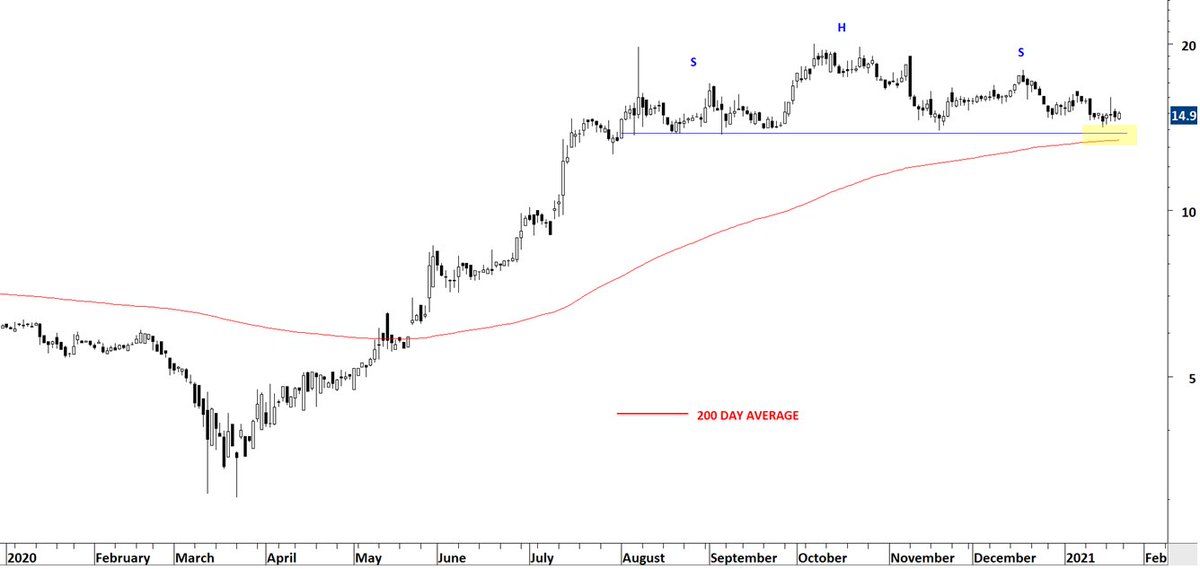
I like to combine classical charting signals with the trend filter (200-day average). A breakdown should take place below the 200-day average and a breakout should take place above the 200-day average.
I.e. breakdown of the neckline will also clear the 200-day average.
Here is a good example where the long-term trend dictated the direction of the breakout. Failure to complete the H&S top and breakdown below the 200-day average acted as a great long signal with the breach of right shoulder high.
Edwards & Magee in their book Technical Analysis of Stock Trends, discussed the H&S failure with this example from 1936. Classical chart patterns are timeless.
Currently charts I'm paying close attention to has similar patterns as the one below (name is not important).
From a classical charting + technical analysis perspective I will discuss 3 different inflection points and strategies.
1⃣ Stock completes a H&S top from low volatility condition. Breakdown takes place below the 200-day average. A sell signal (classical charting principles)
2⃣ Stock re-tests lows. Possibility of double bottom but very early stages. A possible buy signal can be justified with only using technical analysis (support/resistance concept). Buy at support, sell at resistance.
This is not a breakout strategy. A mean reversion strategy.
You can utilize chart patterns in two different ways.
1) Trade price between well-defined boundaries (need to find a clear chart pattern at early stages)
2) Trade breakouts through chart pattern boundaries
I favor 2.
Following examples will highlight why I favor:
1⃣Breakout strategies
2⃣Horiozontal chart pattern breakouts
3⃣Rectangle setups with several tests of chart pattern boundary
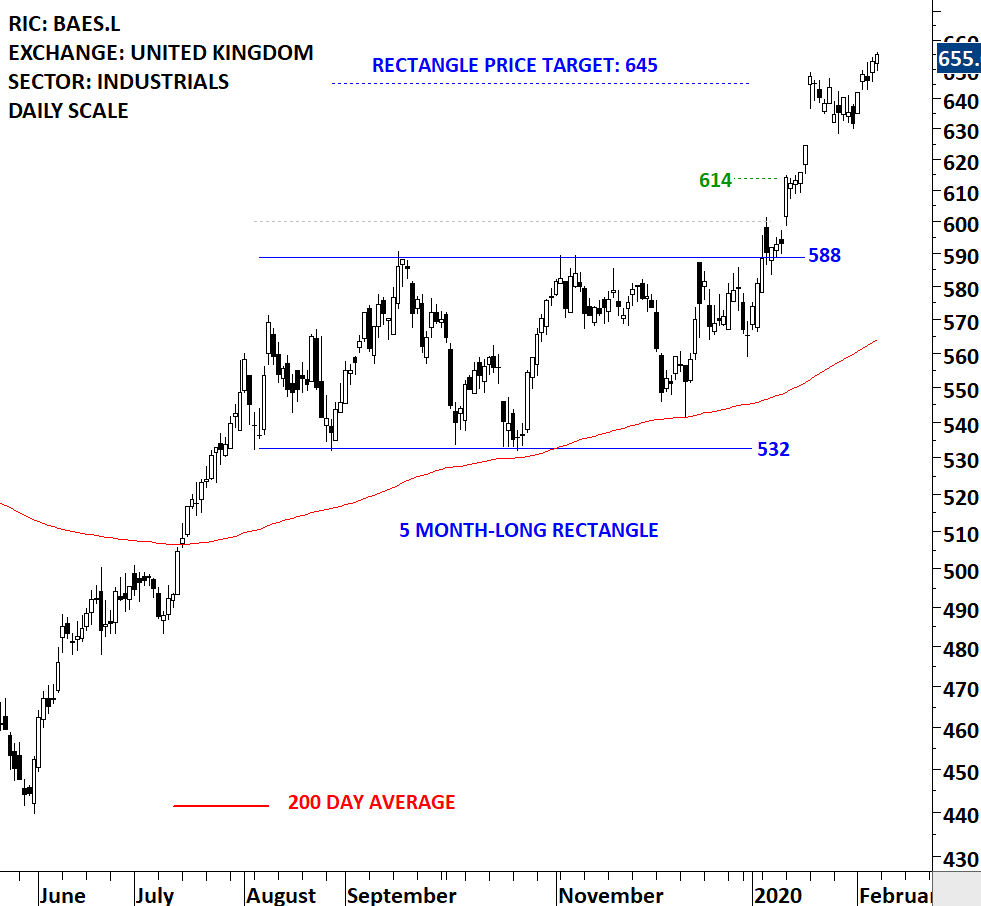
BAE SYSTEMS. Breakout after several tests of well-defined horizontal boundary. No pullback and challenge to chart pattern boundary. Bullish continuation completing above 200-day. #RECENT#BREAKOUT#ALERT#UK#FTSE
1⃣Breakout without any retest
2⃣Breakout with a re-test
3⃣Breakout with a hard re-test
4⃣Failed breakout
Following tweets explain each one of those with examples from recent breakout alerts
1⃣ Breakout without any retest
If you have a stop-loss placed below the chart pattern boundary, this is the easiest to trade. Following the breakout your stop-loss will no be challenged and price target will be met.
If you have a stop-loss placed below the chart pattern boundary, this type of trade may test your patience but still will not challenge your protective stop-loss. Chart pattern boundary will even offer a new entry opportunity.
A prominent technical analyst expert on P&F charting has commented on one of my H&S continuation post. If you are having difficulty to understand H&S continuation, you are not alone. I will review few charts and draw your attention to the dynamics behind price action.
Because more than what each chart pattern is named, it is more important to understand what the price action is trying to tell us. You can name it a H&S continuation, Cup & Handle, Darwas Box etc.
First, I will share the best of best H&S continuation chart pattern I traded when I was working for the semi-sovereign fund in Abu Dhabi. Since it has been more than a year I can disclose, we have doubled our investment of $20 million. People familiar can confirm.