When variants of concern were first identified in late Dec, the US was not where it needed to be in terms of genomic surveillance. However, with considerable ramp up by the CDC, state labs and academic groups, we now have a remarkable genomic surveillance system. 1/14
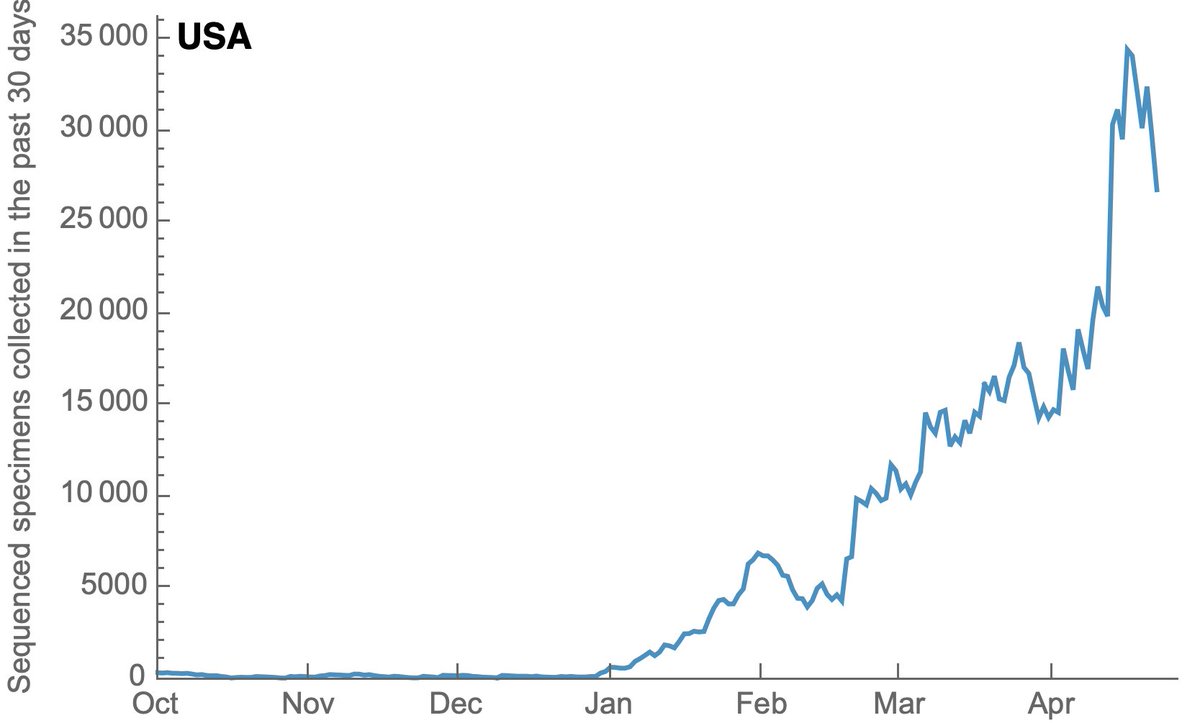
My favorite metric for genomic surveillance is the number of cases that have been sampled, sequenced and shared publicly to @GISAID in the previous 30 days. By incorporating both sequencing volume and turnaround time, it tells you how much is known about current circulation. 2/14
Throughout the fall, the US had just 100-300 genomes available that were sampled, sequenced and shared in the previous 30 days. 3/14
However, with investments in sequencing capacity, the US had rapidly increased this count, ramping from 100-300 in Dec 2020 to over 30,000 in April 2021. This is a remarkable achievement and I'm no longer worried about novel variants escaping detection in the US. 4/14
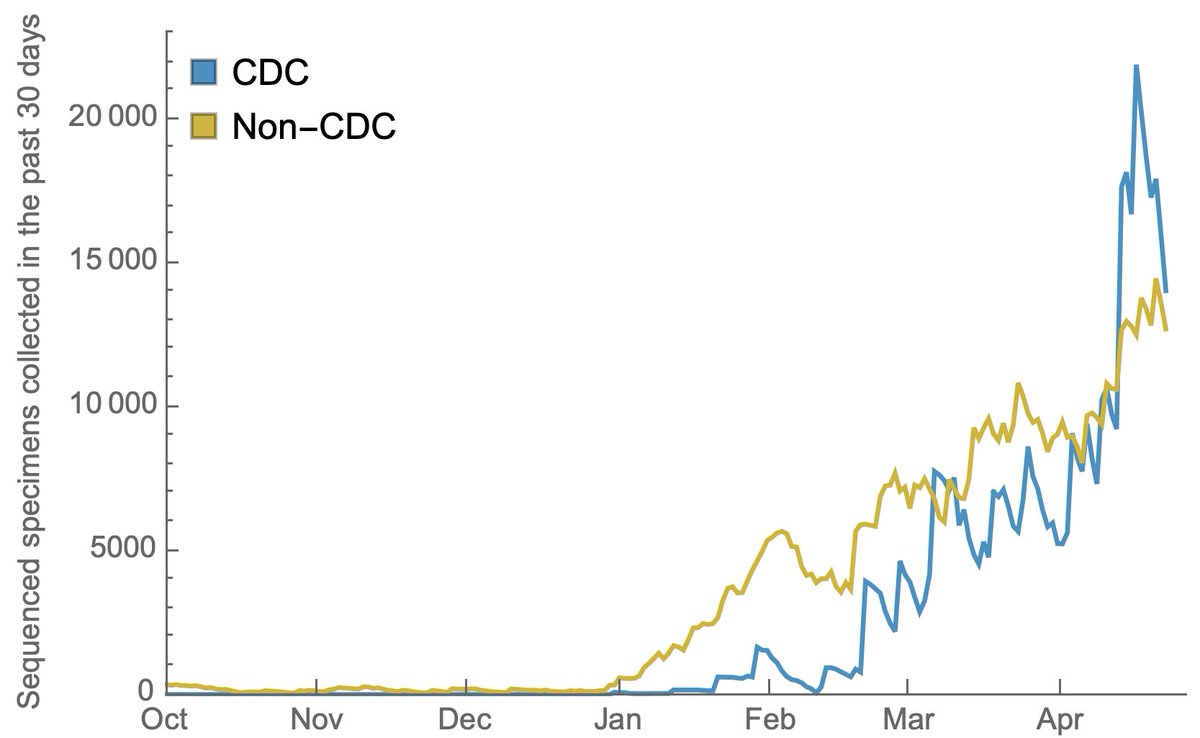
This increase in sequencing has been driven by the CDC and by non-CDC groups (mostly academic labs and state lab health departments). 5/14
Much attention has focused on proportion of cases sequenced, where in the past 30 days the US has sequenced about 1.7% of cases, behind countries such the UK (30%), Switzerland (5%) and Germany (2.5%). Data from gisaid.org/index.php?id=2…. 6/14
However, for variants in particular, analysis focuses on frequency, where we particularly care about variants that are increasing rapidly in frequency across different geographies. 7/14
In this case, having a very large volume of sequences with good turnaround time should be sufficient to characterize variants while they're still at low frequency. 8/14
With ~30,000 genomes in the past 30 days, we can reliably catch variants at a 0.02% frequency threshold in the US (geometric distribution with 99% probability of detection). Again, this is remarkable. 9/14
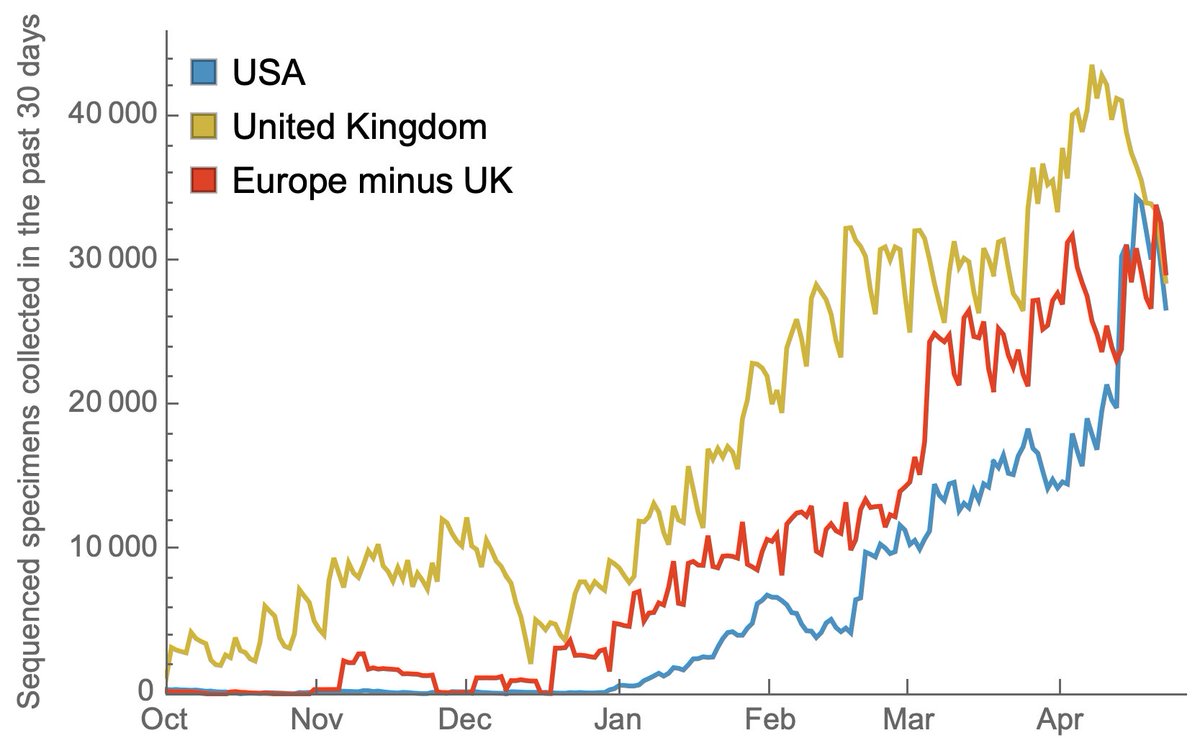
Other countries have also been increasing sequencing throughput in response to the emergence of variants of concern and we see the US now matching sequencing throughput of the UK and the rest of Europe when considered separately. 10/14
However, SARS-CoV-2 variants are emerging throughout the world and only focusing on improving genomic surveillance within national borders is short sighted. The primary goal of this surveillance is to be to able to formulate vaccine updates with sufficient lead time. 11/14
Work by South African and Brazilian scientists to quickly identify and share data on B.1.351 and P.1 did the world an enormous favor. 12/14
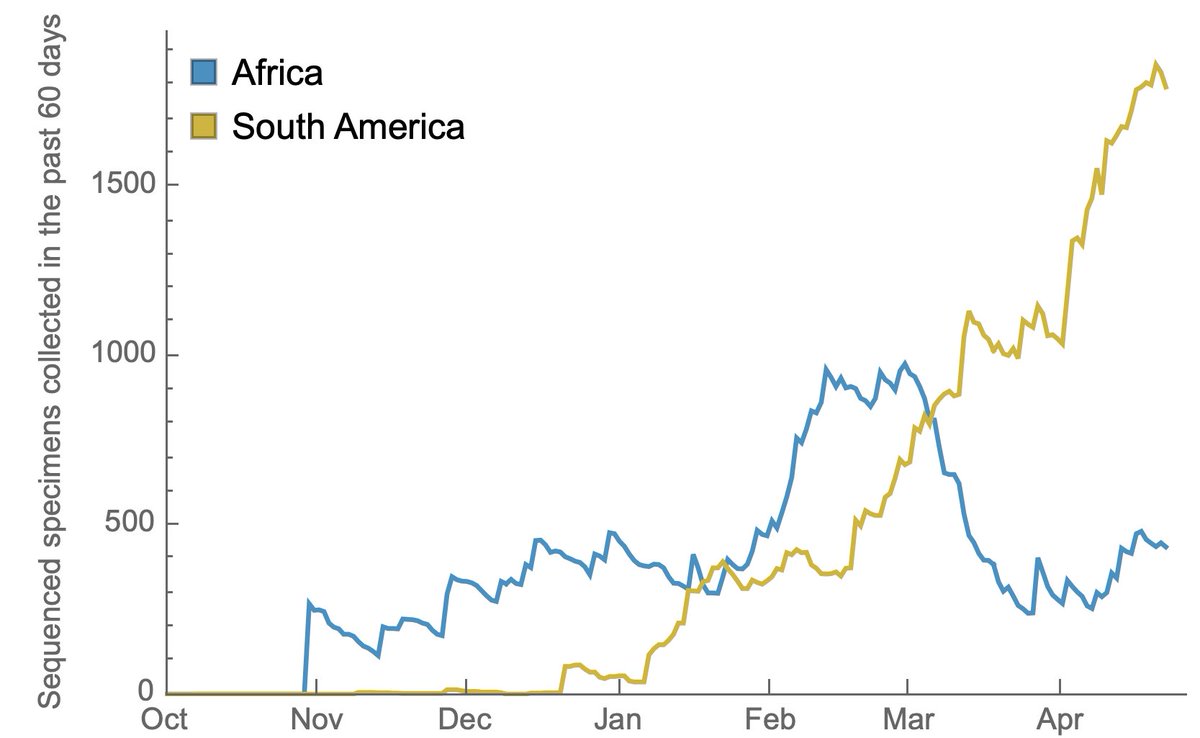
Sequencing throughput has been increasing in Africa and South America, but now lags behind the US and Europe due to recent national investments in sequencing capacity in the US and Europe. 13/14
International investment is incredibly important here. I'd so much prefer an additional 1000 genomes from South America or Africa to an additional 10,000 from the US or Europe. 14/14
• • •
Missing some Tweet in this thread? You can try to
force a refresh
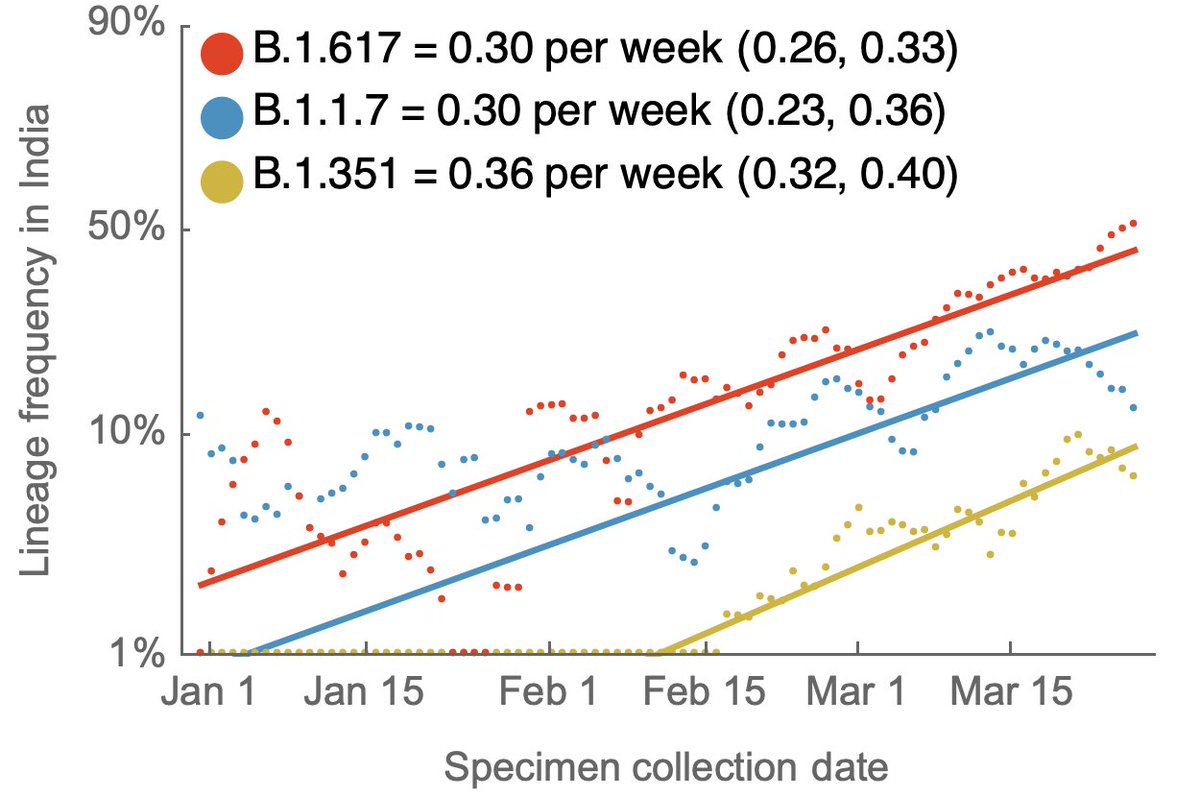
It's hard for me to infer the degree to which new variants are driving the surge in cases in India, but we are seeing rapid growth in frequency of multiple viral variants. 1/5
Here is a @nextstrain view of @GISAID data that focuses on viruses from India and highlights emerging lineages B.1.1.7 (in blue), B.1.351 (in green) and B.1.617 (in orange). Interactive version at nextstrain.org/ncov/asia?c=em…. 2/5
We can fit a logistic growth model to the full genomic dataset from India for these three lineages, where we see logistic growth as "linear on a logit scale". Each of these lineages is estimated to have similar logistic growth rates of ~0.3 per week. 3/5
Since their recognition in the UK, South Africa and Brazil in Dec 2020 and Jan 2021, the variant of concern lineages B.1.1.7, B.1.351 and P.1 have continued to spread throughout the world with B.1.1.7 so far the most successful of the three. 1/15
These lineages first received attention due to large numbers of mutations to the spike protein along with rapid increases in frequency in the UK, South Africa and Manaus, Brazil, but much subsequent attention has focused on key mutations E484K and N501Y. 2/15
This figure shows genotype at sites 484 and 501 mapped onto a reference phylogeny of ~4k viruses sampled from all over the world with 484K viruses in light orange, 501Y viruses in blue (including B.1.1.7) and 484K+501Y viruses in dark orange (including B.1.351 and P.1). 3/15
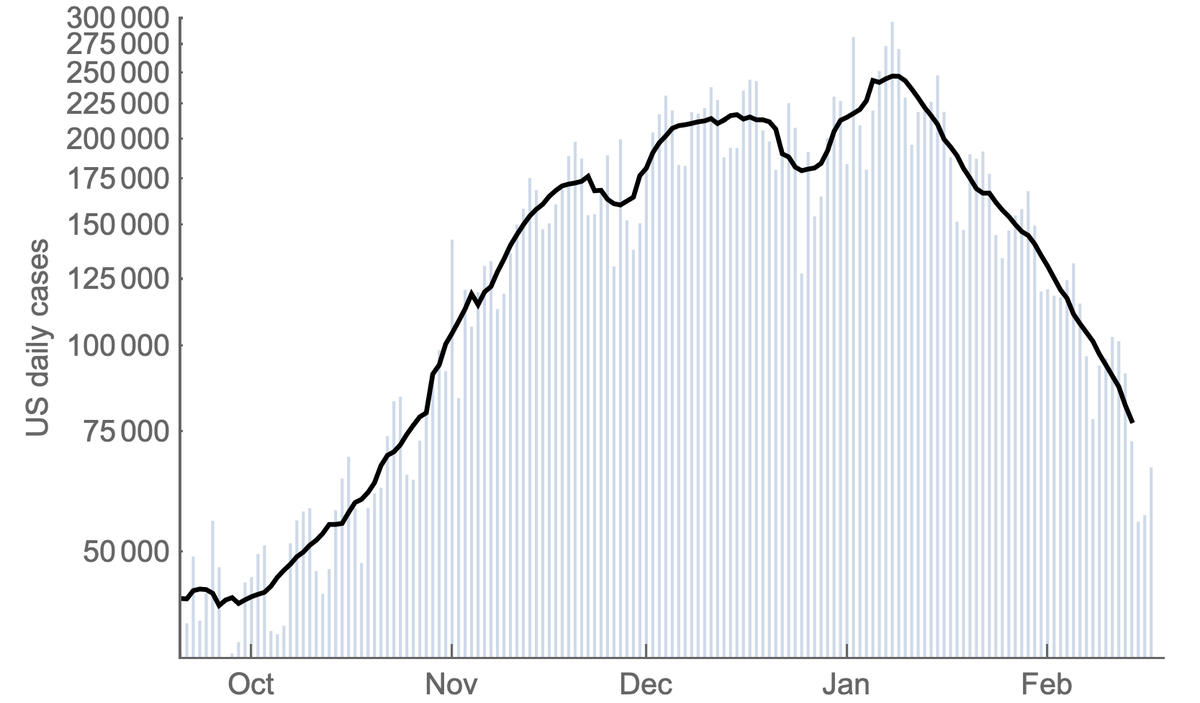
After a ~2 month plateau from mid-Nov to mid-Jan, the US #COVID19 epidemic has undergone a steady week after week decline and is now back to daily case counts last seen in late October. A thread on what we might expect going forwards. 1/13
Working with case counts from @COVID19Tracking and Rt estimates from epiforecasts.io, I'm showing US confirmed cases broken out by state alongside transmission rate as measured by Rt through time. 2/13
Generally, Rt > 1 in Nov and Dec corresponding to rising cases and drops below 1 in Jan corresponding to falling cases. We've seen a steady decline in Rt from Nov to Feb. Thus, current decline is not a sudden shift in circumstance, but resulted from reaching Rt < 1. 3/13
With emerging variants of SARS-CoV-2 and initial evidence of antigenic evolution, I've seen comparisons here to seasonal influenza and its rate of evolution. In this thread, I want to ground these comparisons with some data. 1/18
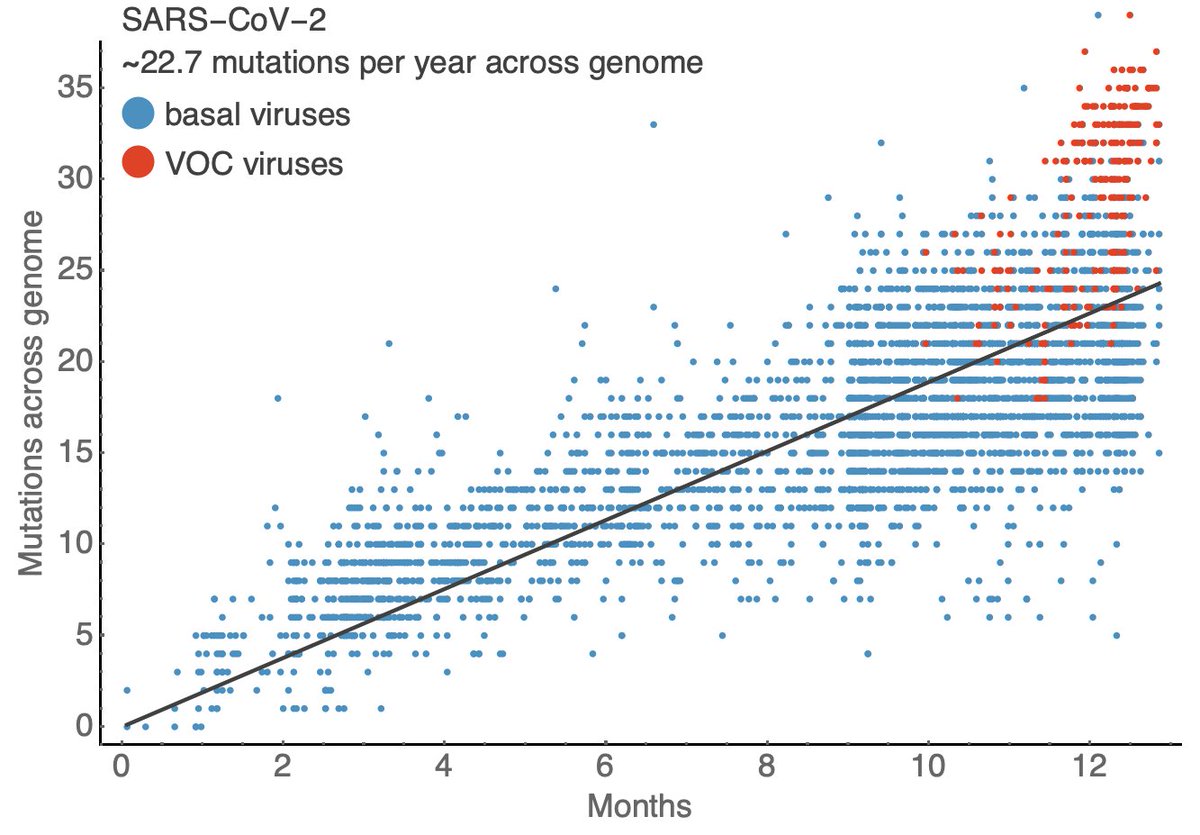
If we follow a transmission chain of SARS-CoV-2 from person to person, we'll generally see one mutation occur across the viral genome roughly every two weeks. 2/18
Here I use data from @nextstrain and @GISAID to compare sampling date to the number of mutations across the SARS-CoV-2 genome relative to initial genomes from Wuhan. This shows a steady accumulation of mutations through time with the average virus now bearing ~24 mutations. 3/18
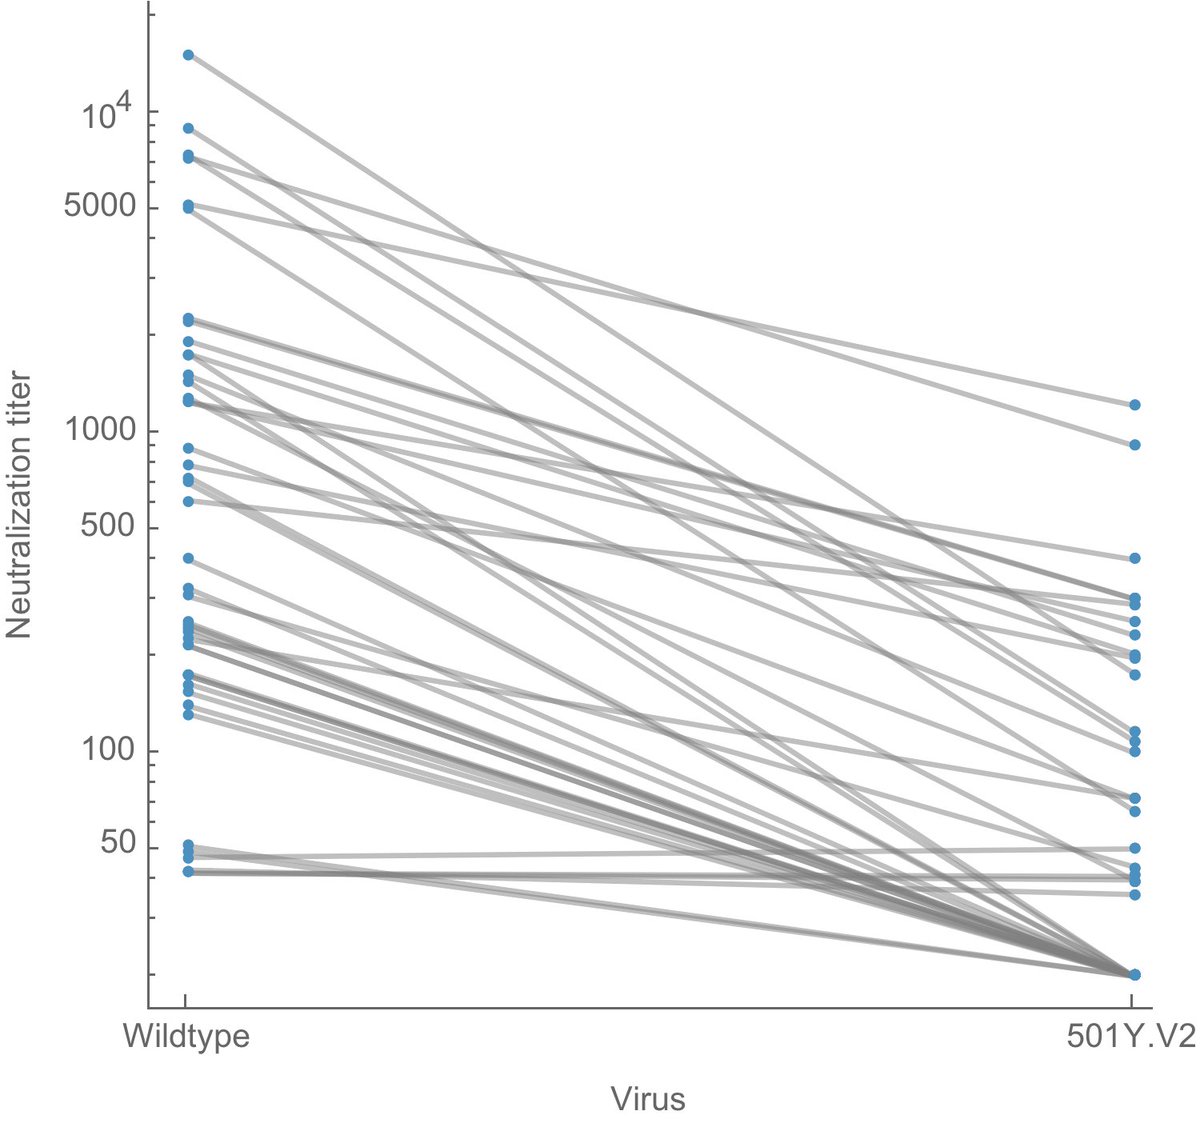
Important new study by Wibmer et al (biorxiv.org/content/10.110…) of neutralization by convalescent sera on wildtype vs 501Y.V2 variant viruses circulating in South Africa. It shows that mutations present in 501Y.V2 result in reduced neutralization capacity. 1/10
Here, I've replotted data from the preprint to make effect size a bit more clear. Each line is sera from one individual tested against wildtype virus on the left and 501Y.V2 variant virus on the right. Note the log y axis (as is common with this type of data). 2/10
It's clear that 501Y.V2 often results in reductions of neutralization titer, quantified as "fold-reduction" where, for example, a 2-fold reduction in titer would mean that you need twice as much sera to neutralize the same amount of virus in the assay. 3/10
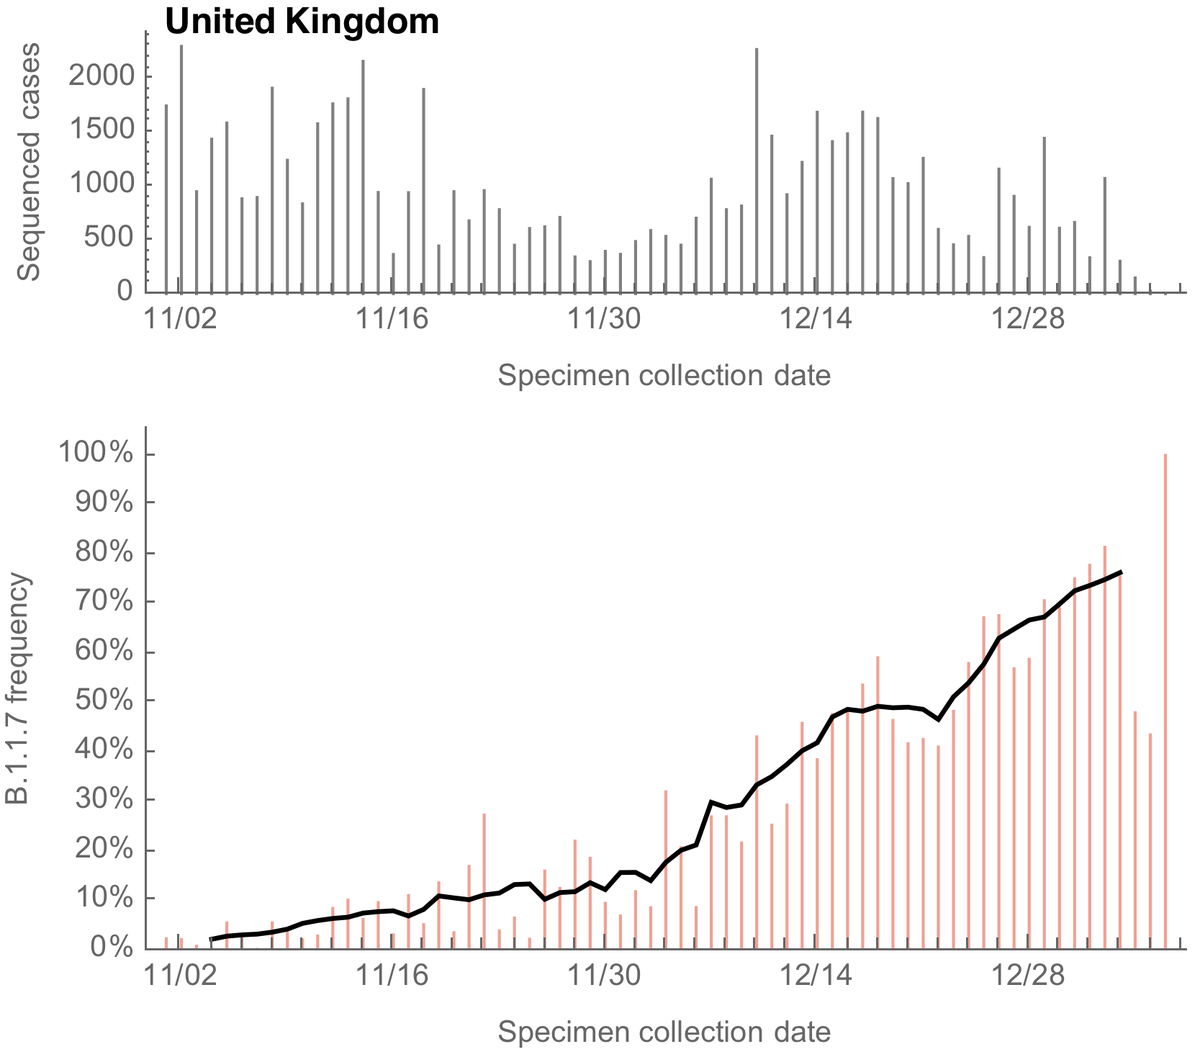
At this point, the countries with most genomic data to analyze spread of the variant virus belonging to cov-lineages.org B.1.1.7 lineage or @nextstrain clade 20I/501Y.V1 are the UK, Denmark and the USA. Here I compare growth rates of B.1.17 across these countries. 1/13
Working from @GISAID data, the UK has 18776 genomes, Denmark has 6089 genomes and the USA has 3093 genomes from specimens collected after Dec 15, 2020. Here, I'm looking at daily genomes with collection dates up to Jan 6 that were not pre-screened by "S dropout". 2/13
For the UK, we can see a steady increase in the frequency of sequenced variant viruses belonging to the B.1.1.7 lineage, reaching ~70% frequency at the end of December. Solid line is a 7 day sliding window average. 3/13