Hold2 Profile picture
1 May, 5 tweets, 2 min read
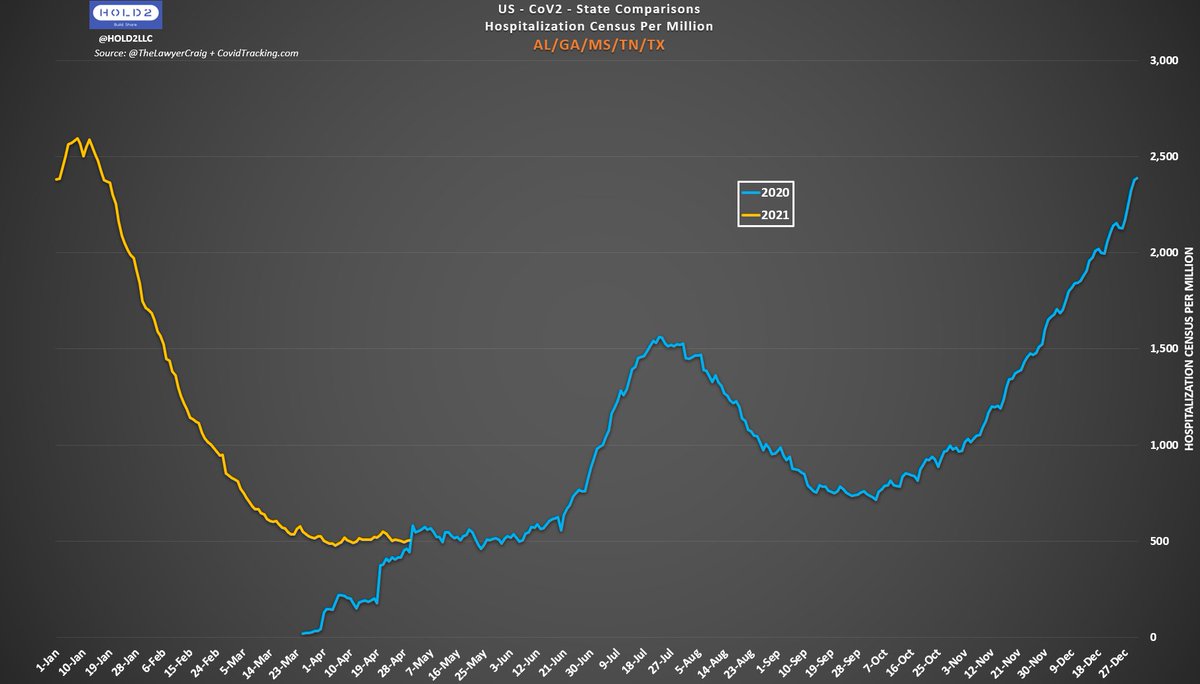
CoV2 2020 vs. 2021: AL/GA/MS/TN/TX

🧐🤔

Not sure what to think.
AZ/CA/NV
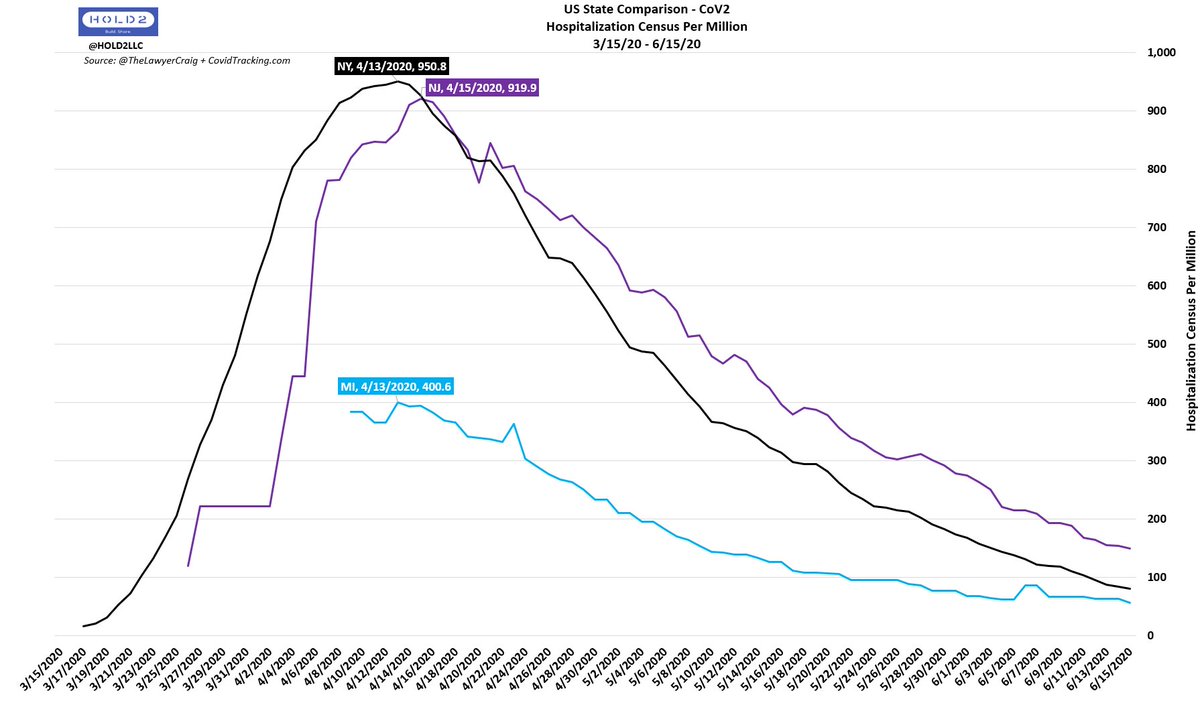
NJ vs. CT/MA/NJ/NY/RI
ID/OR/UT/WA

2 versions:

1) On NJ's scale (0-800/M)
2) On their own scale (0-180/M)
IA/MT/ND/SD/WI

Come on, man. Really?

1) Own scale (0-600)
2) NJ scale (0-800)

• • •

Missing some Tweet in this thread? You can try to force a refresh
 

Keep Current with Hold2

Hold2 Profile picture

Stay in touch and get notified when new unrolls are available from this author!

Read all threads

This Thread may be Removed Anytime!

PDF

Twitter may remove this content at anytime! Save it as PDF for later use!

Try unrolling a thread yourself!

how to unroll video
  1. Follow @ThreadReaderApp to mention us!

  2. From a Twitter thread mention us with a keyword "unroll"
@threadreaderapp unroll

Practice here first or read more on our help page!

More from @Hold2LLC

24 Apr
Thread on "Consilience" (tm @EthicalSkeptic)

I hope Dr. Jacobs will engage and discuss with us in good faith.

My intent is to explain how we analyze patterns and look for consilience before predicting or calling peaks.

It's important to know what to expect, right?

/1
This started with my tweet on 4/12 claiming MI/NY/NJ had peaked and that Hosps would peak next...likely the following week.

I didn't post that based on hopes and guesses. It was based on known data/patterns:
- Historical evidence
- Leading indicators

/2

Historical Evidence:

- Hope-Simpson N. Temperate pattern
- April 2020 pattern

Instead of assuming US states dropped in unison at the same time last Spring due to NPIs, we consider natural forces to be predominant.

/3
Read 8 tweets
12 Apr
Taking this one step further, you HAVE to watch this review of the JAMA study.

As a reminder, this is a CDC study claiming over 50% of transmission is caused by asymp (Fauci).

They use a model where they ASSUME asymp is 75% as infectious as symptomatic.
Lee paper (9):
- Viral load is similar between asymp and symp
- "Viral load is not the same thing as infectiousness or transmissability"

Johansson (JAMA author) used that to claim asymp infectious is 100% as much as symptomatic (fed into the 75% model assumption).

/2
Chaw paper (#15):
- Symptomatic was 2.7X as presymp and asymp COMBINED
- Presymp more infectious than asymp

Johansson counts this as asymp being 40-140% as infectious but that does not match the paper.

/3
Read 5 tweets
27 Mar
Thread: Masks and NPIs.

This thread reviews information published from Oct 2019 - Dec 2020.

The point is to see what was known/believed before & after discovery of COV2.

We'll start with research on epidemic/pandemic influenza (flu) from Oct of 2019.

Aerosols vs. droplets.
/1 ImageImageImage
Seasonality? This was actually a known phenomenon?

/2 ImageImageImage
Intended impact of NPIs.

Does this look familiar? This published in October of 2019 - that's very interesting to me.

Why does this "flatten the curve" image always go to 0 with no resurgence and not have values on either axis?

Let's look at NY and FL for fun.

/3 ImageImageImage
Read 22 tweets
3 Jan
AZ COVID Update: 1/3/21

Thread.

Lots of data to look at for AZ. Holiday behavior patterns both for residents (when they get tested) and gov't (when they process the results) are difficult to predict, so it's important to look closely at the details.

First, Cases.

/1
Today, 17k cases were reported, but it's important to know the difference between Report Date and Date of Specimen Collection. You see in my chart that there was a major dip in cases right when very few tests were performed on the 24th-26th despite 2 being weekdays.

/2
Those who would have tested, but didn't, showed up to get tested on the 27-29th. Due to this, we see the 2 highest single case dates on 12/28-12/29, but the 7-day-avg is still lower than the 12/23 peak currently.

Just like CA with every restriction imaginable.

/3
Read 7 tweets
3 Dec 20
Thread.

COVID vs. Hope-Simpson Flu Patterns: 12/3/20

We're not through a whole year yet, but patterns are emerging, and I wanted to take a closer look.

We'll start with NY/IL who both are N. Temperate but not exactly the same climate pattern.

/1
Now FL/TX.

FL is closest to true N. Tropical.

TX is very large with varying climates. Some are almost as far north as the southern tip of IL but most pop is further south.

Like IL vs. NY, we would not expect TX to mirror FL exactly but to be much closer to FL than IL/NY.

/2
Now all 4 together. Notice the "W" shape mixing the N Temperate with N Tropical.

Also notice the obvious high winter peak for NY/IL that drops to near-zero in summer.

Notice the lower wave pattern for FL/TX that never gets to zero. Summer peak occurs; winter peak higher?

/3
Read 4 tweets
19 Oct 20
US Update: 10/19/20

Graph 1: Daily Deaths + Current Hospitalizations

- Hospitalizations bottomed 4 weeks ago and then increased tangibly 2 weeks ago. That new increase trend already started abating the past 4 days
- Reported Deaths down 83 Week-over-Week (WoW)

/1 Image
Graph 2: COVID ICU Census vs. Deaths (7DayAvg) vs. Daily Detected Cases

***Case hunting now in mega-hyperdrive and some states now include antigen positives (not antibody)

- 7-Day-Avg Reported Deaths down 15 WoW
- ICUs sizable jump last 2 weeks but peaking again already

/2 Image
Graph 3: Daily Tests + Detected Cases + Case Positivity

***Last 10+ days have seen a real increase in Pos% that coincides with a bump in national CLI

- Test Positivity up 1.0 from trough
- Daily Test avg above 1M for 26 days
- Increase rate much lower than June surge

/3 Image
Read 6 tweets

Did Thread Reader help you today?

Support us! We are indie developers!


This site is made by just two indie developers on a laptop doing marketing, support and development! Read more about the story.

Become a Premium Member ($3/month or $30/year) and get exclusive features!

Become Premium

Too expensive? Make a small donation by buying us coffee ($5) or help with server cost ($10)

Donate via Paypal Become our Patreon

Thank you for your support!

Follow Us on Twitter!