New: @matthancock tells HoC the data behind his claim Pakistan & Bangladesh had positivity 3x higher than India (as per thread 👇)
He says: positivity of passengers “was 1.6% in India and 4.6% in Pakistan, which is three times higher. As I said.”
Finally an answer!
BUT…
While it’s great that the Health Sec has at last provided the data, there are still some oddities.
- First, why didn’t he say anything about Bangladesh?
- Was Bangladesh’s positivity really three times above India’s, as he explicitly claimed on Mon?
He still hasn’t explained this
- Second, why isn’t this data publicly released?
If govt decisions are happening on the basis of key data series then surely there’s a public interest case in making that data public.
As this farago showed, this data is NOT public.
- Third, while @matthancock is right to point out that the data I mentioned on Mon 👇covered a period that includes days after the decision to red-list 🇵🇰 & 🇧🇩, he has’t said when HIS data is from. This is crucial: was it on 2 April? Before? A period avg or daily snapshot?
There’s a bigger issue here tho.
We know that as of 7 Apr, Indian positivity was close to Pakistan. And well above Bangladesh.
Yet even after that rise (1.6% to 5.1% is a BIG leap) govt still waited for 12 DAYS before red-listing India.
He still hasn’t explained why.
Here’s another way of putting it:
● When levels of #COVID19 among passengers from Pakistan hit 4.6%, govt added it to the red list.
● When levels of #COVID19 among passengers from India hit 5.1%, govt waited for nearly a fortnight before adding it to the red list.
• • •
Missing some Tweet in this thread? You can try to
force a refresh
I wasn’t planning another thread on #COVID19, the Indian variant & why govt took so long to put it on the red list. But then something odd happened.
Let’s begin with this, @MattHancock in the House of Commons this afternoon: parliamentlive.tv/event/index/a1…
Here, in case you missed it, is what he said: “The truth is that when we put Pakistan on the red list - and indeed Bangladesh - the positivity of those arriving from Pakistan and Bangladesh was three times higher than that from India.”
Recap:
Bangladesh & Pakistan were red-listed (compelling travellers to quarantine in hotel & banning non-citizens/residents) in early Apr.
India wasn’t added til 19 Apr (enacted 23 Apr).
The gap matters because that was potentially when Indian variant B.1.617.2 gained a foothold
THREAD: How did we end up here? With the UK’s plans to lift lockdown threatened by a new variant. Just as we taste freedom, it might be stolen from us! Well. It’s a slightly long and circuitous story and, believe it or not, the best place to start is with Brexit…
No. Don’t worry. This is not not a thread about Brexit. But Britain’s departure from the EU is the starting point for one of this govt’s overarching policy objectives: the need to seek out a trade deal with key partners. And one of those key partners is India.
That’s partly why @BorisJohnson made India the destination for his very first International visit. But then #COVID19 got in the way. The first slated trip in Jan was postponed. Then it was rescheduled for Apr 19. But then cases picked up in the Indian sub-continent…
Thread: In a factory somewhere on the outskirts of Birmingham sits a machine which tells you rather a lot about the UK economy & where it's heading. It cuts & presses little bits of copper alloy, which are then sent on to another company which puts them into car rear view mirrors
If you buy a car with a heated rear view mirror anywhere in the world, chances are it’ll be powered by those copper electrodes made just outside Birmingham by @CBrandauer - in that very machine. It’s a crucial cog in an automotive supply chain that bestrides the world.
But the reason it’s worth focusing on that machine is not so much what it does but why it’s there. @CBrandauer bought it in part because of the new Super Deduction policy introduced by @RishiSunak in March’s Budget. The deduction could be a v big deal indeed.
How have you spent your Saturday? I’ve spent most of mine jumping around in front of a @skynews screen trying to make sense of the actually-rather-interesting local/Scottish/Welsh/London and a few other elections today.
Here’s something I did on Scotland:
Now, in case it wasn’t already clear, the problem with trying to use these election results as an argument either FOR or AGAINST another independence referendum is that, well, there’s no such thing as an automatic trigger or rule about these kinds of things…
On the one hand, the SNP has had another very strong election. They’ve increased their share of the vote for the fourth successive election. Given the extraordinary share of the vote they already have, that’s pretty, well, extraordinary.
🪨 Rare earths: everything you ever wanted to know
Or rather: everything never wanted to know but really ought to know, especially since the device you're reading this on almost certainly has rare earths in it. Thread…
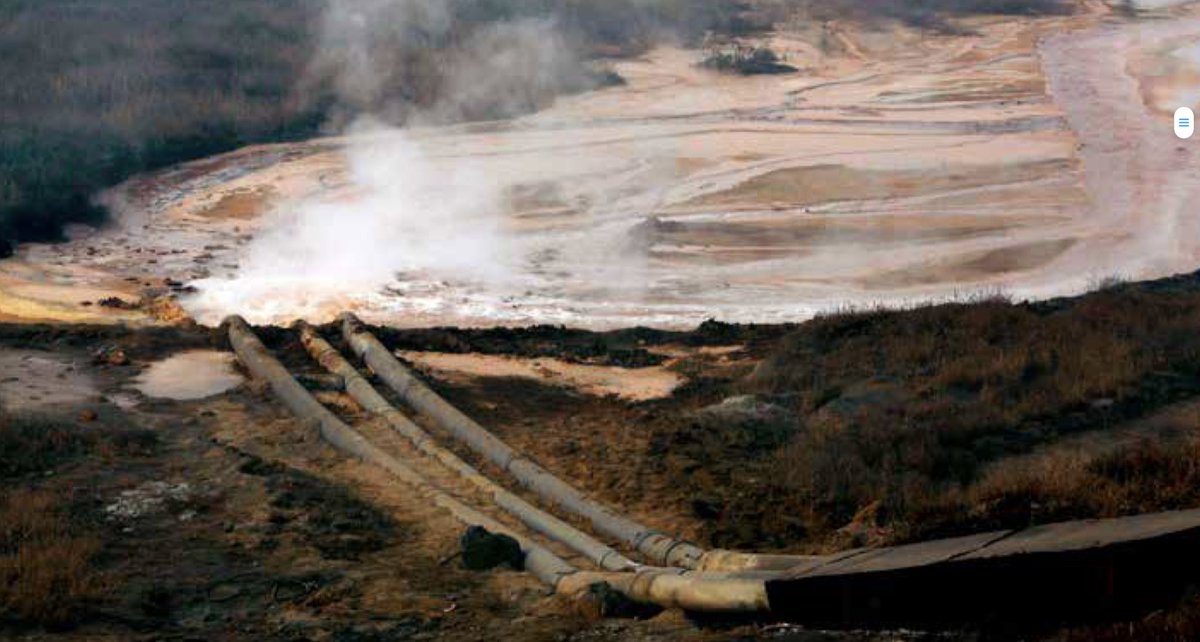
This might look like a satellite image of Mordor but it’s actually ground zero of the 21st century
Without this mine & others like it you wouldn’t have Airpods.
You wouldn’t have electric cars.
Or wind turbines.
Or much modern tech.
Bayan Obo: the world’s biggest rare earths mine
Bayan Obo is in Inner Mongolia. China. First thing you notice is the pollution. Extracting rare earths from ores is an incredibly energy-intensive, dirty business. Many mining processes involve waste tailings and lakes of toxic sludge. But especially rare earth processing.
Anyone fancy an #Earthday data thread?
One of my frustrations with this topic is that all too often it’s portrayed in enormously over-simplistic terms: We need to stop flying! Cutting down forests is killing the planet!
So here’s some charts that show you the numbers that matter
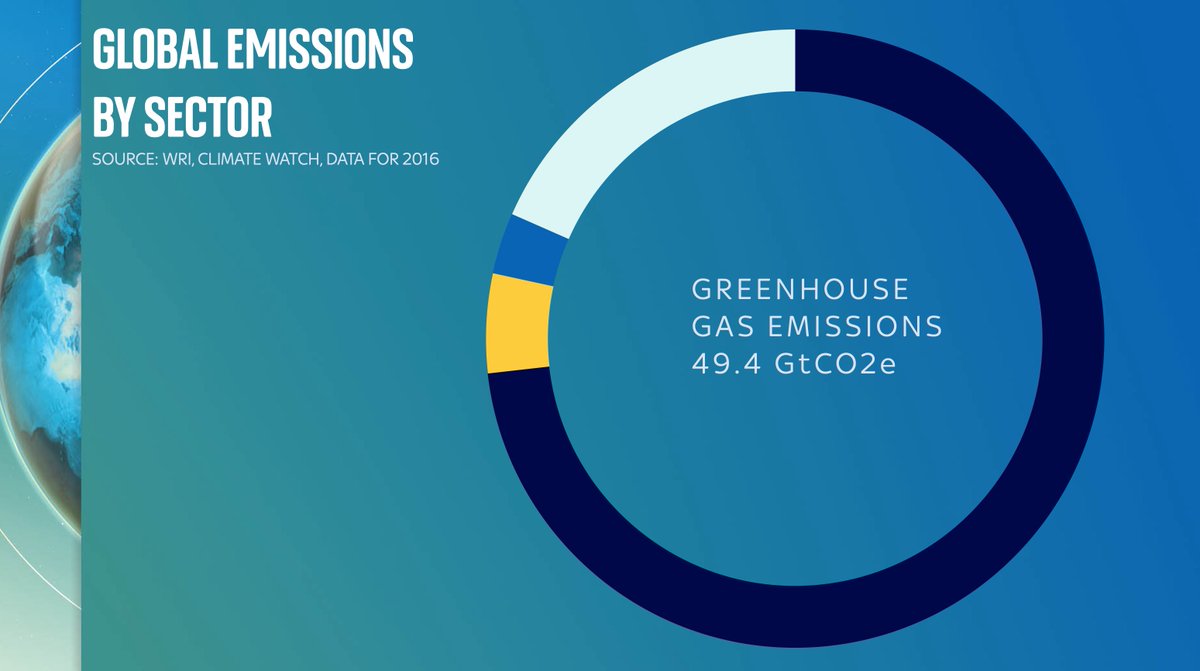
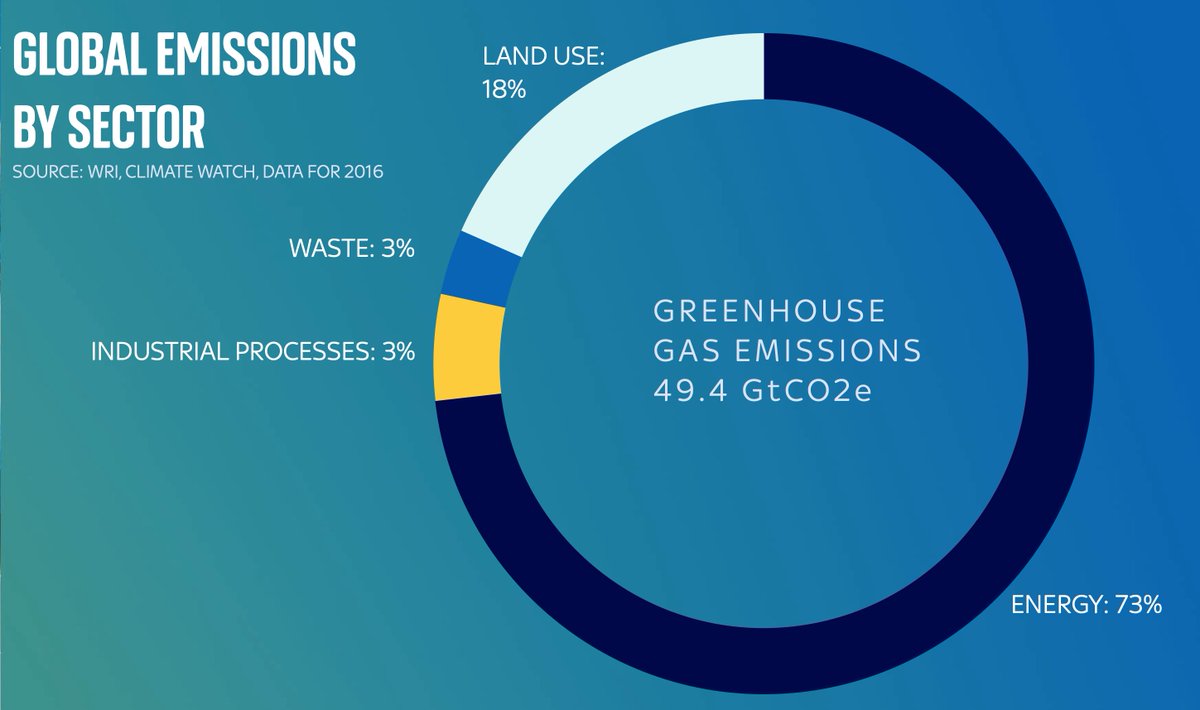
Let’s start with this: this doughnut shows you total global emissions. About 50 gigatonnes of CO2 or equivalent. The numbers are from @WorldResources based on @IEA data which you and I can’t afford to see because they’re stuck behind a mammoth paywall.
First let’s break the doughnut into some primary categories: the vast majority is emissions from energy: everything from power stations to gas boilers to industrial processes. But also note a big chunk is emissions directly coming from the land/farming, and industry/waste