I wasn’t planning another thread on #COVID19, the Indian variant & why govt took so long to put it on the red list. But then something odd happened.
Let’s begin with this, @MattHancock in the House of Commons this afternoon: parliamentlive.tv/event/index/a1…
Let’s begin with this, @MattHancock in the House of Commons this afternoon: parliamentlive.tv/event/index/a1…
Here, in case you missed it, is what he said: “The truth is that when we put Pakistan on the red list - and indeed Bangladesh - the positivity of those arriving from Pakistan and Bangladesh was three times higher than that from India.” 

Recap:
Bangladesh & Pakistan were red-listed (compelling travellers to quarantine in hotel & banning non-citizens/residents) in early Apr.
India wasn’t added til 19 Apr (enacted 23 Apr).
The gap matters because that was potentially when Indian variant B.1.617.2 gained a foothold
Bangladesh & Pakistan were red-listed (compelling travellers to quarantine in hotel & banning non-citizens/residents) in early Apr.
India wasn’t added til 19 Apr (enacted 23 Apr).
The gap matters because that was potentially when Indian variant B.1.617.2 gained a foothold
But @matthancock’s explanation is odd.
Most glaringly, it doesn’t accord with the evidence. For it so happens the NHS publishes data on #COVID19 positivity of travellers coming from various countries.
It DOESN’T show either Pakistan or Bangladesh three times higher than India…
Most glaringly, it doesn’t accord with the evidence. For it so happens the NHS publishes data on #COVID19 positivity of travellers coming from various countries.
It DOESN’T show either Pakistan or Bangladesh three times higher than India…
Here’s what it shows.
In late Mar/early Apr - eg precisely when Bang/Pak were added to the red list - #COVID19 positivity among travellers from India was 5.1%.
From Pakistan: 6.2%
So not three times higher.
And Bangladesh had LOWER test positivity.
This is the govt’s own data!
In late Mar/early Apr - eg precisely when Bang/Pak were added to the red list - #COVID19 positivity among travellers from India was 5.1%.
From Pakistan: 6.2%
So not three times higher.
And Bangladesh had LOWER test positivity.
This is the govt’s own data!

This is really weird. It’s poss @MattHancock was talking about another govt dataset or perhaps an earlier period. I asked @DHSCgovuk for a comment this morning and as of yet have alas not had an answer. But as far as we can tell the govt’s own numbers completely contradict him.
That’s not the only odd thing. Note @MattHancock said the decision was taken not because of any variants that were or weren’t coming from Pak/Ban/Ind but because of test positivity.
But when govt announced the decision it said it was ALL abt variants! gov.uk/government/new…
But when govt announced the decision it said it was ALL abt variants! gov.uk/government/new…
Actually (and I’m trying here to give @MattHancock the benefit of the doubt) perhaps the real reason is more complicated.
Maybe for Pakistan it was about overall Covid levels (even if not 3x over India) and for Bangladesh it was about variants. After all, lots of variants there:
Maybe for Pakistan it was about overall Covid levels (even if not 3x over India) and for Bangladesh it was about variants. After all, lots of variants there:

But that still doesn’t answer the q: why not India?
That last chart showed the % of sequenced tests of travellers testing positive for variants.
Over 50% of those coming from India had VUI/VOCs.
More than half of travellers from India!
Two weeks before India was red-listed.
That last chart showed the % of sequenced tests of travellers testing positive for variants.
Over 50% of those coming from India had VUI/VOCs.
More than half of travellers from India!
Two weeks before India was red-listed.
One poss explanation surrounds the PM’s slated trip to India in late April. I’ve covered that in 👇 thread, but today’s data adds a new dimension, since it helps flesh out the picture of how the govt’s own figs looked in late March/early April, weeks before India was red-listed
https://twitter.com/edconwaysky/status/1393271922595667971
It shows that there were more variants of concern or interest being imported into this country from India than from any other country in the world. Two weeks before it was added to the red list.
And higher positivity than 🇧🇩, not far below 🇵🇰.
V diff to @matthancock’s testimony
And higher positivity than 🇧🇩, not far below 🇵🇰.
V diff to @matthancock’s testimony

Now to some extent this is all water under the bridge.
Captain hindsight, as @MattHancock would say.
But it matters for two reasons. First because the decision influenced how quickly the variant gained a foothold here in UK. Look: more of it than anywhere else in Europe:
Captain hindsight, as @MattHancock would say.
But it matters for two reasons. First because the decision influenced how quickly the variant gained a foothold here in UK. Look: more of it than anywhere else in Europe:

Second, it matters because the rationale over which country is red or amber is v important - for those countries and us. Yet we have precious little reliable detail on how those decisions are taken. Instead we get slightly waffly webpages like this: gov.uk/government/pub…
If you can work out from that page, or indeed this one, which has an incomplete list of countries scattered around the lists, along with incomplete data from places like @OurWorldInData, why certain countries are on or off, then you’re doing better than me gov.uk/government/pub…
Here, for what it’s worth, is a chart showing you countries on the amber and red lists, ranked in order of the latest Covid positivity of travellers coming back from there. As you’ll see, red status doesn’t seem to correlate that well with positivity.

Why, for instance, are Mali and Yemen - 20% positivity among those travelling to the UK - still amber listed? Perhaps because there aren’t many people coming here from there now? But you could say the same thing abt the DRC or Angola (both red list, both lower Covid positivity)

You can pick out plenty of similar examples. Why is the UAE on the red list still, even tho test positivity among travellers there is lower than most of the EU? Why is Estonia still amber, given it’s above the vast majority of red list countries?

I’ve no doubt there are good and plausible explanations for all this. The problem is the govt has been utterly opaque abt these decisions. And the idea that it’s purely based on data seems laughable. I’d challenge anyone to devise a formula to link red list status to covid data.
Such a formula might identify why the Philippines is red-listed, despite relatively low #COVID positivity: v high level of variants (VOC/VUI) coming from there.
But it might struggle with the fact that Ghana, higher positivity number and higher variant %, is NOT on the red list.
But it might struggle with the fact that Ghana, higher positivity number and higher variant %, is NOT on the red list.


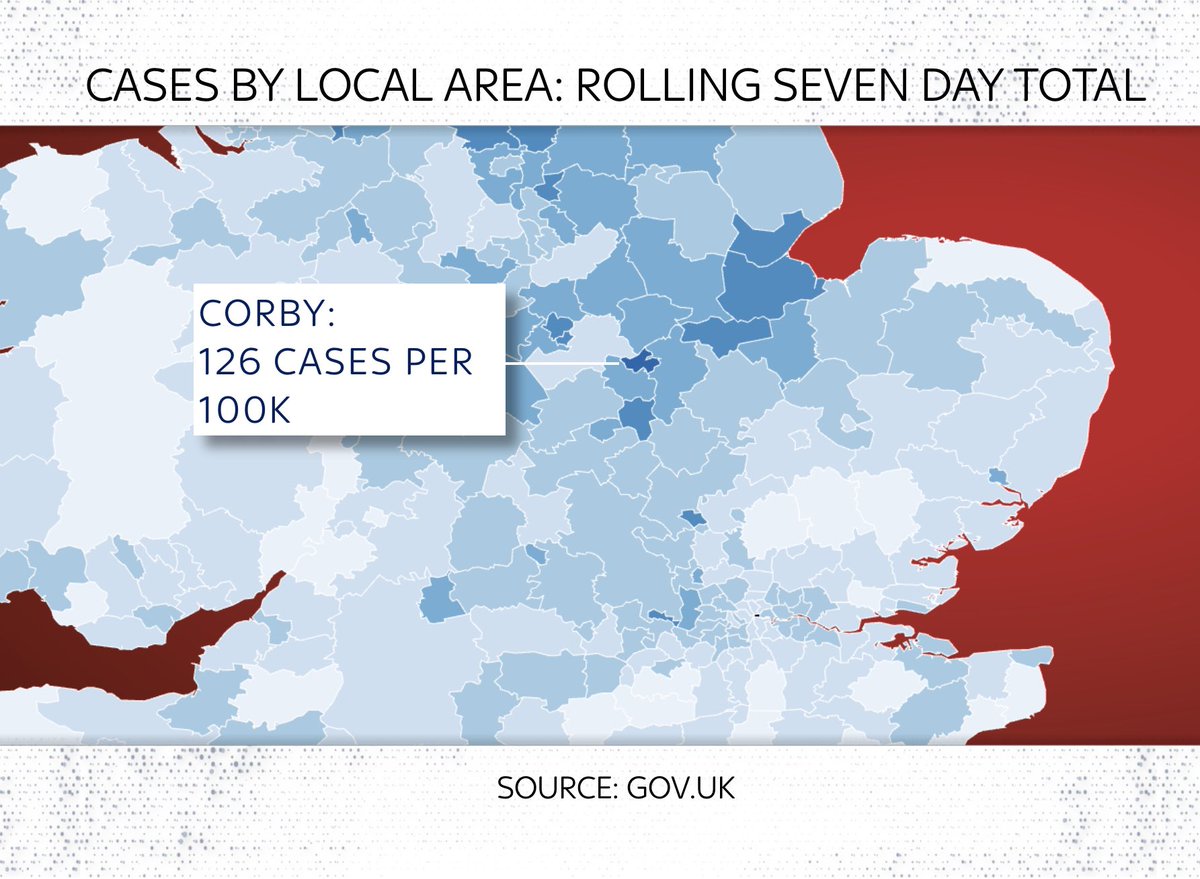
The bad news is that it’s now almost certainly too late to stop the Indian variant, B.1.617.2, spreading widely around the UK. Last week the main hotspot was Bolton. This week we know it’s now elsewhere too. For instance in Bedford.


The good news is the data from places with lots of this variant still suggests - albeit tentatively - that the vaccines are working. Look. In both places, over-60 rates of infection remain much lower than under-60. Hopefully that will stay the case.


Also: overall cases are v low, still. The vaccination programme is going very well, by international standards. It’s still too early to know for sure how much more transmissible this variant is among domestic cases, but we should know more abt that in the coming weeks.

Even so, hard not to find this all a little frustrating. Why doesn’t the government provide more evidence on why it took far longer to add India to the red list than other countries? Why are its explanations inconsistent with the data, and indeed its previous explanations? 🤔
If you’re curious, you can find the NHS T&T dataset in the very last tab of the .ods spreadsheet here gov.uk/government/pub… h/t to @EvilDoctorK for the link.
And I’m serious about that challenge: if anyone can devise a formula linking the data to red list status pls do share!
And I’m serious about that challenge: if anyone can devise a formula linking the data to red list status pls do share!
When @MattHancock spoke to both @SophyRidgeSky and @AndrewMarr9 on Sun he was v clear he wasn't relying on data collected by other countries (eg 👇) cos of data question marks. He was unusually explicit that this was all based on data collected by UK on those travelling here
https://twitter.com/smahonachie/status/1394364347334512641
Full @skynews story/analysis: why does the government keep changing its story on why it waited crucial weeks before putting India on the #covid19 red list? And why don't its numbers seem to add up? news.sky.com/story/covid-19…
In case you missed it last night, here’s my full video explainer:
Why was India left off the #COVID19 red list so long?
Why don’t the government’s explanations seem to add up?
And is there ANY logic in its decisions about which countries are red-listed?
Why was India left off the #COVID19 red list so long?
Why don’t the government’s explanations seem to add up?
And is there ANY logic in its decisions about which countries are red-listed?
Yday morning, hours before posting this thread & story, I sent @DHSCgovuk the data above & asked why there was such a disparity between them and @MattHancock's explanations for why India was not red-listed along with Pakistan/Bangladesh. A day & a half later, they've just replied
Normally I'd just post the govt statement but in this case, in the interests of transparency, I'll also post my questions verbatim. So you can judge for yourself how satisfactorily they were answered.


• • •
Missing some Tweet in this thread? You can try to
force a refresh