The three key drivers of inflation are now running at all cylinders.
Time for a thread.
👇👇👇
Time for a thread.
👇👇👇
The demand side.
In April 2020, household savings peaked at $6.4 trillion.
Subsequently, $3.6 trillion of consumer spending was unleashed over the next twelve months.
That is equivalent to 7.5 times the historical average annual spending adjusted for inflation.
In April 2020, household savings peaked at $6.4 trillion.
Subsequently, $3.6 trillion of consumer spending was unleashed over the next twelve months.
That is equivalent to 7.5 times the historical average annual spending adjusted for inflation.
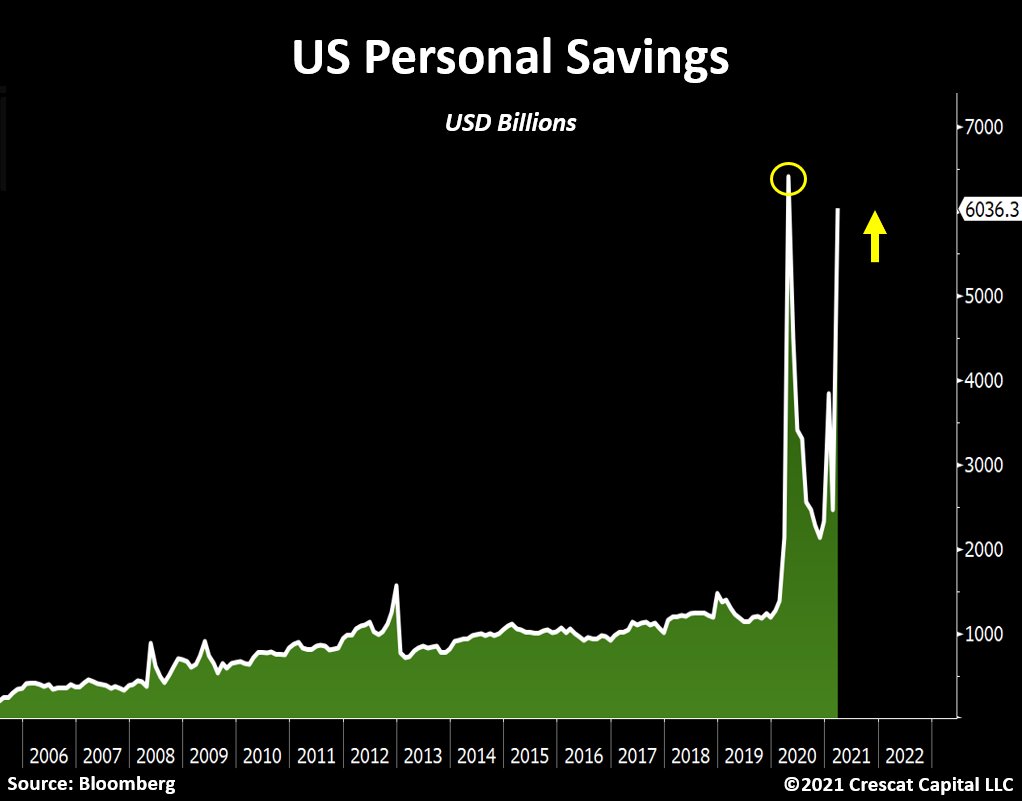
This is relevant because household savings came out recently, and the number shot up to $6 trillion again.
With the economy re-opening, we estimate that consumer spending could surge to as high as $4.5 trillion in the next 12 months.
With the economy re-opening, we estimate that consumer spending could surge to as high as $4.5 trillion in the next 12 months.
It is also important to consider the fact that the balance sheet of US households, especially those in the bottom 50% of net worth, also looks significantly stronger.
The total liability to asset ratio for the lower class is not only in a long-term downward trend, but it is now at its best condition in almost two decades.

Additionally, historic amounts of savings are likely to create a wave of consumption that the supply chain is ill-equipped to handle.
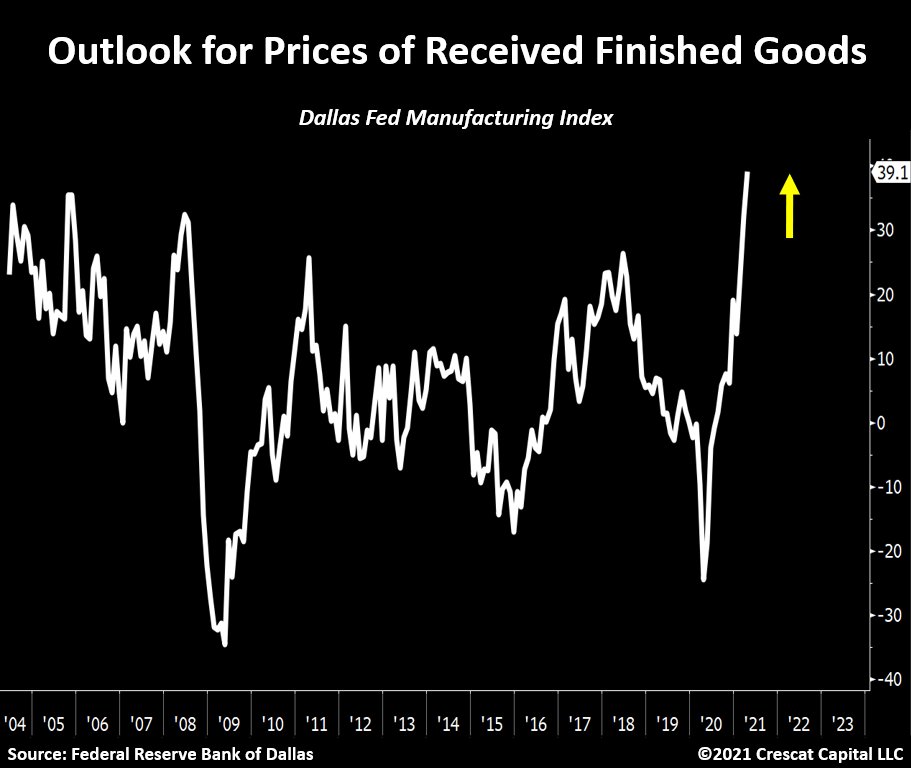
This brings us to the second pillar of inflation.
This brings us to the second pillar of inflation.

Back in December, we wrote about the economic ramifications the US suffered during the Spanish Flu of 1919 and how that period should serve as a roadmap for the current macro environment.
As the economy shut down then, industrial capacity was drastically reduced, and with that a major gridlock in the production of raw materials was created, particularly within the natural resources sector of the economy.
In a very similar fashion to today, this bottleneck resulted in severe upward pricing pressure in consumer goods.
We now believe a second wave of these developments is underway.
In our view, the economy is at the early stages of an upsurge in labor-management conflict.
We now believe a second wave of these developments is underway.
In our view, the economy is at the early stages of an upsurge in labor-management conflict.
As the general supply shortages escalate and consumers start noticing the inflationary burden in their daily expenses, pressure to increase wages is sure to follow.
To provide some context, we experienced this problem across all industries of the economy during the Spanish Flu.
To provide some context, we experienced this problem across all industries of the economy during the Spanish Flu.
Back then, workers revolted against their employers by demanding materially higher wages and salaries.
In fact, one out of five people in the US labor force was engaged in a strike.
We believe a similar trend is brewing in the US today.
In fact, one out of five people in the US labor force was engaged in a strike.
We believe a similar trend is brewing in the US today.
Large restaurant chains such as McDonalds and Chipotle are already experiencing pressure from employees to increase pay and provide more appropriate work conditions.
We think it is a matter of time until further protests emerge in other parts of the economy.
We think it is a matter of time until further protests emerge in other parts of the economy.
However, another important factor today that is significantly more inflationary than in Spanish Flu times, is that government policies are magnifying the labor shortage issue by discouraging folks to get back to work.
People continue to leave the labor force like never before.
People continue to leave the labor force like never before.
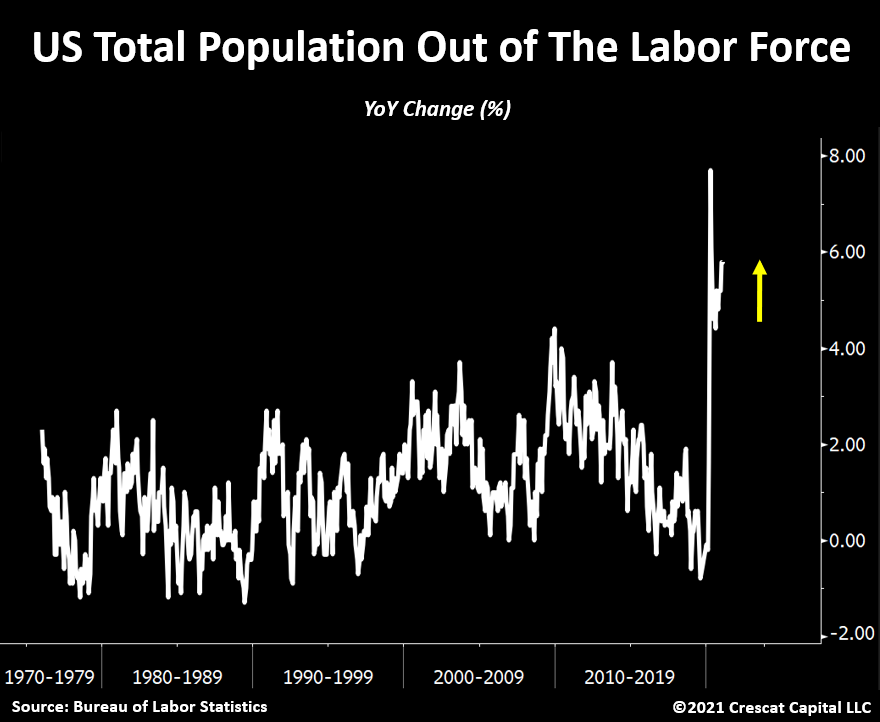
This trend has already been happening in the mining industry for long time.
It’s a classic early sign of a commodity cycle.
We saw it in early 1970s and 2000s.
Both marking the onset of a commodities bull market.
It’s a classic early sign of a commodity cycle.
We saw it in early 1970s and 2000s.
Both marking the onset of a commodities bull market.

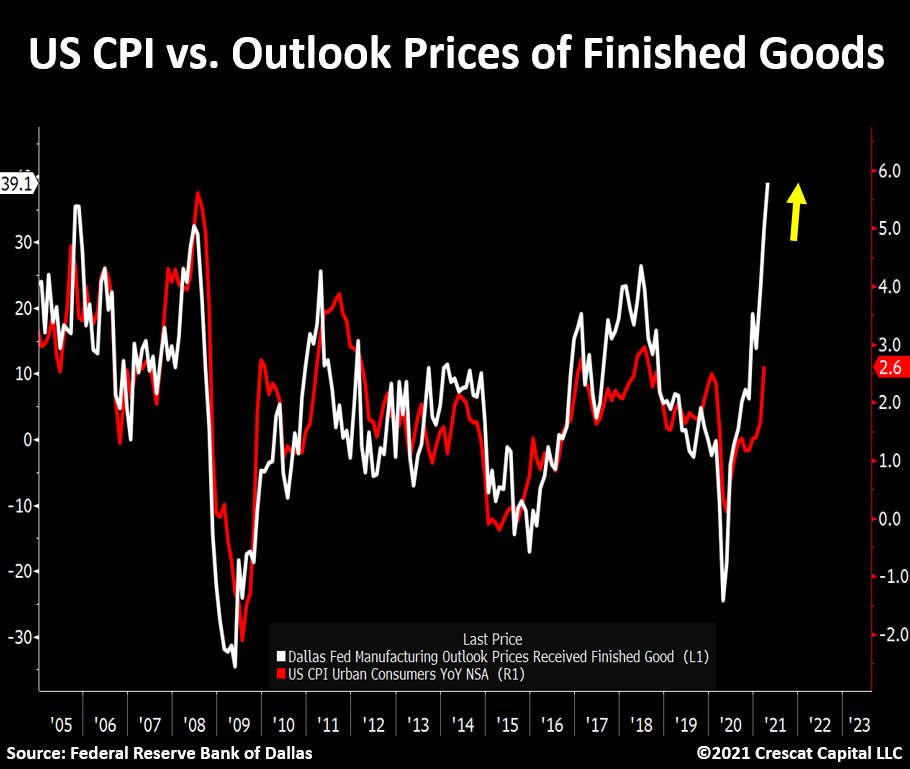
Amid such a macro puzzle one thing is clear, inflation is progressively turning into the prevailing narrative among people.
The acuity of the natural resource supply and labor shortage problem is not only leading to higher consumer prices, but it is also creating a reflexivity dynamic that feeds a longer-lasting inflationary story.
The idea here is:
Inflation is no longer transitory when expectations for rising prices become imbedded in consumer and business spending and investment decisions.
Inflation is no longer transitory when expectations for rising prices become imbedded in consumer and business spending and investment decisions.
Such was the wage-price spiral that defined the 70s macro landscape in the US and is likely to be a main feature of the current decade.
Interestingly, the n. of companies that mentioned the word “inflation” on earnings calls is now growing at a pace that we never seen before.
Interestingly, the n. of companies that mentioned the word “inflation” on earnings calls is now growing at a pace that we never seen before.
The same is happening with Google trends, see below. Long-term inflationary cycles are often initiated by a general concern of the population in holding cash.
Until now, annual increases in wages and salaries had been in a downward trend for 40 years.
Over that same time frame, the corporate cost of capital has declined.
This macro landscape encouraged companies to favor growth over profitability.
Over that same time frame, the corporate cost of capital has declined.
This macro landscape encouraged companies to favor growth over profitability.
More recently, the post GFC years of ongoing accommodative monetary policies have enabled the largest number of money-losing businesses in history.
As a byproduct, traditional value-investing principles have become highly out of favor while growth and index style investing have pre-dominated.
But now, with inflationary forces in new full swing, we believe a major trend reversal is upon us.
Analogous to noticeable macro cycles throughout history, the effectiveness of equity fundamental factors also changes over time.
Analogous to noticeable macro cycles throughout history, the effectiveness of equity fundamental factors also changes over time.
We believe near-term growth, profitability, and valuation factors will become priorities again as part of the security selection process.
This development has already started to take place.
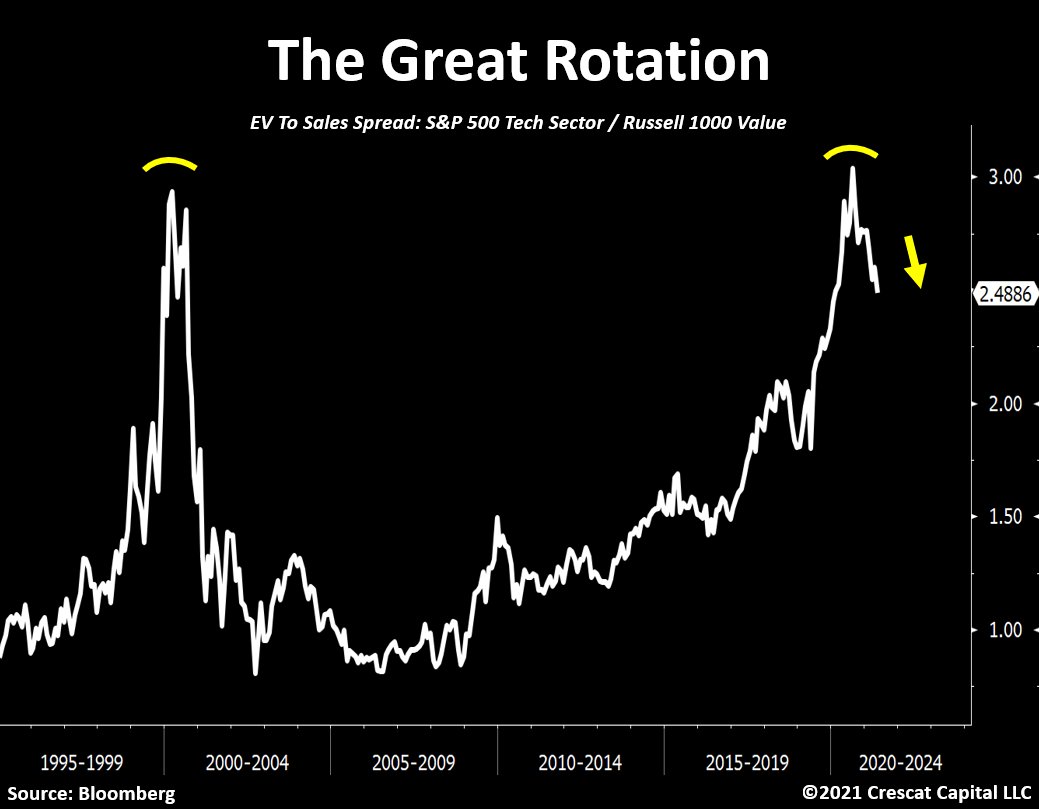
We have been calling it “The Great Rotation”.
This development has already started to take place.
We have been calling it “The Great Rotation”.
The chart below shows the enterprise value-to-sales ratio differential between high flying technology and value stocks.
Note the comparison between the early stages of the 2001-02 tech bust and today.
Note the comparison between the early stages of the 2001-02 tech bust and today.
Our premise continues to hold that capital will flow out of expensive long-duration growth equities and fixed income securities and into a narrow group of tangible commodities in scarce supply and high demand.
This is an incredibly bullish set up for low valuation natural resource stocks that offer high cyclical near-term growth prospects, strong profit visibility, and inflation hedging properties.
At historically high broad market valuations for equities, we see downside risk for unprofitable companies with high debt and low pricing power in the current macro environment.
Lastly, the third pillar of inflation is monetary debasement.
The current framework of analyzing the state of the labor market and the true levels of inflation in the economy to rationalize the appropriate monetary policy has never been so unfitting.
The current framework of analyzing the state of the labor market and the true levels of inflation in the economy to rationalize the appropriate monetary policy has never been so unfitting.
By solely observing the recent macro data, Jerome Powell and the other Fed members had all the right reasons to signal tapering in their last meeting and decided not to.
Contrary to what most believe, today’s quantitative easing program and near zero interest rates completely disregard both sides of the central bank’s dual mandate which is supposed to be to control inflation and maintain full employment.
Instead, in our view, monetary policy has only one clear objective: to prevent interest rates from rising so that our government can fund massive fiscal spending.
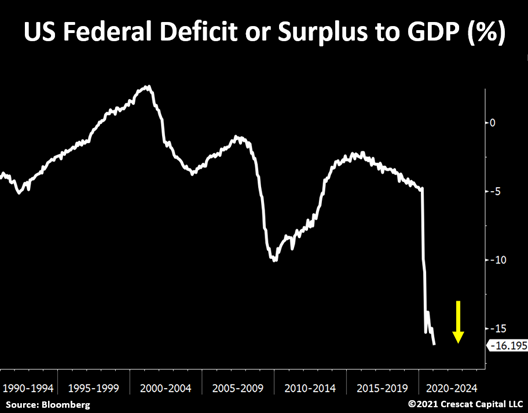
So now we genuinely ask:
How can the Fed reverse its ultra-easy monetary policies with an economy running a twin deficit of 25% of the nominal GDP?
How can the Fed reverse its ultra-easy monetary policies with an economy running a twin deficit of 25% of the nominal GDP?

Or, on another thought:
How does the Fed unwind the alligator mouth below?
Corporate debt has grown to near all-time highs while bond yields remain near all-time lows. Again, this is all product of easy money policies.
How does the Fed unwind the alligator mouth below?
Corporate debt has grown to near all-time highs while bond yields remain near all-time lows. Again, this is all product of easy money policies.

Ultimately, the Treasury market holds the key for the health of the financial system.
With current high debt-to-GDP levels, the economy has an inherent need for loose financial conditions.
With current high debt-to-GDP levels, the economy has an inherent need for loose financial conditions.
Correspondingly, the sheer magnitude of the excess liquidity in the markets has created one of the most speculative investment environments of all times.
As such, any marginal increase in interest rates would be detrimental for financial assets at near record valuations.
As such, any marginal increase in interest rates would be detrimental for financial assets at near record valuations.
Truth be told, a highly indebted and broken government is at mercy of the Fed.
Policy makers have no other options than to continue pumping liquidity into the system while making absurd claims to justify their actions.
Policy makers have no other options than to continue pumping liquidity into the system while making absurd claims to justify their actions.
Consumer goods have gone vertical in prices in the last 1-2 years and, bizarrely, the Fed’s own calculation of inflation just reached a 7-year low.
This is what they call a “data-driven” approach?
This is what they call a “data-driven” approach?

As stimulative packages become exponentially larger in size, the curve of efficacy for monetary policy is peaking.
We believe the Fed stimulus is transitioning from a diminishing return phase to a negative one.
We believe the Fed stimulus is transitioning from a diminishing return phase to a negative one.
The scarcity of financial assets yielding anything in real terms is creating a vigorous capital flow dynamic that is incredibly attractive for undervalued tangible assets.
With growing concerns of monetary debasement emerging, investors continue to bid up commodity prices, leading to higher consumer prices.
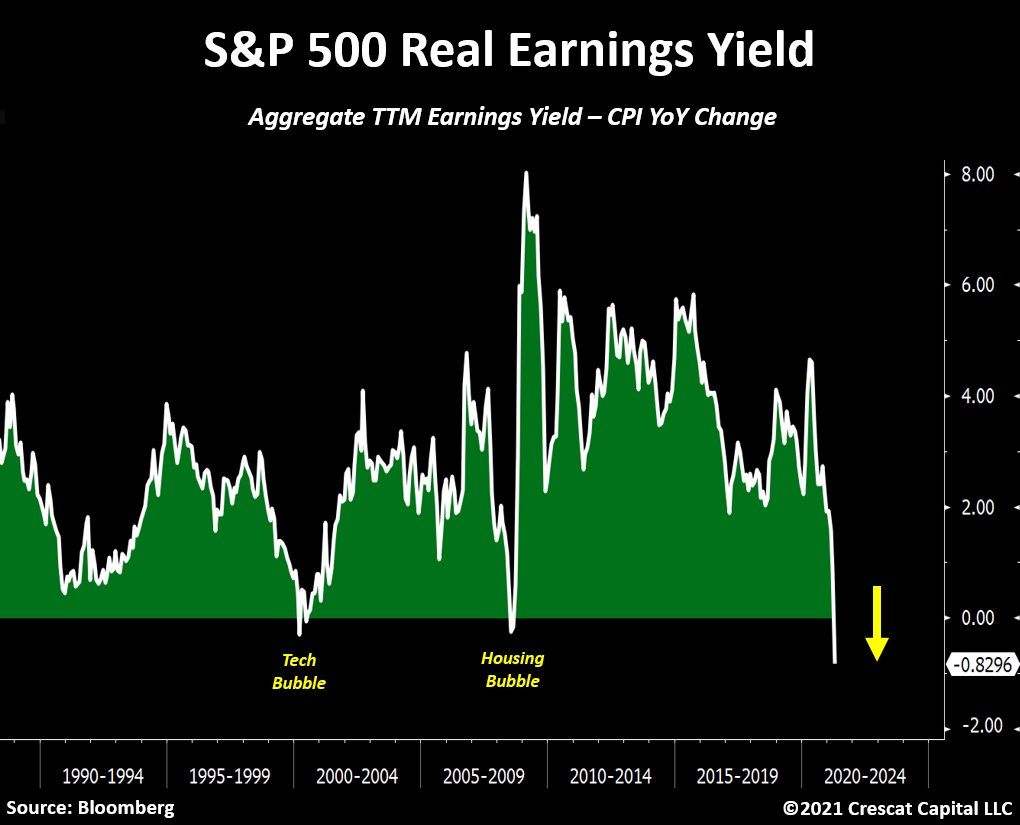
This should start becoming an issue for equity markets at excessive valuations yielding less than inflation.
For instance:
The S&P 500 earnings yield adjusted for CPI is now at its most negative level in 30 years.
For instance:
The S&P 500 earnings yield adjusted for CPI is now at its most negative level in 30 years.
Monetary dilution can only lead to higher financial asset prices until inflation begins to develop.
At that point, as capital cost rises, Fed’s policies become counterproductive, and a price reset for historically overvalued assets is needed.
At that point, as capital cost rises, Fed’s policies become counterproductive, and a price reset for historically overvalued assets is needed.
With regards to portfolio positioning:
We believe overall equities will continue to underperform commodities, especially monetary metals.
We believe overall equities will continue to underperform commodities, especially monetary metals.
The Philadelphia Gold & Silver Index to S&P 500 ratio is now breaking out from an important resistance and it looks to be resuming an upward trend that initiated in the fourth quarter of 2018.
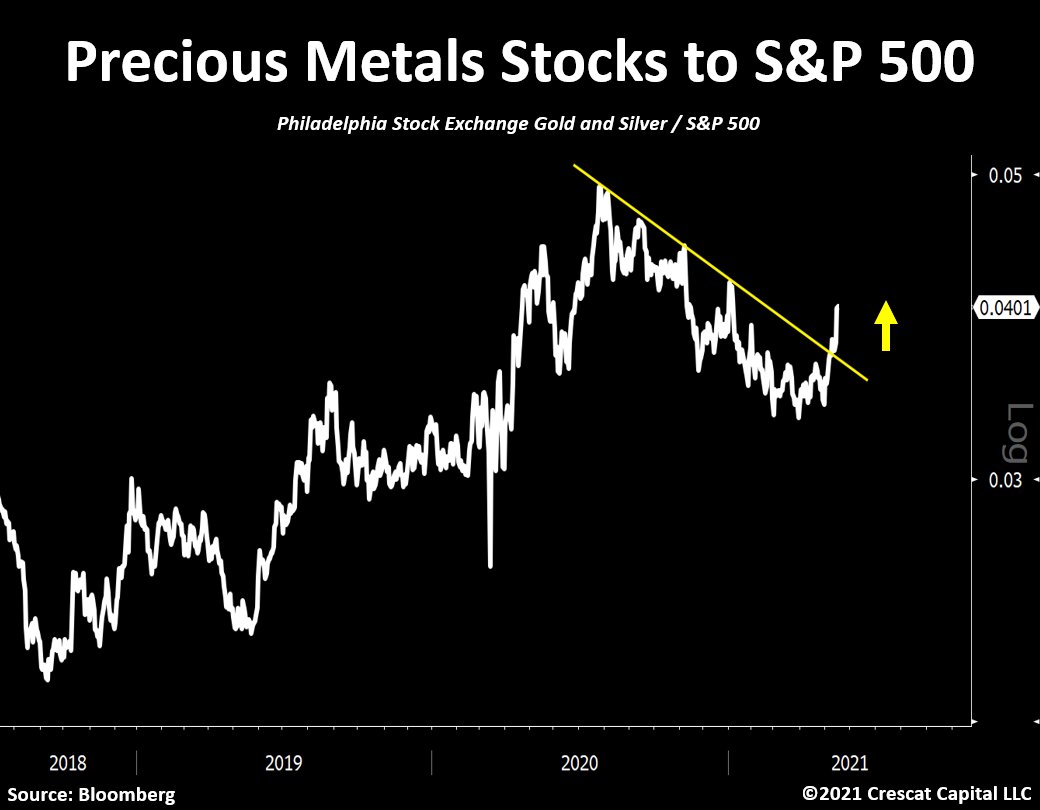
As long-term investors, we appreciate how much value can be unlocked in gold and silver mining industry while also offering an incredible growth opportunity.
With metal prices at their current levels, mining companies continue to improve their margins, tighten up their cost structure, and generate more money than any other time in history.
The aggregate FCF for the top 50 gold and silver miners is now growing exponentially.
The aggregate FCF for the top 50 gold and silver miners is now growing exponentially.

Believe it or not, today, 73% of the top 50 gold and silver miners are profitable on a free cash flow basis.
That is the highest level we have ever seen.
That is the highest level we have ever seen.

The fundamental improvement in the overall industry is a central part of our thesis and the reason why each of our hedge funds have significant exposure in exploration-stage companies.
As the larger and more established companies deplete their reserves and continue to build a strong cash balance foundation, we think they will be compelled to acquire high-quality projects to replenish their production pipelines.
This is especially the case today due to an overly conservative management that is unwilling to spend on exploration.
It is a matter of time until major producers begin to look for highly economic deposits as an alternative to their supply cliff problem.
It is a matter of time until major producers begin to look for highly economic deposits as an alternative to their supply cliff problem.
• • •
Missing some Tweet in this thread? You can try to
force a refresh