Lowest 10 States - COVID Mortality Year-Over-Year
This is Reported Death Per Million shown Year-over-Year for the 10 states with the lowest COVID mortality.
This is Reported Death Per Million shown Year-over-Year for the 10 states with the lowest COVID mortality.


Oregon and Washington by themselves on the same scale.
Note that 1/M/Day is very low.
Note that 1/M/Day is very low.


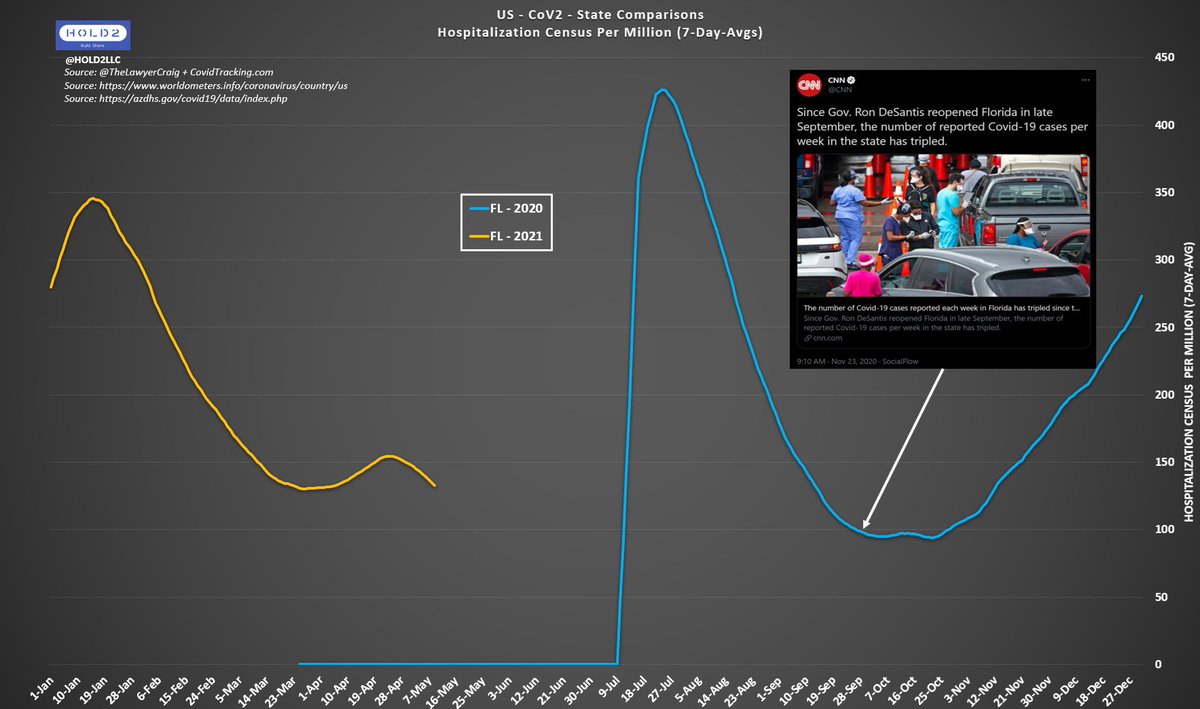
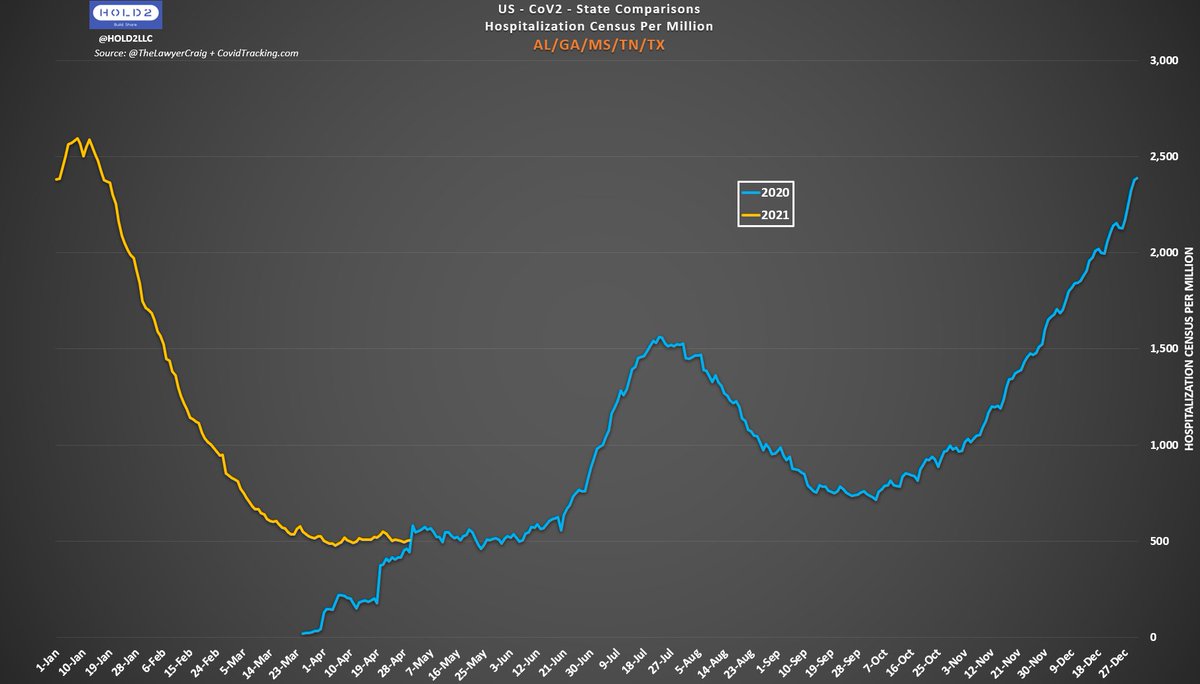
These charts show Hospitalization Census Per Million for 2 groups:
Chart 1) The 5 states with the highest COVID Mortality
Chart 2) The 5 states with the lowest COVID Mortality
Same scale.
Bottom 5 are higher than last year but overall extremely low. Peak barely above 100/M.
Chart 1) The 5 states with the highest COVID Mortality
Chart 2) The 5 states with the lowest COVID Mortality
Same scale.
Bottom 5 are higher than last year but overall extremely low. Peak barely above 100/M.


Here are the middle 40 states (subtracting the top 5 and bottom) in cumulative COVID mortality.

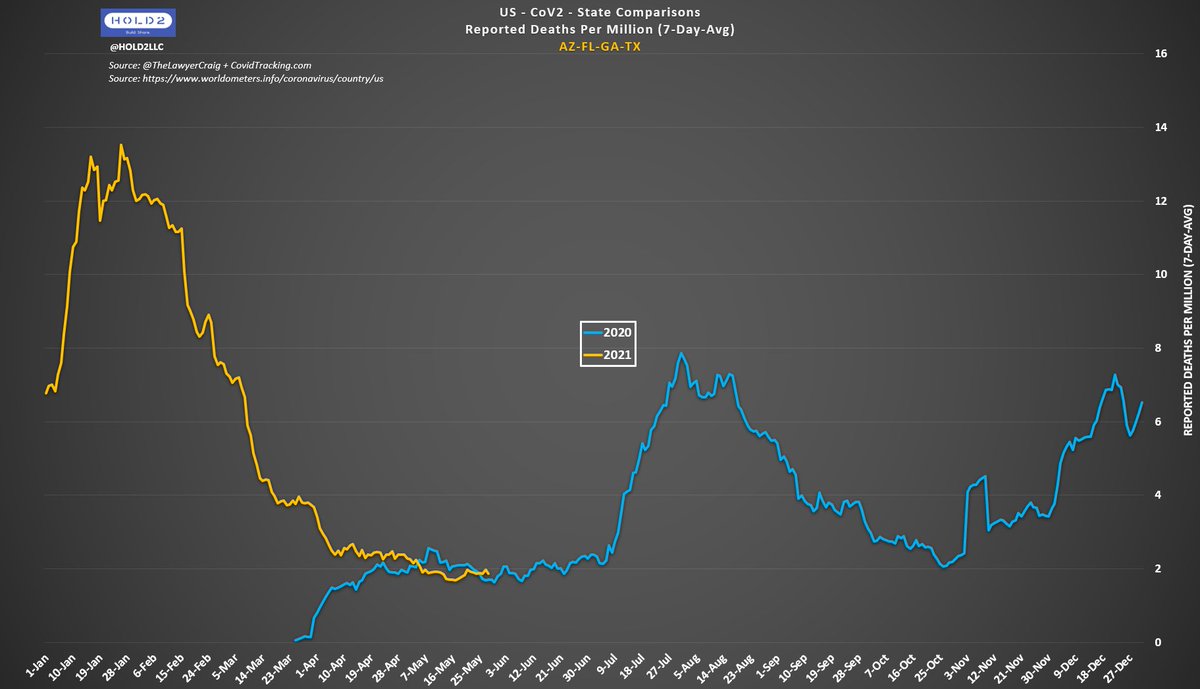
Reported Deaths Per Million for AZ/FL/GA/TX together.
Hmm.
Hmm.
• • •
Missing some Tweet in this thread? You can try to
force a refresh