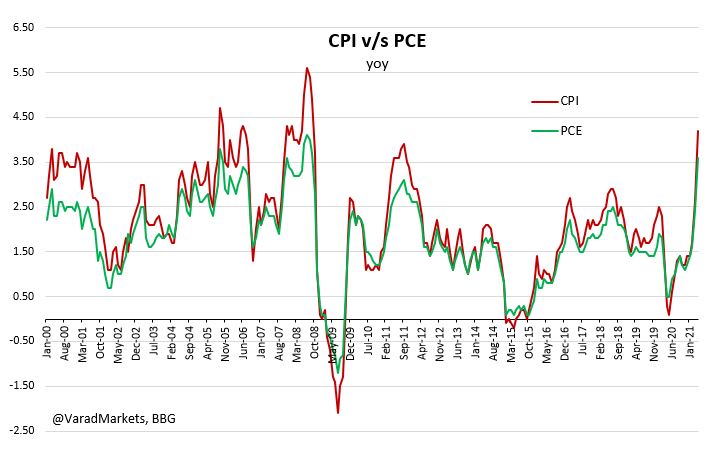
US #Inflation #DiveIn: CPI v/s PCE
Also why FED follows PCE?
▪️ Attached Summary of differences
▪️ Since 2000, overall CPI ~11% higher than PCE
▪️ Definition:
🔹 CPI: Out-of-pocket spending by non-institutional Urban Consumers
🔹 PCE: Includes Rural & all personal sector
1/12
Also why FED follows PCE?
▪️ Attached Summary of differences
▪️ Since 2000, overall CPI ~11% higher than PCE
▪️ Definition:
🔹 CPI: Out-of-pocket spending by non-institutional Urban Consumers
🔹 PCE: Includes Rural & all personal sector
1/12


Four Sources of differences: Scope, Formula, Weight, Others Effects
1⃣ Scope Effect:
🔹 CPI: Consumer Price Index => Survey of Households
🔹 PCE: Personal Consumption Expenditure => Survey of Businesses
▪️ 25% of PCE spending not captured by CPI
2/12
1⃣ Scope Effect:
🔹 CPI: Consumer Price Index => Survey of Households
🔹 PCE: Personal Consumption Expenditure => Survey of Businesses
▪️ 25% of PCE spending not captured by CPI
2/12
▪️ PCE includes spending by Govt, Firms, Non-Profits on behalf of Households
- E.G: Medical spending = Direct purchases by Consumers + Spending on medical goods & services by Medicare OR Employer's Health Insurance
- E.G: Public school education not an out-of-pocket spending
3/12
- E.G: Medical spending = Direct purchases by Consumers + Spending on medical goods & services by Medicare OR Employer's Health Insurance
- E.G: Public school education not an out-of-pocket spending
3/12
- E.G: Imputed cost of fin servs that do not involve out-of-pocket spending => not in CPI
2⃣ Formula Effect:
- PCE's Fisher Ideal Formula better reflects consumer behaviour of substituting away from products with rising prices
- CPI's Laspeyres holds weights fixed for 2yrs
4/12
2⃣ Formula Effect:
- PCE's Fisher Ideal Formula better reflects consumer behaviour of substituting away from products with rising prices
- CPI's Laspeyres holds weights fixed for 2yrs
4/12

3⃣ Weight Effect:
- PCE's broader scope implies smaller weight to items common to both
- Housing ~33% weight in CPI but ~16% in PCE
- Gasoline/Energy heavier in CPI than PCE
- Rent/Gasoline Inflation would tend to lift CPI above PCE inflation
@chigrl
5/12
- PCE's broader scope implies smaller weight to items common to both
- Housing ~33% weight in CPI but ~16% in PCE
- Gasoline/Energy heavier in CPI than PCE
- Rent/Gasoline Inflation would tend to lift CPI above PCE inflation
@chigrl
5/12
4⃣ Other Effects: Seasonal Adjustments & Revisions
🔹 CPI: Methodological improvements not applied to historical data => in a way good as CPI is used for Indexing, Social Security benefits, financial instruments
🔹 PCE: Improvements/Revisions applied to entire history
6/12
🔹 CPI: Methodological improvements not applied to historical data => in a way good as CPI is used for Indexing, Social Security benefits, financial instruments
🔹 PCE: Improvements/Revisions applied to entire history
6/12
▪️ Weight & Scope Effect dominant drivers followed by Formula Effect
▪️ Weight Effect (+ve) has tended to push CPI above PCE
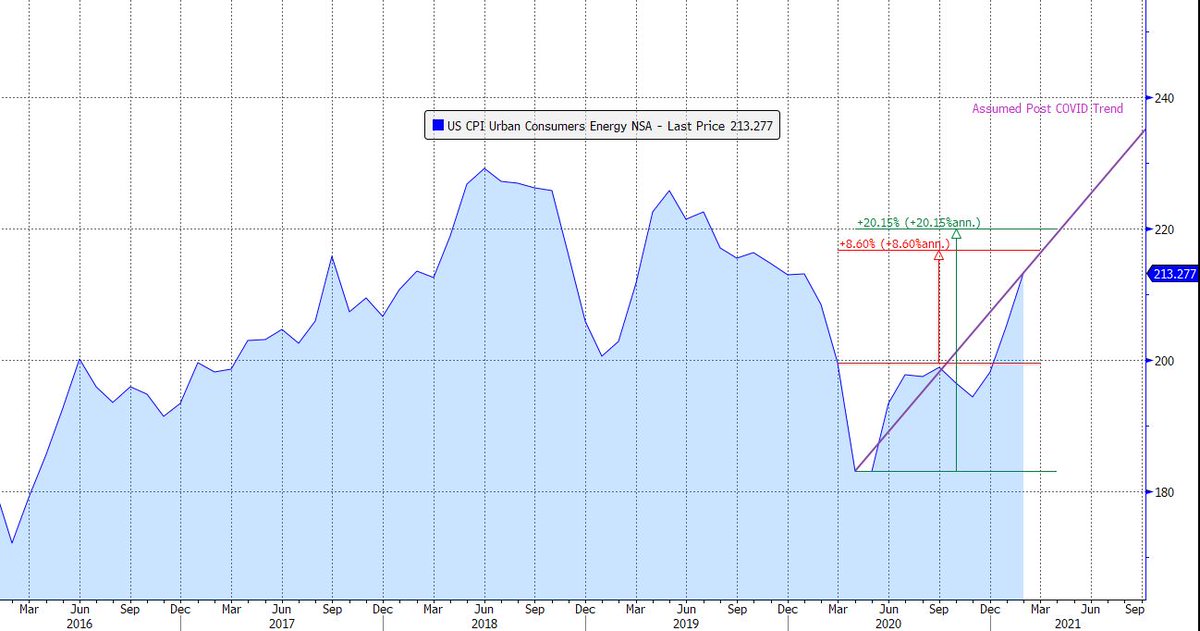
▪️ Q4'08-Q1'09 saw collapse in Energy prices => pushed down CPI more than PCE given Energy's heavier weight in CPI; similar in 2014-15 & dip in 2020
7/12
▪️ Weight Effect (+ve) has tended to push CPI above PCE
▪️ Q4'08-Q1'09 saw collapse in Energy prices => pushed down CPI more than PCE given Energy's heavier weight in CPI; similar in 2014-15 & dip in 2020
7/12

Four Items leading to key differences:
🔹 Healthcare=>PCE has third party expenses
🔹 Housing=>methodology & definition differences
🔹 Education=>PCE has third party expenses
🔹 Vices (Alcohol, etc)=>Consumers (CPI) may not admit, while Businesses not shy of reporting (PCE)
8/12
🔹 Healthcare=>PCE has third party expenses
🔹 Housing=>methodology & definition differences
🔹 Education=>PCE has third party expenses
🔹 Vices (Alcohol, etc)=>Consumers (CPI) may not admit, while Businesses not shy of reporting (PCE)
8/12
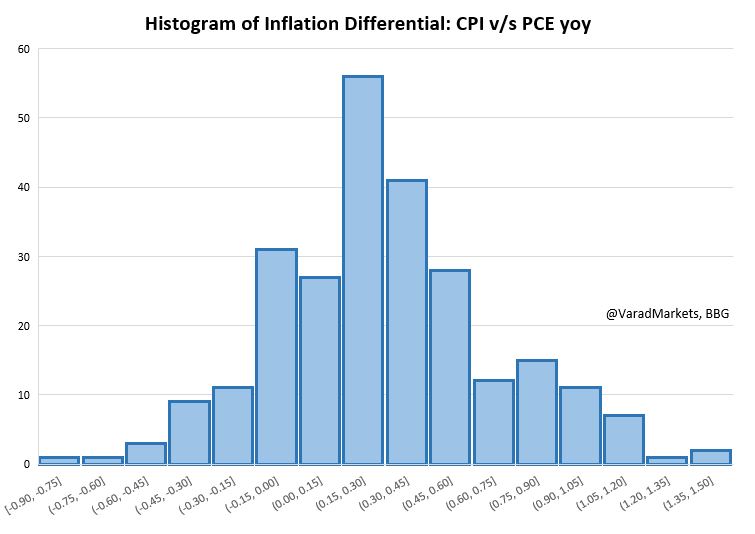
▪️ Median Difference b/w YoY Inflation Rates (CPI v/s PCE) has come off recently since COVID
▪️ But in April, CPI again spiked above PCE given massive jump in CPI-heavy Energy prices
Median Difference:
21yr history: 0.30%
5yr history: 0.30%
Post-COVID: 0.05%
9/12
▪️ But in April, CPI again spiked above PCE given massive jump in CPI-heavy Energy prices
Median Difference:
21yr history: 0.30%
5yr history: 0.30%
Post-COVID: 0.05%
9/12

So why Fed likes PCE over CPI?
Three key reasons summarized in report to Congress in 2000 when switch was made
1⃣ PCE's better substitution effect v/s fixed weight CPI (Ref 4/12 above)
2⃣ PCE's broader coverage (Ref 2-3/12)
3⃣ Ability to revise historical PCE (Ref 6/12)
10/12
Three key reasons summarized in report to Congress in 2000 when switch was made
1⃣ PCE's better substitution effect v/s fixed weight CPI (Ref 4/12 above)
2⃣ PCE's broader coverage (Ref 2-3/12)
3⃣ Ability to revise historical PCE (Ref 6/12)
10/12


Fed actually like "Core" PCE even more (excludes Food/Energy) as Headline more volatile => another debate (may require another thread) whether Fed should focus on Headline or Core
Since 2000, Headline CPI v/s Core PCE Median difference = 0.40% (handy conversion guide)
11/12
Since 2000, Headline CPI v/s Core PCE Median difference = 0.40% (handy conversion guide)
11/12

Wow, look at the volatility of Energy Inflation => have to go in favour of Core
But, have fun with Bullard's (St Louis Fed) counter view: "The Core is Rotten"
files.stlouisfed.org/files/htdocs/p…
But, have fun with Bullard's (St Louis Fed) counter view: "The Core is Rotten"
files.stlouisfed.org/files/htdocs/p…

• • •
Missing some Tweet in this thread? You can try to
force a refresh