Is inflation really "transitory" as the Fed insists? Will labor shortages ease by fall? Can workers expect more raises?
I can't tell you any of that. But I *can* tell you what indicators to watch in this strange moment for the U.S. economy.
nytimes.com/2021/06/03/bus…
I can't tell you any of that. But I *can* tell you what indicators to watch in this strange moment for the U.S. economy.
nytimes.com/2021/06/03/bus…
1. Prices are up, but mostly in categories with clear links to the pandemic. The question is whether it spreads. (Although, as @ConstanceHunter reminded me: "Transitory does not mean it's not disruptive.")
It's tempting to create ad hoc baskets of goods (ex-leisure, ex-autos, ex-... other stuff that doesn't fit my narrative), but it's easy to wind up cherry-picking, intentionally or otherwise.
For a more empirical approach, watch the @sffed's "Covid-insensitive" inflation index, or the myriad "trimmed-mean"/"median" aggregates, which try to find the signal in the noise.
frbsf.org/economic-resea…
frbsf.org/economic-resea…
Alternatively, just focus on rents. Rent (and owner's equivalent rent) are by far the biggest component in CPI, and (outside of places like New York) should be less affected by Covid disruptions than other categories. If rents are rising, good chance overall inflation is too.
2. Inflation expectations matter. (Well, we think they do.) For consumers, focus on longer-run expectations, which are less affected by things like gas prices. 

Many forecasters prefer to focus on market-based measures of inflation expectations (like the five-year, five-year forward rate derived from the Treasury market). But those have their own issues. (Have you *looked* at the TIPS market lately?)
Easier solution: The Fed's new "Index of Common Inflation Expectations," which means you don't have to choose just one measure. The downside: It only comes out quarterly.
federalreserve.gov/econres/notes/…
federalreserve.gov/econres/notes/…
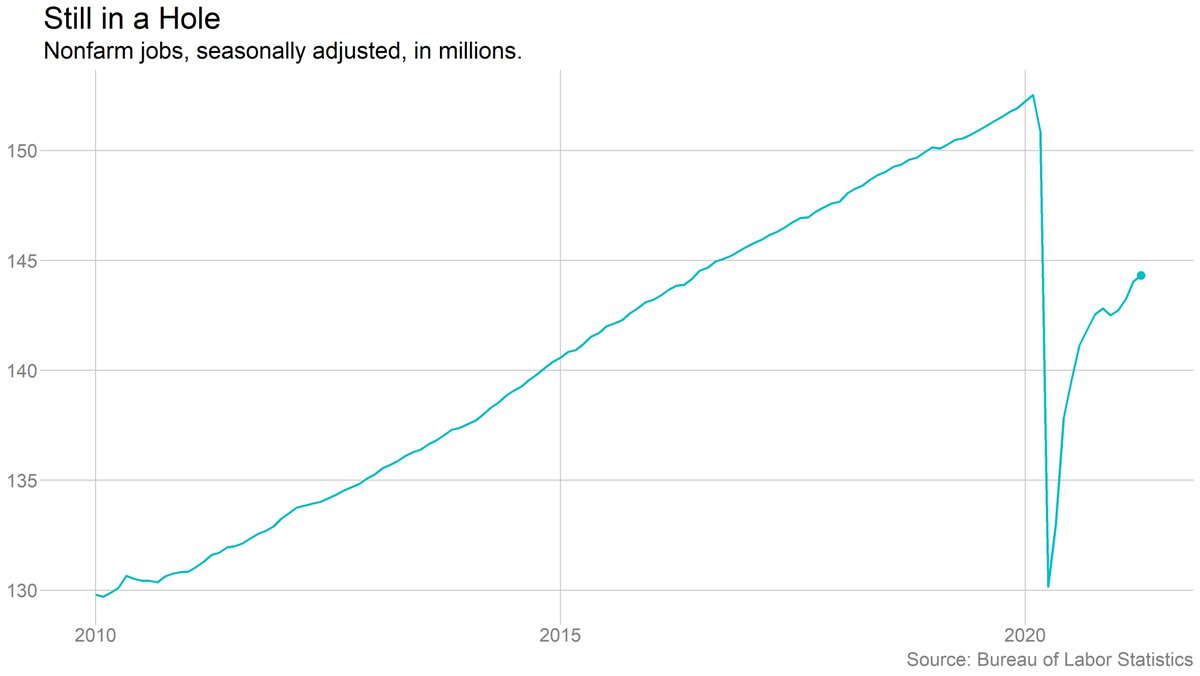
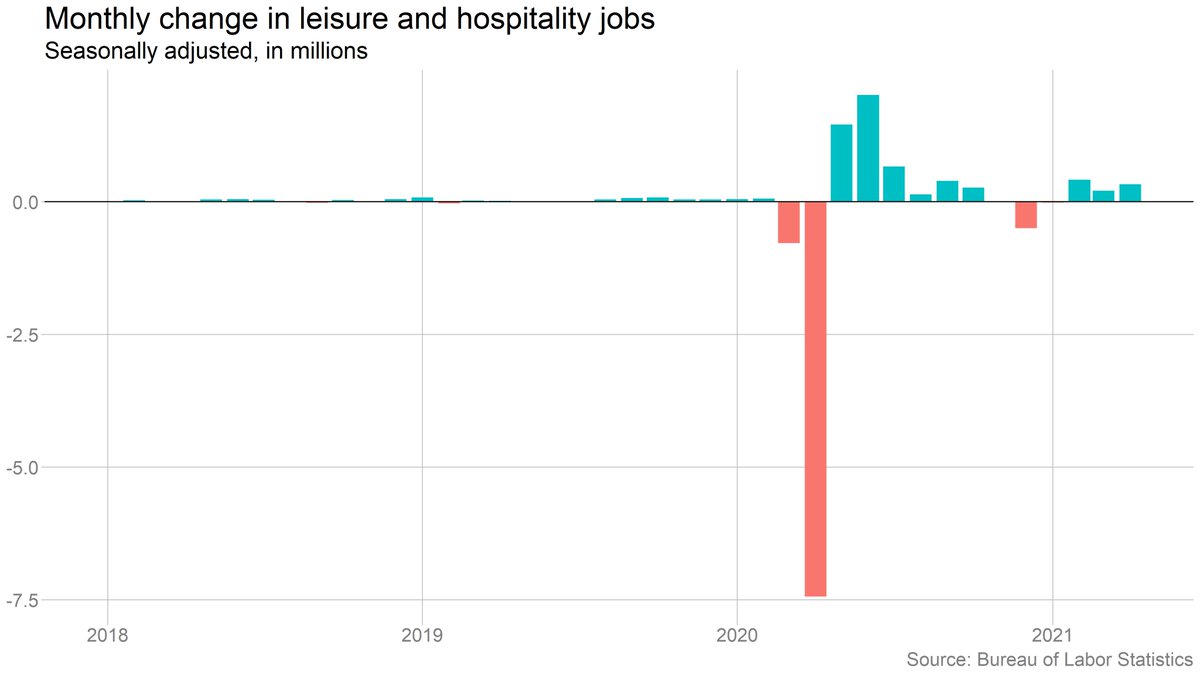
3. Labor supply. Set aside for a moment the (important) debate over why businesses are having trouble hiring, and focus on a related but separate question: How long will the present "labor shortage" last?
Tomorrow's jobs report will provide an update on labor force participation, which will be a sign of whether people are coming off the sidelines. (I'll be especially interested in the split by gender, given recent discussions of the role of child care disruptions.)
Also worth watching the number of unemployed workers per job opening. The official figures on openings, from JOLTS, lag by a month. But as @jasonfurman has noted, the weekly data from @indeed track the government numbers closely.

But any measure of labor supply that relies on the unemployment rate runs into issues around who gets counted. Take people with short-term child care issues: It arguably makes sense not to include them in the immediate labor force, but they're v. relevant to medium-term supply.
One suggestion (from @ConstanceHunter again): Focus on the number of involuntary part-time workers ("part-time for economic reasons"). If companies are having trouble hiring, surely they'll give more hours to the people who want them.

(Note also this prepandemic @D_Blanchflower paper on involuntary part-time workers as a measure of labor market tightness.)
cpb-us-e1.wpmucdn.com/sites.dartmout…
cpb-us-e1.wpmucdn.com/sites.dartmout…
4. Wage growth has been surprisingly robust during the pandemic, especially for low-wage workers. In fact, @jeannasmialek and I have a whole story about that today. The question, again, is whether this represents a one-time reset or something longer-term.
nytimes.com/2021/06/03/bus…
nytimes.com/2021/06/03/bus…
The problem here is that U.S. wage data is terrible. The monthly data on earnings is plagued by composition issues. Worker-level data from the CPS is self-reported and volatile month-to-month.
More on this in this story from a few years ago: nytimes.com/2018/03/12/bus…
More on this in this story from a few years ago: nytimes.com/2018/03/12/bus…
The best thing to do is to wait for quarterly data from the Employment Cost Index, which attempts to control for shifts in industry/occupational composition. You can bet people will be watching the Q2 report *very* closely.

(Side note: I'm a fan of the @AtlantaFed's wage tracker, but it's not very well-suited to this specific moment, because it effectively drops anyone who lost a job during the pandemic.)
Inevitably, people (including me!) will *not* wait for ECI. So if you're going to look at monthly Average Hourly Earnings data, look at it at the industry level, which will be at least somewhat more insulated from compositional shifts. But again, watch out for cherry-picking.
5. Everything else: PPI, inventories, unit labor costs... pick your favorite! As @TaraSinc told me: “During normal times, you can just track a handful of indicators to know how the economy is doing. When big shifts are going on, you’re tracking literally hundreds of indicators.”
The key question to ask: Are they telling a consistent story? If indicators are basically pointing in the same direction, you can have some confidence you know where we are. (Where we're *going* is harder.) When they're all telling different stories, it's a sign of uncertainty.
Of course, the real answer, as always, is to wait for more data. We'll know a lot more in the fall than we do now. But policy is being made now, which means we have to understand the present moment as best we can. /fin
• • •
Missing some Tweet in this thread? You can try to
force a refresh