B.1.617 Public Reporting
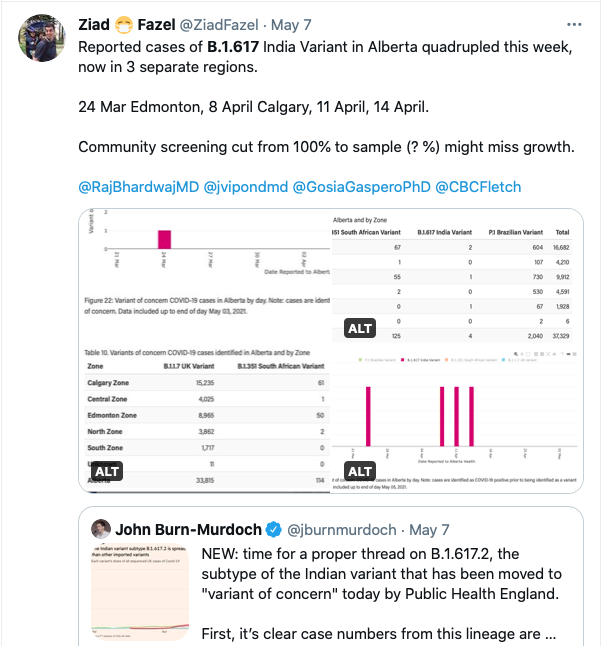
On Tuesday, @CMOH_Alberta minimized spread of B.1.617 in #COVID19AB with:
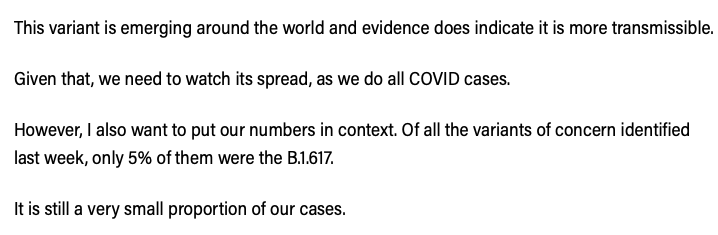
"Of all the variants of concern identified last week, only 5% of them were the B.1.617."
I found this misleading, and I will explain why.
alberta.ca/release.cfm?xI…
@DFisman
On Tuesday, @CMOH_Alberta minimized spread of B.1.617 in #COVID19AB with:
"Of all the variants of concern identified last week, only 5% of them were the B.1.617."
I found this misleading, and I will explain why.
alberta.ca/release.cfm?xI…
@DFisman
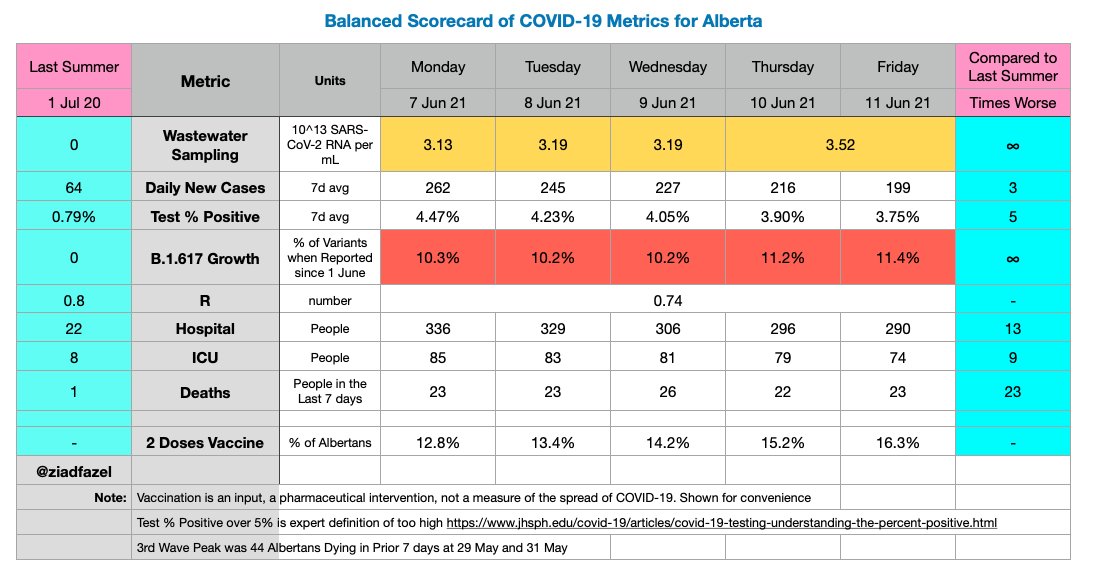
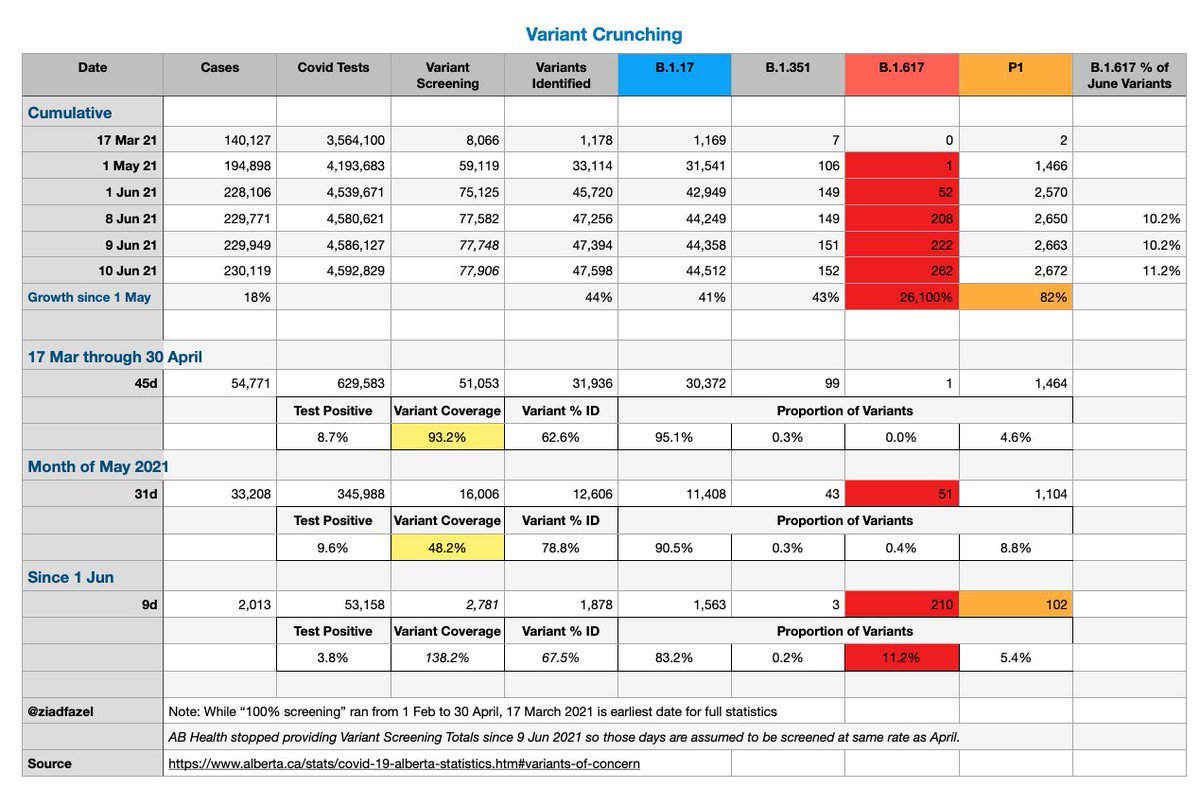
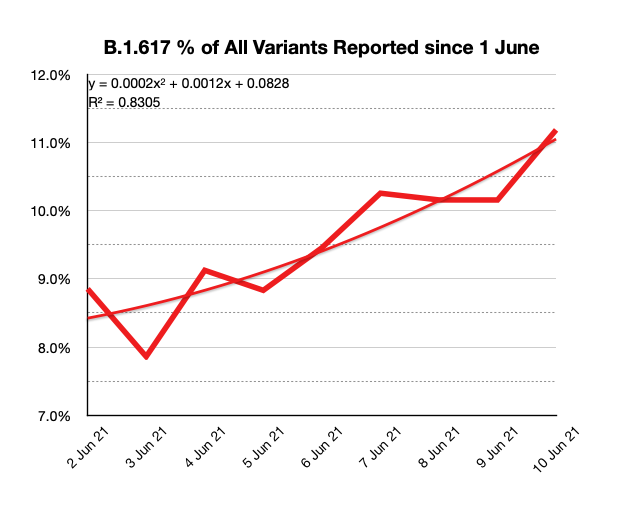
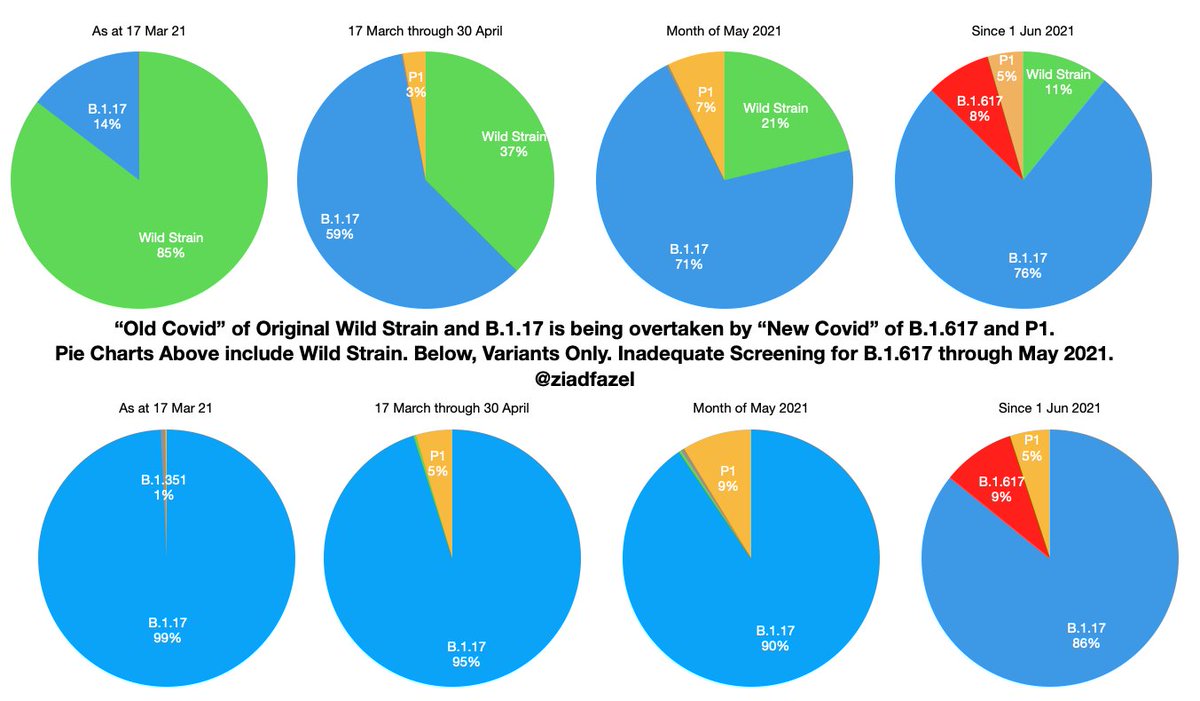
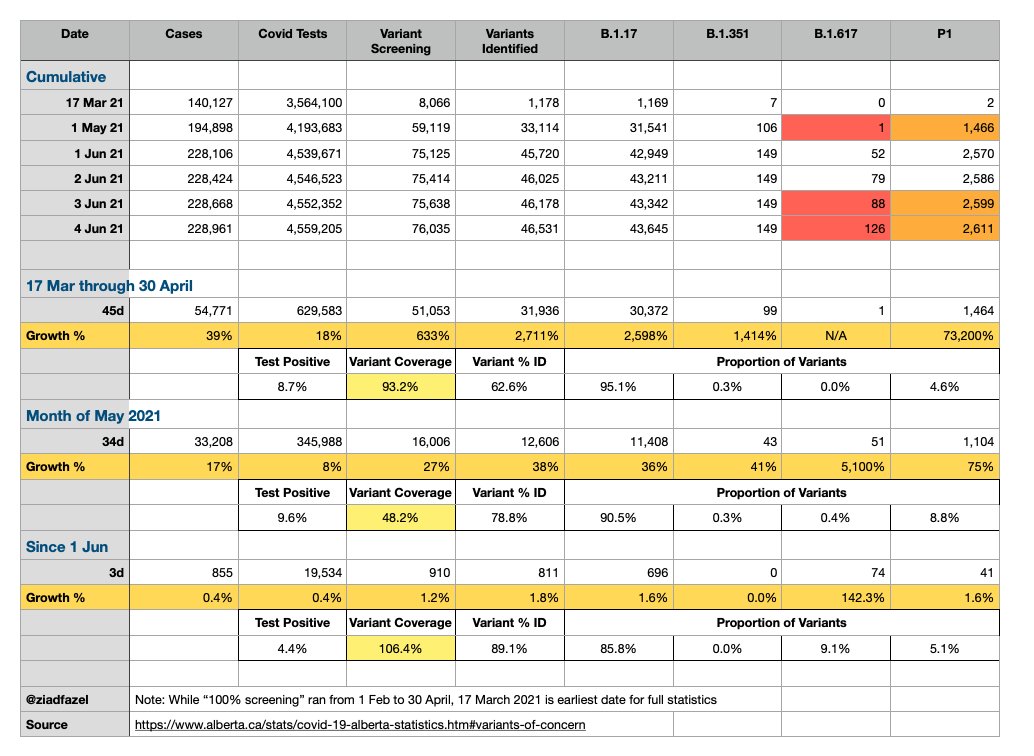
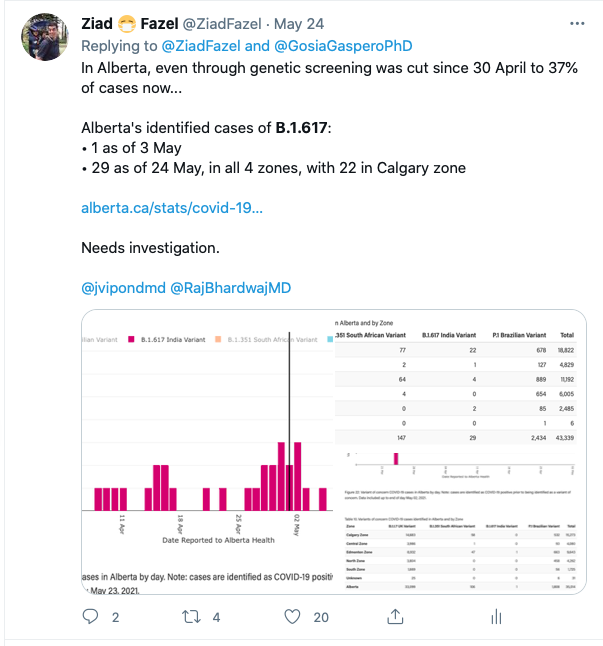
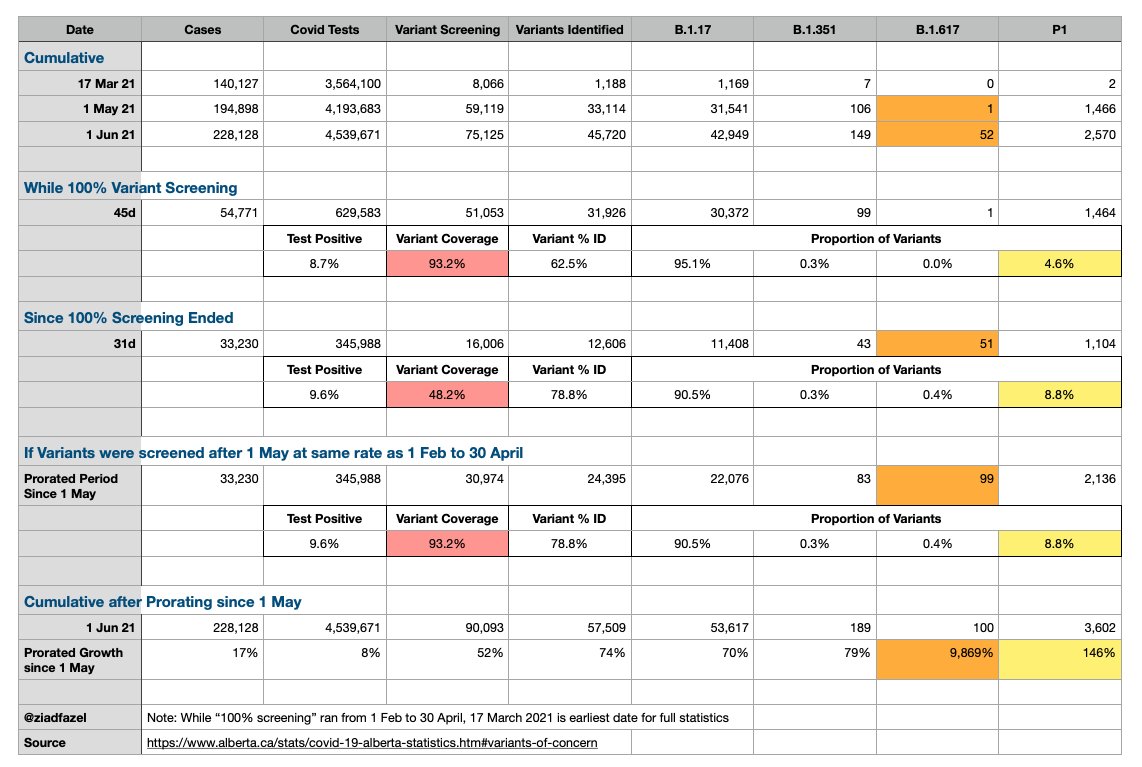
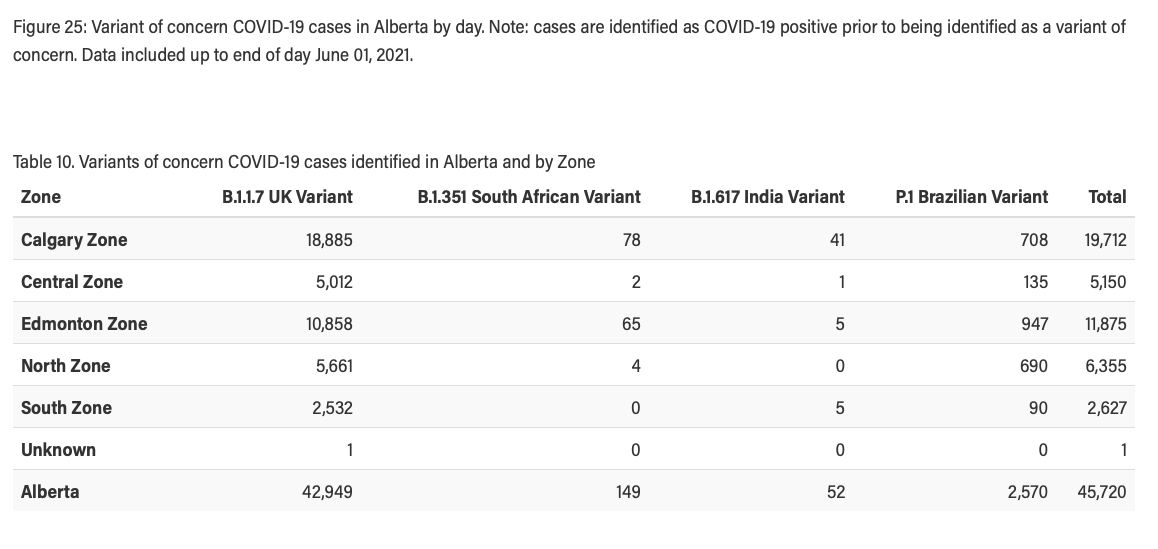
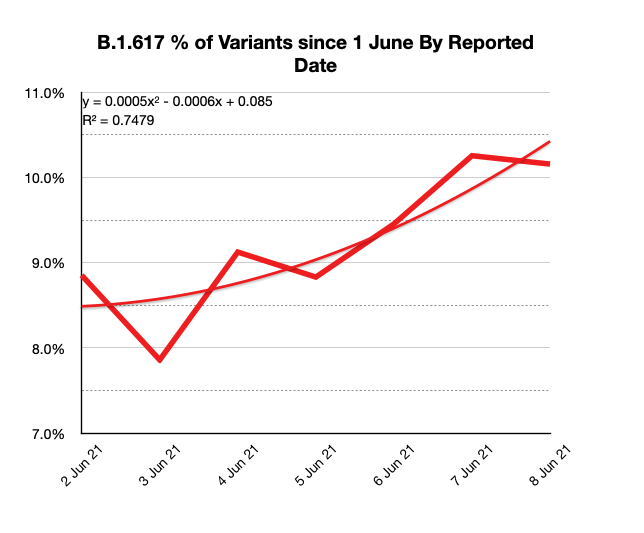
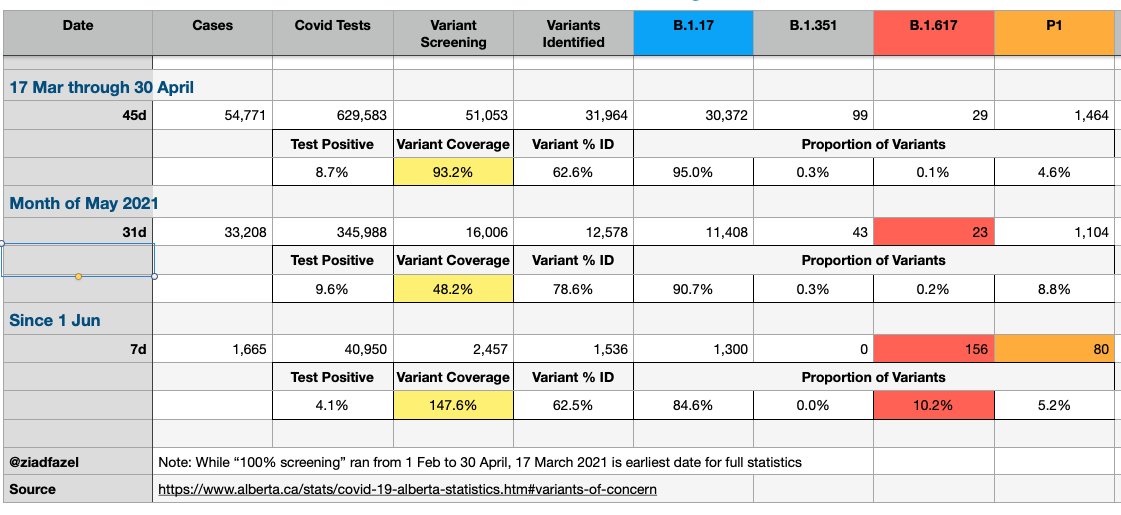
With my spreadsheet, I use Reported Date. So I get around 9.2%, not 5%.
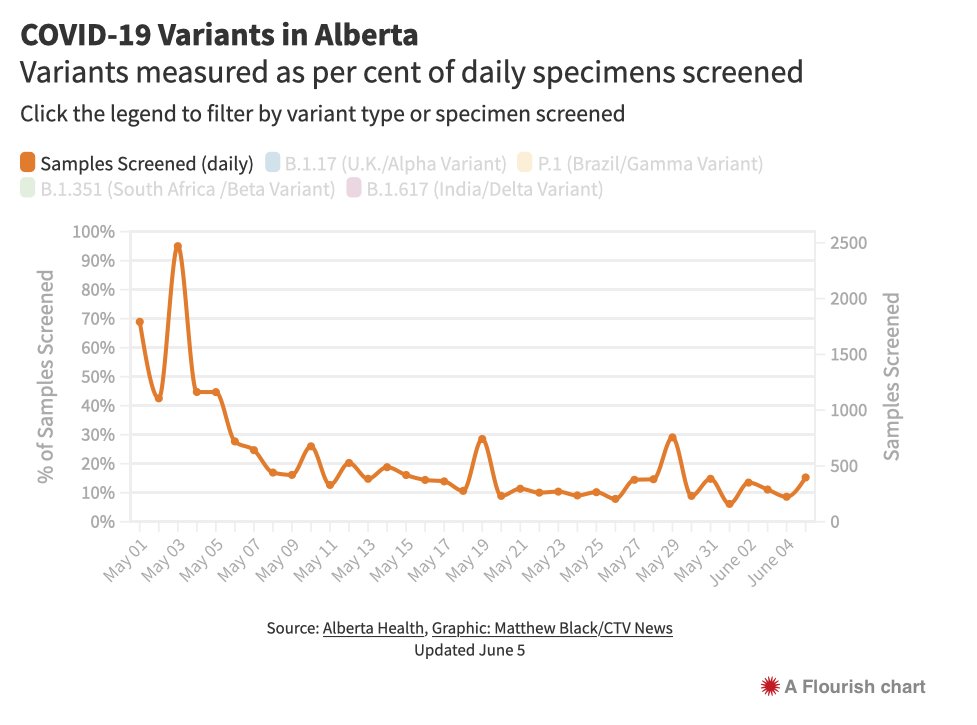
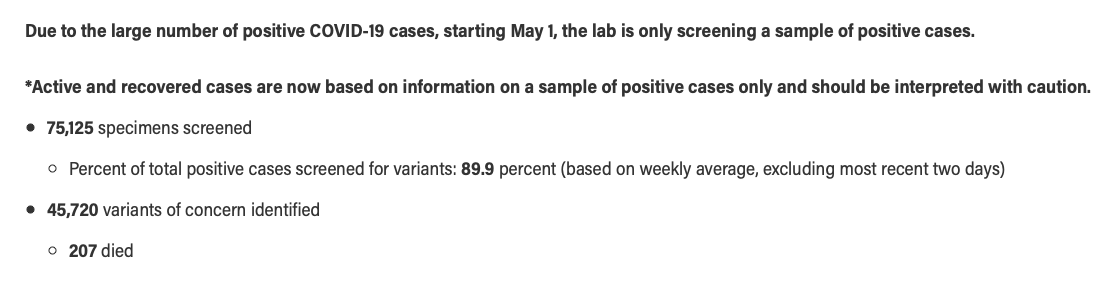
But there shouldn't be that much difference from the Retrospective Testing in June. Only ~800 more cases from before June have been screened so far, and in May ~17K were not screened.
But there shouldn't be that much difference from the Retrospective Testing in June. Only ~800 more cases from before June have been screened so far, and in May ~17K were not screened.
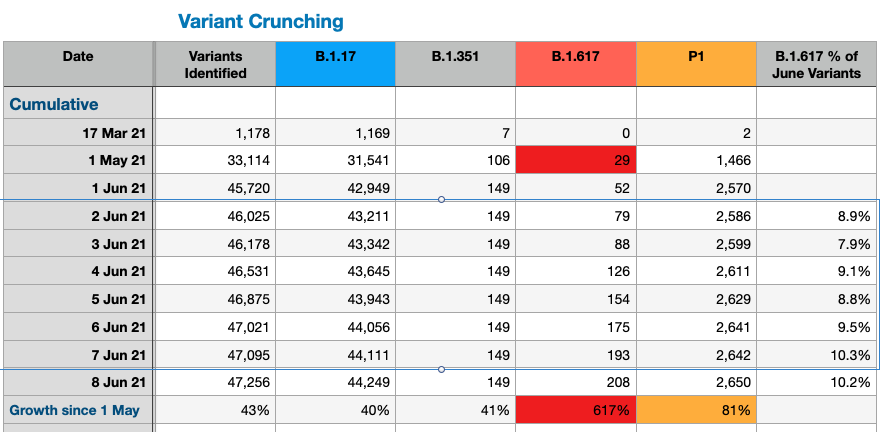
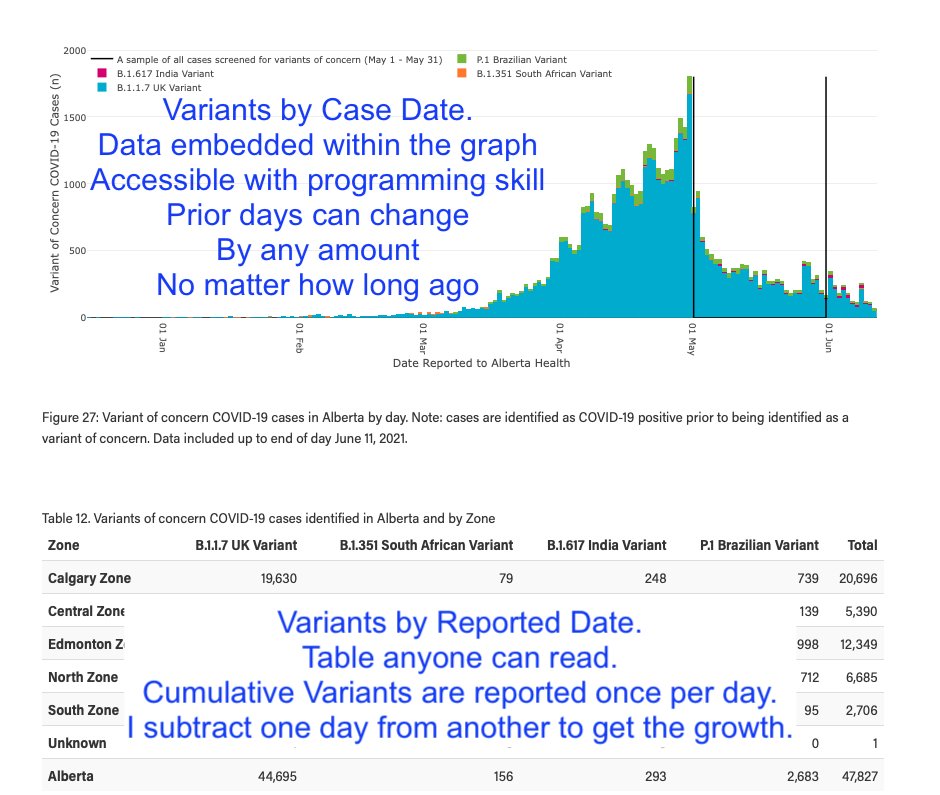
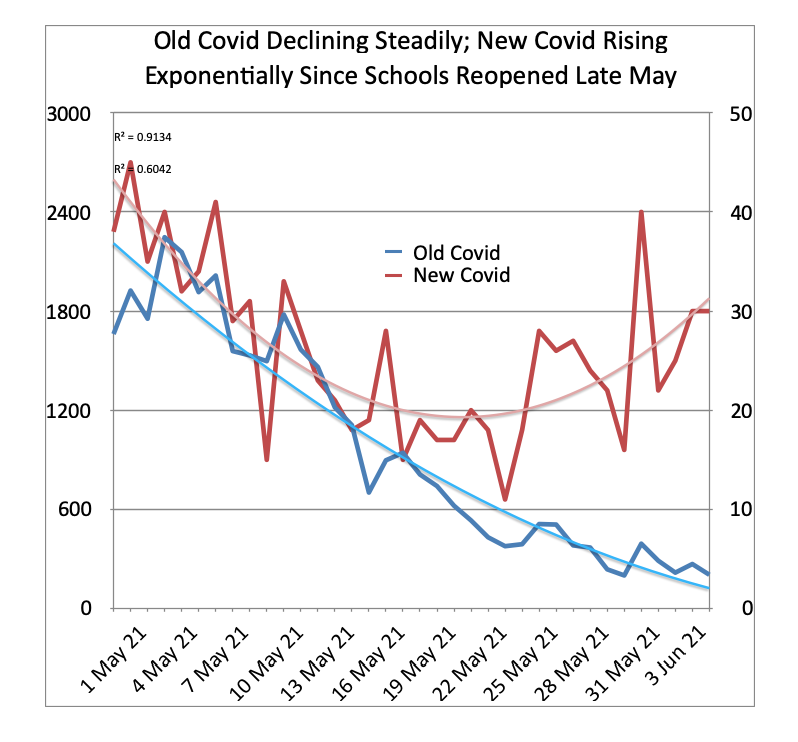
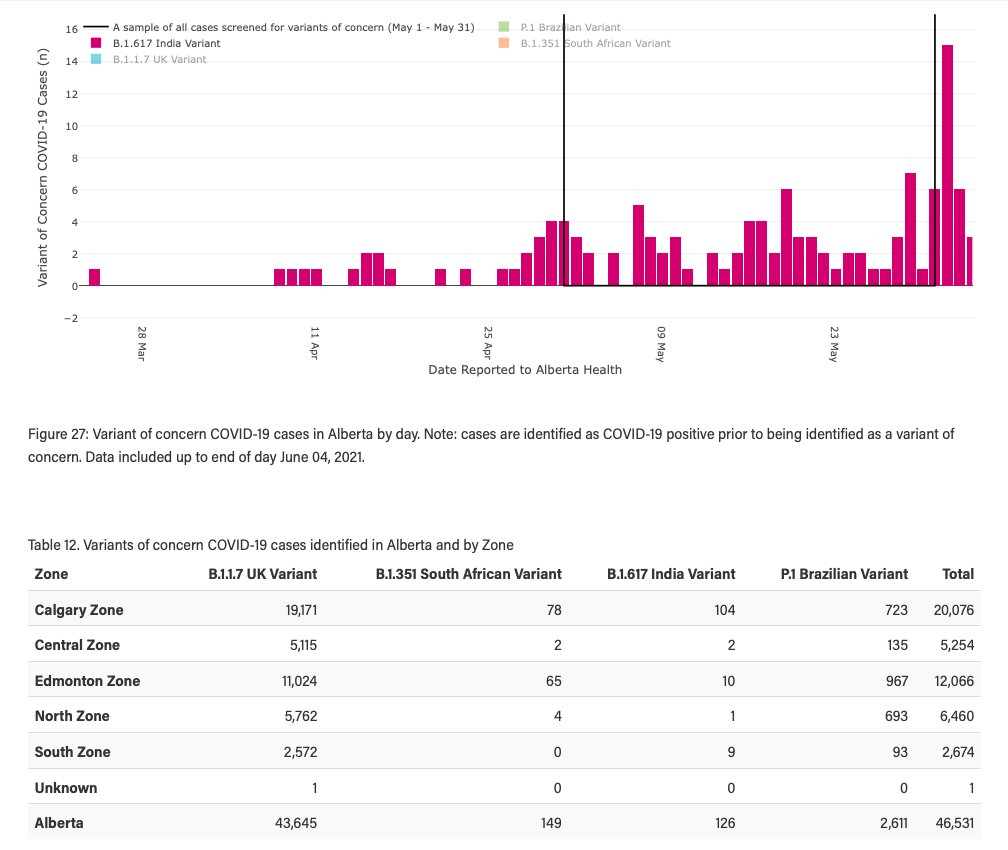
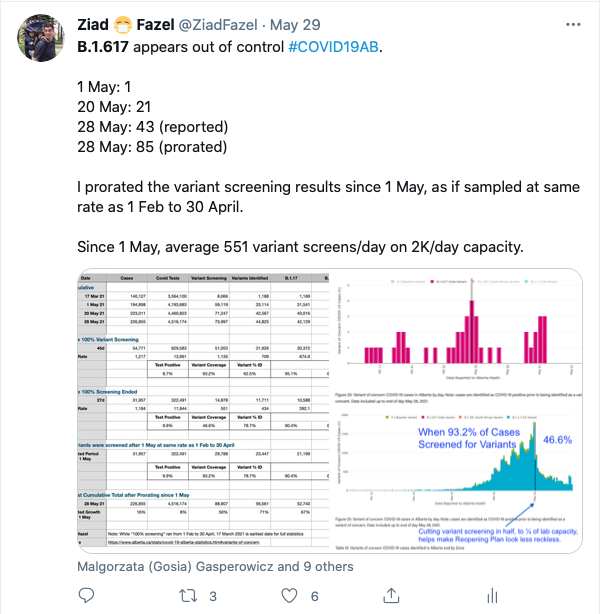
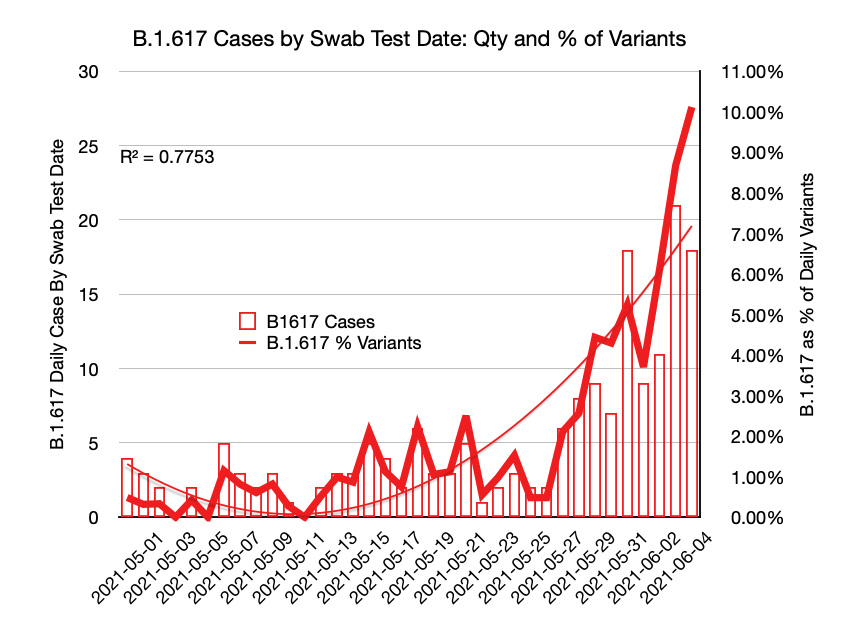
So I got the AB Health stats which identify Variants by Swab Test Date.
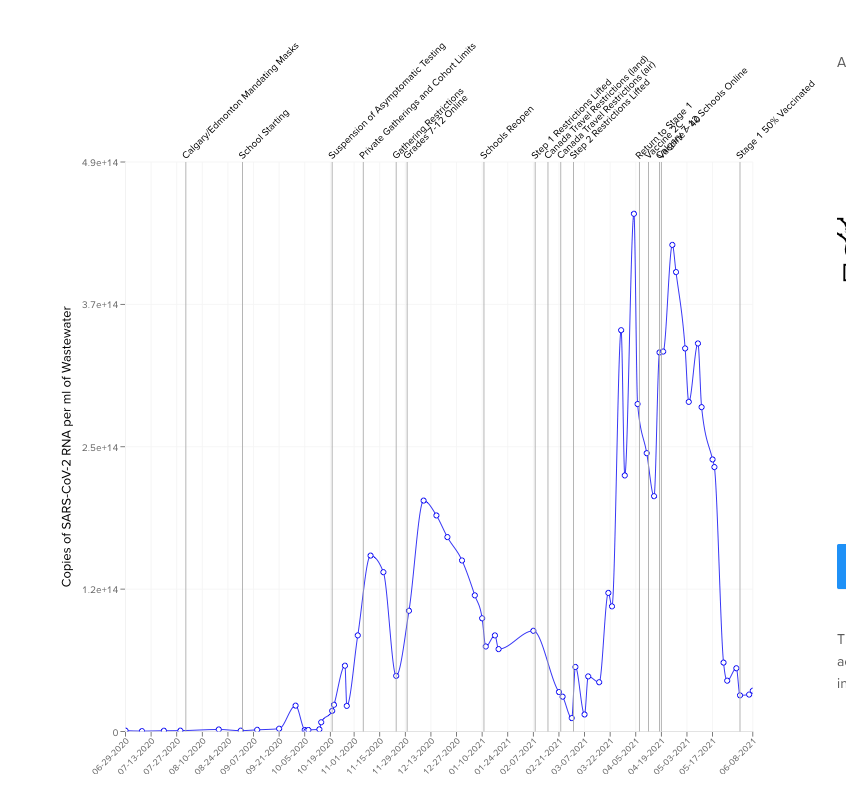
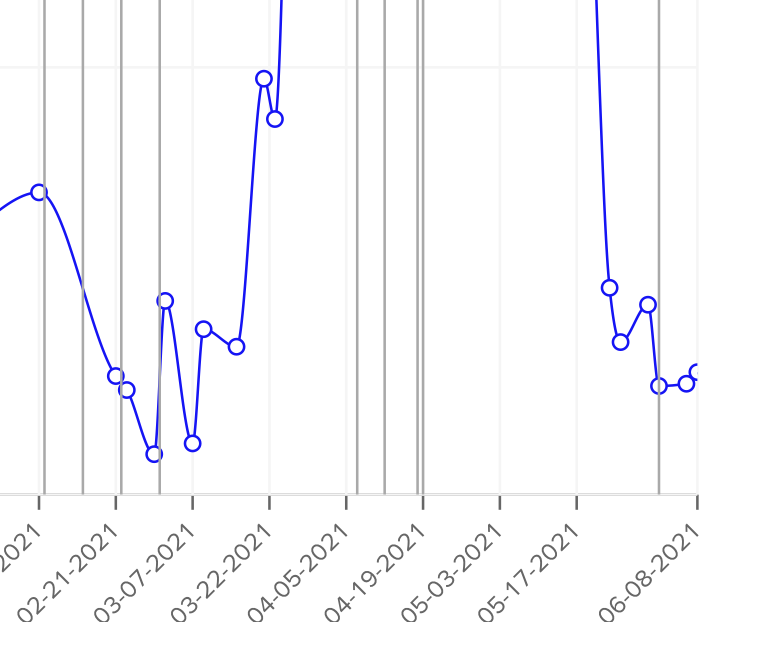
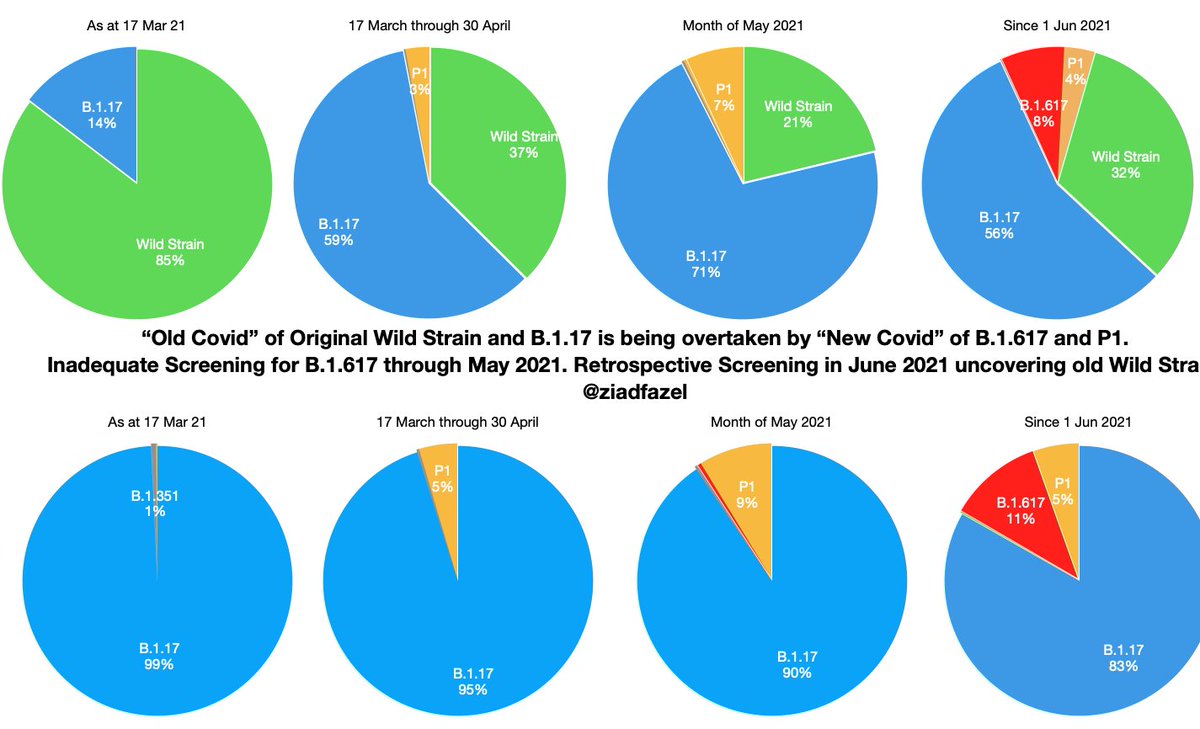
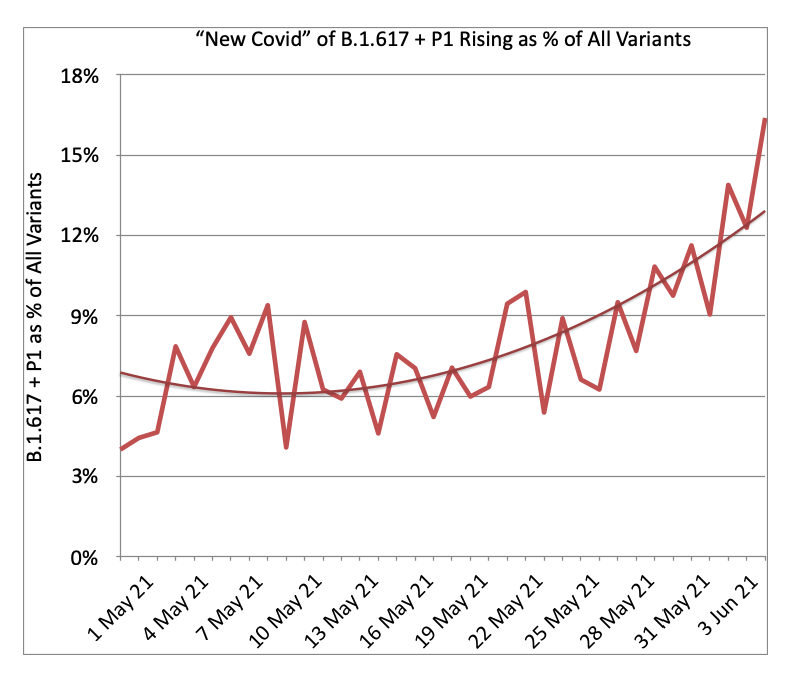
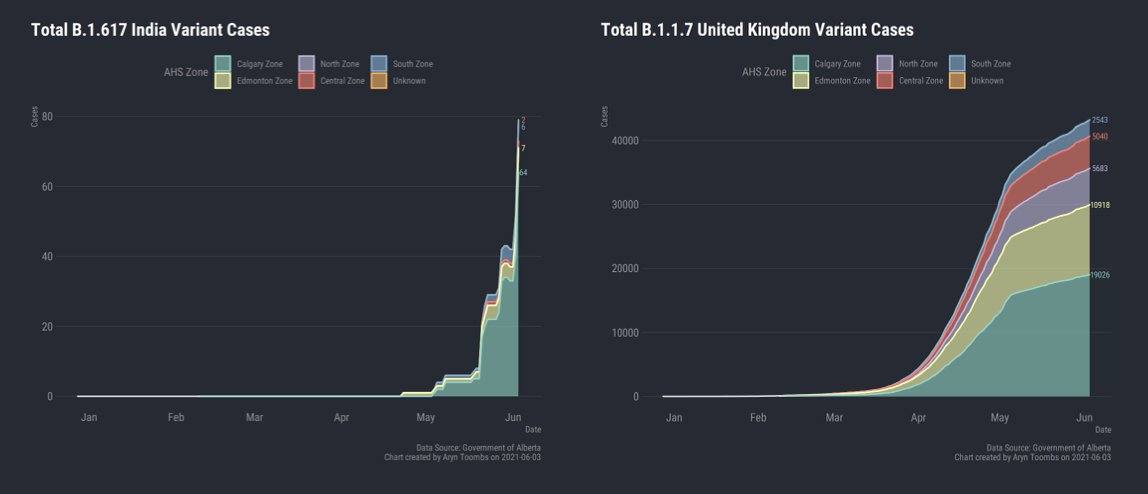
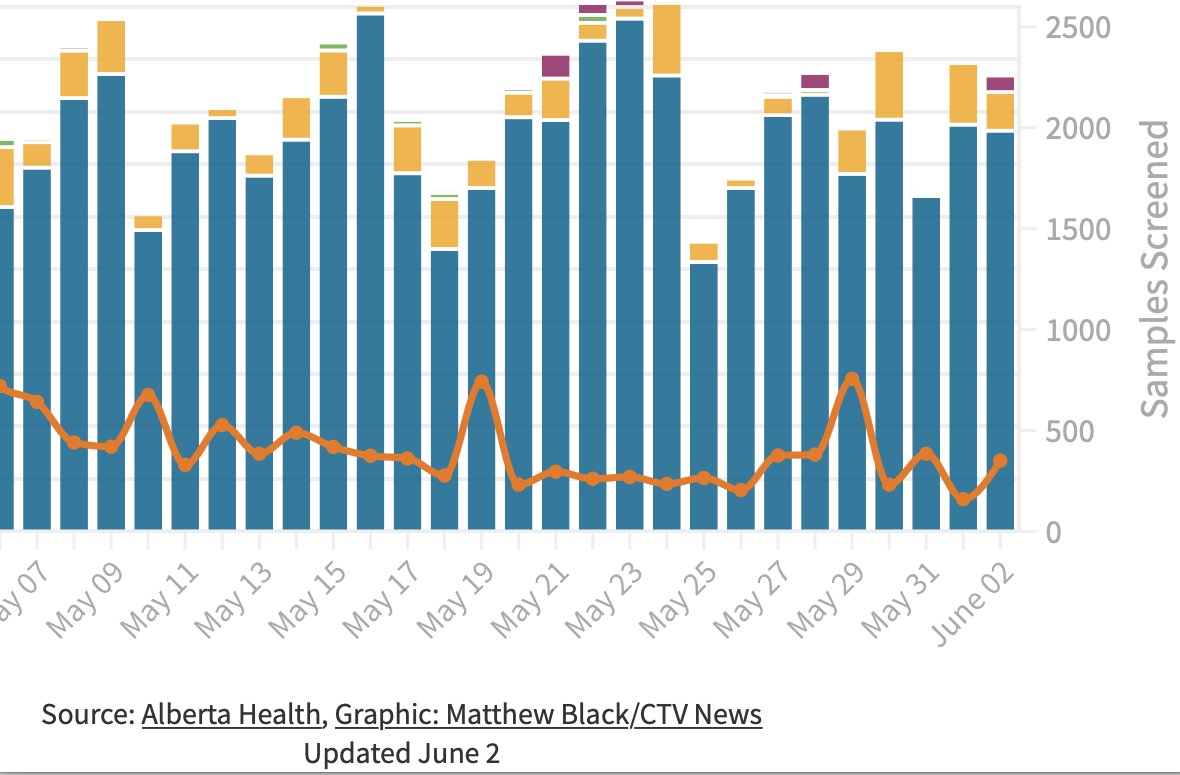
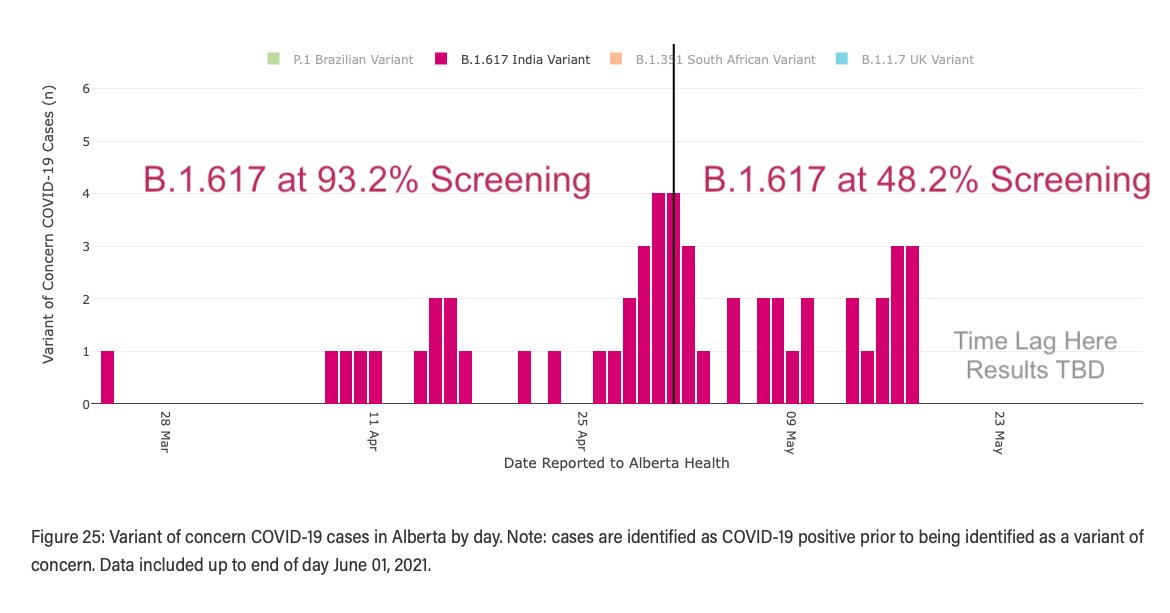
From 1 May to 5 June*, exponential growth of B.1.617. Misleading of CMOH to "put our numbers in context" as only ~5% in last week, when this⤵️ is the 💥growth.
* Most recent days omitted as data incomplete.
From 1 May to 5 June*, exponential growth of B.1.617. Misleading of CMOH to "put our numbers in context" as only ~5% in last week, when this⤵️ is the 💥growth.
* Most recent days omitted as data incomplete.
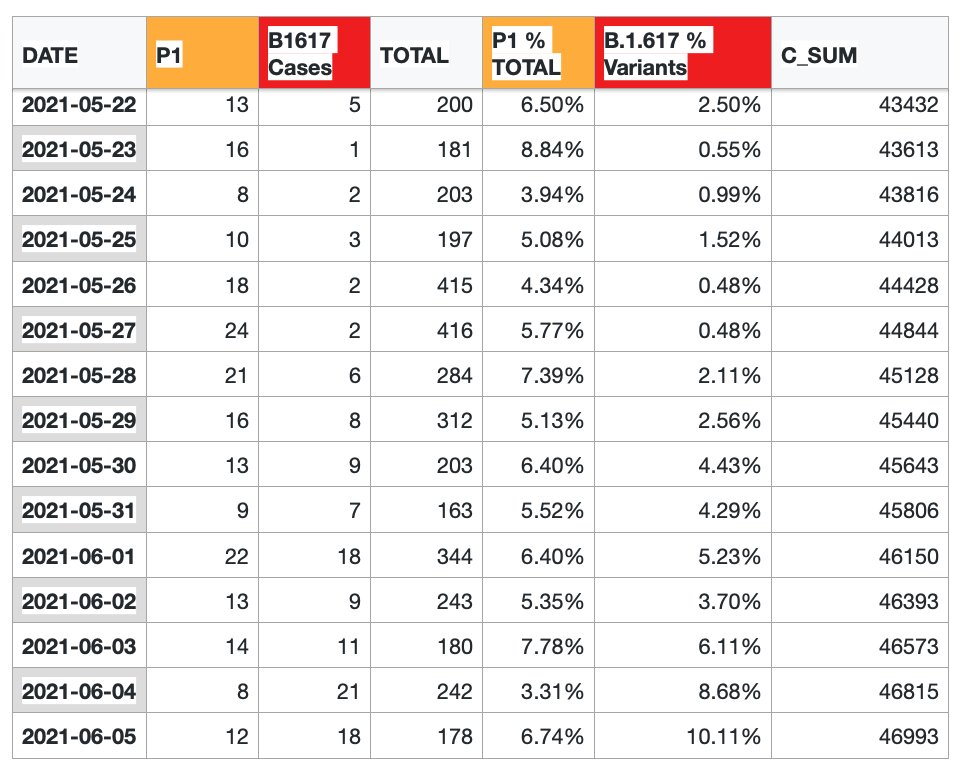

My thanks to @ArynToombs for pulling a CSV from the AB Health JSON, so I could get the variant results by swab test date.
I don't understand more than what I said above, so have a look at his work
aryntoombs.github.io
I don't understand more than what I said above, so have a look at his work
aryntoombs.github.io
• • •
Missing some Tweet in this thread? You can try to
force a refresh