Here is my 69-tweet 2021 Q2 Tesla forecast thread.
🤓 $TSLA
This tweet is a summary
The next 16 tweets are some pretty charts
The 3 tweets that follow are summary tables
The last 49 tweets in the thread are my detailed forecast that builds up to these totals
/1
🤓 $TSLA
This tweet is a summary
The next 16 tweets are some pretty charts
The 3 tweets that follow are summary tables
The last 49 tweets in the thread are my detailed forecast that builds up to these totals
/1

Here's what Tesla's total revenue looks like by year and quarter. These are *actuals*, not my forecast.
It's hard to believe people are still selling this company short and saying "the growth story is over".
I am projecting this kind of revenue growth to continue.
/2
It's hard to believe people are still selling this company short and saying "the growth story is over".
I am projecting this kind of revenue growth to continue.
/2

Here's a S3XY chart that shows total global vehicle deliveries by model and quarter.
I am projecting 218K deliveries in Q2 and 917K for the full year 2021.
/3
I am projecting 218K deliveries in Q2 and 917K for the full year 2021.
/3

Here's a chart showing global deliveries of Tesla's 2 top-selling vehicles (2 of the Top 3 selling premium vehicles in the U.S.).
I'm not forecasting much Model 3 sales growth compared to Model Y-- which should grow significantly this year with the ramp in China.
/4
I'm not forecasting much Model 3 sales growth compared to Model Y-- which should grow significantly this year with the ramp in China.
/4

Here's a chart showing the quarterly trend over time in Production vs. Deliveries, including my forecast through 2023:
/5
/5

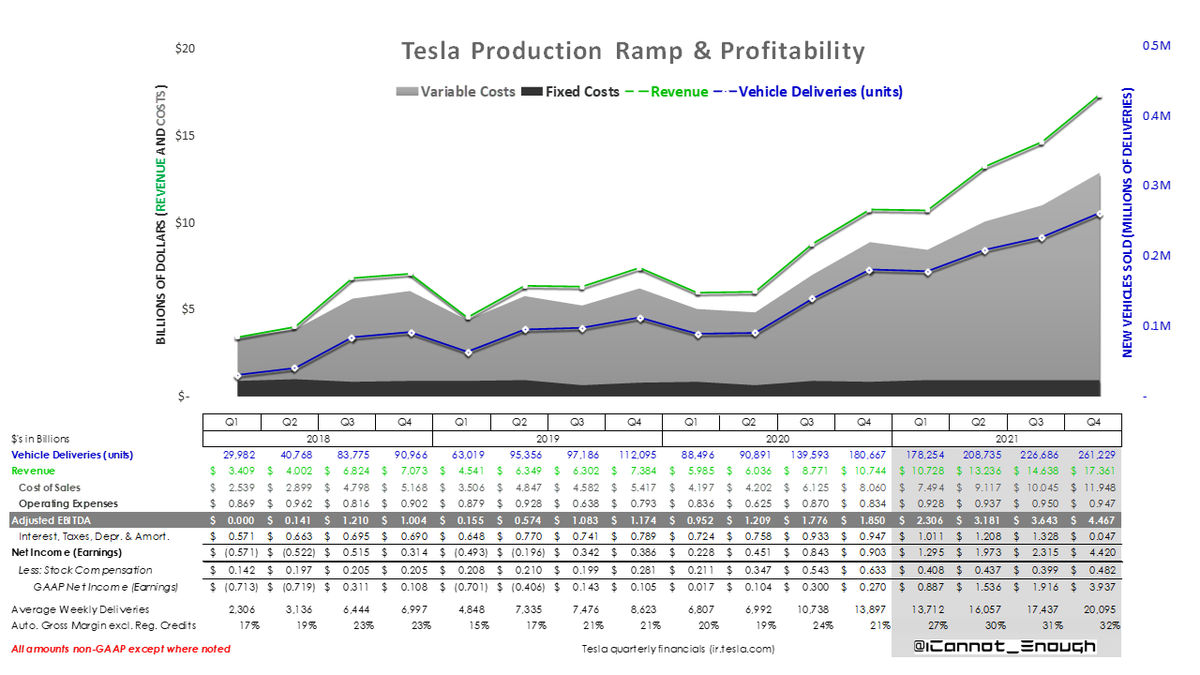
Quarterly Adjusted EBITDA is the profitability metric that determines milestone achievement in Elon's compensation plan.
I expect all future quarters will exceed the quarterly record high of $1.85B set in Q4 2020.
/6
I expect all future quarters will exceed the quarterly record high of $1.85B set in Q4 2020.
/6

Here's a few charts all the Tesla haters hate.
The next time one of them tells you Tesla isn't profitable, show them these. 😂🤣
/7
The next time one of them tells you Tesla isn't profitable, show them these. 😂🤣
/7

Here's my homage to a chart @TESLAcharts tweeted after Q2 2020 (when revenue was pretty flat) and mysteriously failed to update after the Q3 and Q4 results came out. 😂🤣
I keep it updated for him 😜
(gray bars are actuals, red bars are my forecast).
/8
I keep it updated for him 😜
(gray bars are actuals, red bars are my forecast).
/8

"But what about regulatory credits?"
The Tesla haters have claimed for years that Tesla is only profitable due to "one-time" regulatory credit sales that are "going away".
They just kept not going away, though. 😂🤣
(gray bars are actuals, red bars are my forecast)
/9
The Tesla haters have claimed for years that Tesla is only profitable due to "one-time" regulatory credit sales that are "going away".
They just kept not going away, though. 😂🤣
(gray bars are actuals, red bars are my forecast)
/9

Here's a chart of stock-based compensation expense per the 2018 CEO Performance Award.
This is a non-cash expense excluded from Adjusted EBITDA and Non-GAAP Earnings.
It will not exceed $2.283B ($1.6B of which has already hit) over the plan's 10-year life.
/10
This is a non-cash expense excluded from Adjusted EBITDA and Non-GAAP Earnings.
It will not exceed $2.283B ($1.6B of which has already hit) over the plan's 10-year life.
/10

Here's a chart showing where the average dollar of Tesla revenue comes from, over time, using a 12-month trailing average to smooth out seasonality:
/11
/11

Similarly, this chart shows how Tesla spends each dollar of revenue, on average.
📉 When Tesla spent *more than* the total revenue, there was a Non-GAAP *loss*.
📈 When Tesla spent *less than* the total revenue, there were Non-GAAP *profits*.
/12
📉 When Tesla spent *more than* the total revenue, there was a Non-GAAP *loss*.
📈 When Tesla spent *less than* the total revenue, there were Non-GAAP *profits*.
/12

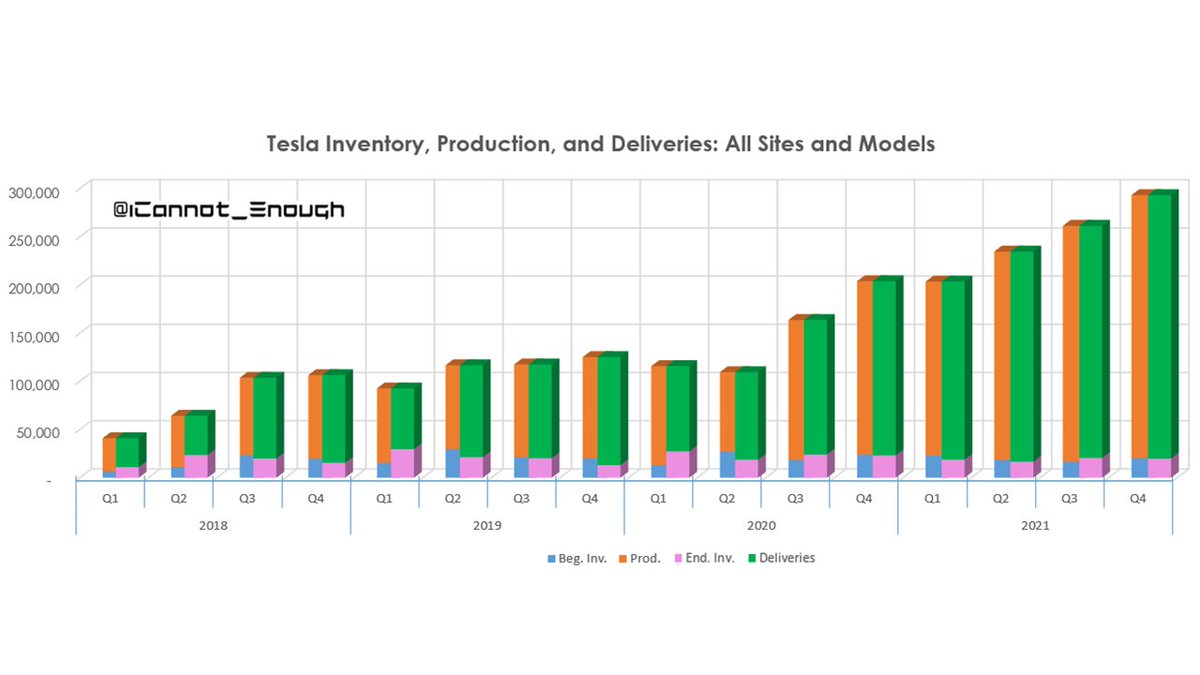
Here's a quarterly chart showing the relationship amongst:
Beginning Finished Goods Inventory
Production
Deliveries, and
Ending Finished Goods Inventory
/13
Beginning Finished Goods Inventory
Production
Deliveries, and
Ending Finished Goods Inventory
/13
Here's a stacked area chart showing quarterly deliveries by site and model.
2021 is really just a warmup for the growth we're likely to see in 2022 and 2023, with Giga Berlin and Giga Texas ramping up production and several new models launching (see legend for hints).
/14
2021 is really just a warmup for the growth we're likely to see in 2022 and 2023, with Giga Berlin and Giga Texas ramping up production and several new models launching (see legend for hints).
/14

The next 3 charts show premium vehicle sales by brand in the U.S. market in 2017-2020.
It's pretty remarkable how Tesla has already risen to 4th place (trailing only Mercedes-Benz, BMW, & Lexus) whilst *only offering 4 models*.
/15
It's pretty remarkable how Tesla has already risen to 4th place (trailing only Mercedes-Benz, BMW, & Lexus) whilst *only offering 4 models*.
/15

This is a treemap chart showing sales by brand and model.
In 2020, Tesla's Model 3 & Model Y were 2 of the Top 3 selling premium vehicles in the U.S.
Click the tabs to change years in the live version of this chart, courtesy: @f_l_o_u_r_i_s_h
public.flourish.studio/visualisation/…
/16
In 2020, Tesla's Model 3 & Model Y were 2 of the Top 3 selling premium vehicles in the U.S.
Click the tabs to change years in the live version of this chart, courtesy: @f_l_o_u_r_i_s_h
public.flourish.studio/visualisation/…
/16

This is a different visualization of the same U.S. premium vehicle sales data as the previous two charts, making it easier to compare magnitude of sales of each brand and model (2020 sales data shown).
/17
/17

The rest of this thread will be tables of numbers from my forecast model, rather than charts.
The first 3 are from my forecast summary tab (forecast in gray) vs. historicals.
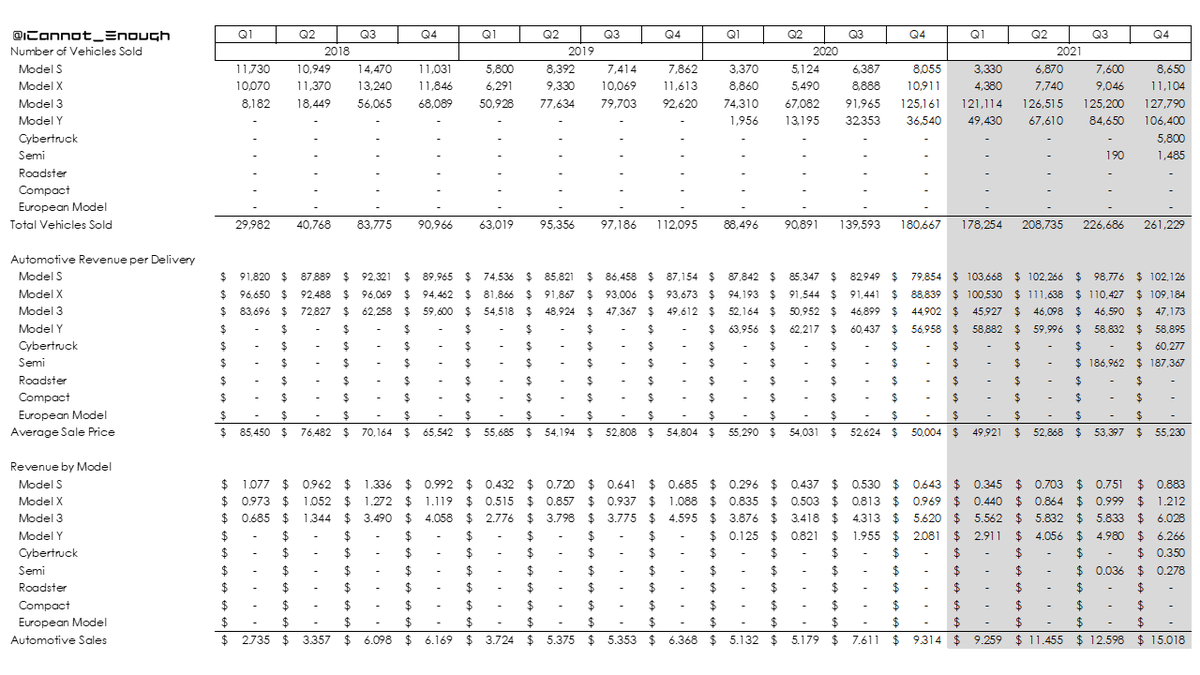
This table shows global unit sales, revenue per delivery, and revenue dollars by model and quarter.
/18
The first 3 are from my forecast summary tab (forecast in gray) vs. historicals.
This table shows global unit sales, revenue per delivery, and revenue dollars by model and quarter.
/18

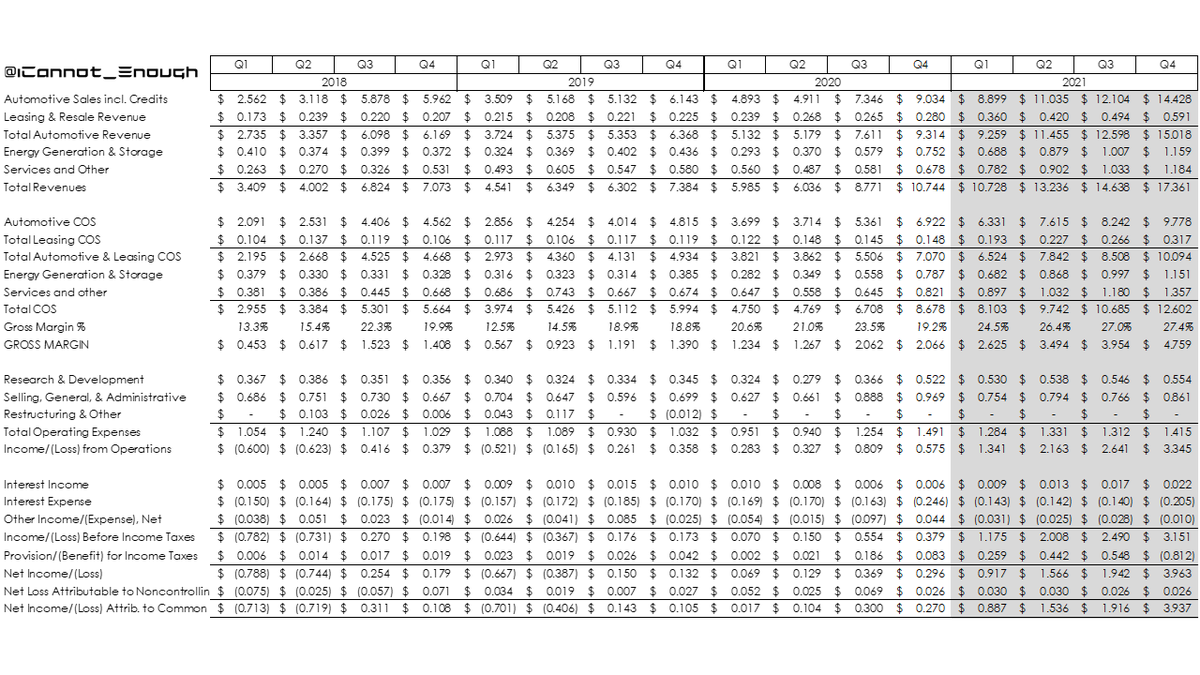
My whole detailed forecast is ultimately designed to help me forecast this one page:
the Income Statement.
I'm forecasting a ($1.6B) deferred tax favorability in Q4 from rollover of prior years' losses applied against this year's profits (but who knows when it will hit??).
/19
the Income Statement.
I'm forecasting a ($1.6B) deferred tax favorability in Q4 from rollover of prior years' losses applied against this year's profits (but who knows when it will hit??).
/19

These tables show:
share count
EPS (mind the GAAP 😜)
Cost of Sales % detail by division, and
Deliveries by site, model, and quarter
See the first tweet of this thread for my Non-GAAP EPS (diluted) forecast of $1.58 in Q2.
/20
share count
EPS (mind the GAAP 😜)
Cost of Sales % detail by division, and
Deliveries by site, model, and quarter
See the first tweet of this thread for my Non-GAAP EPS (diluted) forecast of $1.58 in Q2.
/20

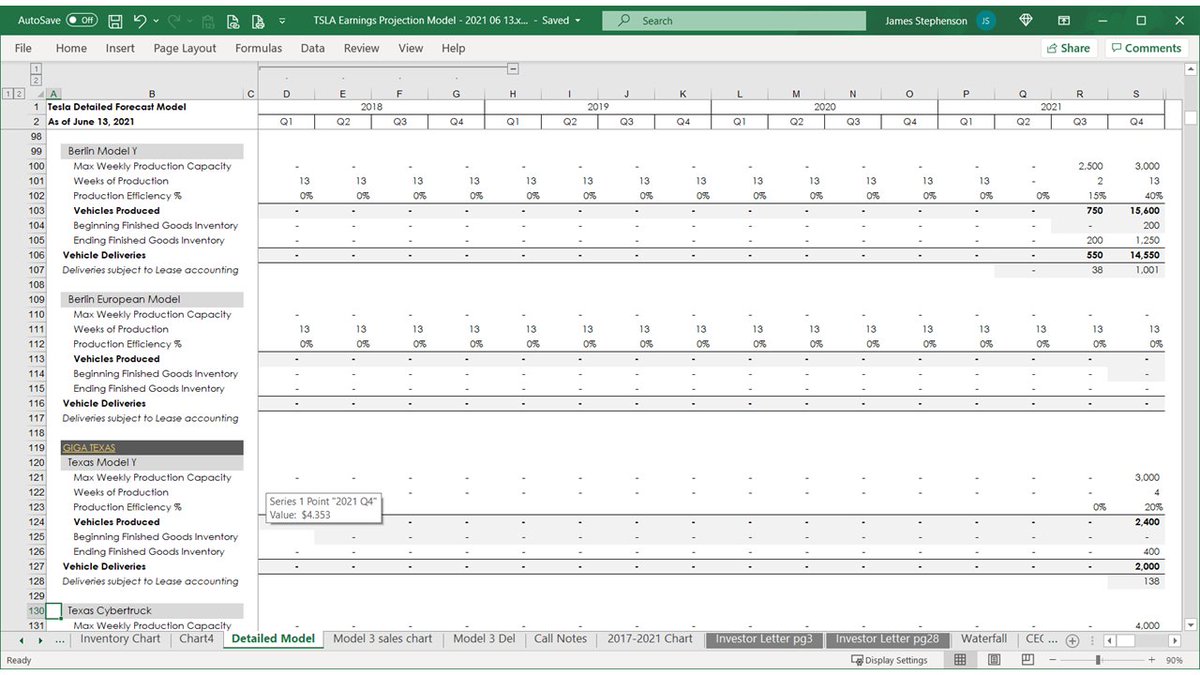
The rest of the thread shows the detailed forecast model that builds up from assumptions to everything you've seen previously in the thread.
I only tweet this detail out once per quarter, in case people find it helpful.
The first section forecasts Production & Deliveries:
/21
I only tweet this detail out once per quarter, in case people find it helpful.
The first section forecasts Production & Deliveries:
/21

I believe in doing a very granular forecast so that it forces me to rethink assumptions for every model at every site, every quarter.
It is certainly possible to do a high-level forecast by just eyeballing previous quarterly totals, but I prefer not to do it that way.
/22
It is certainly possible to do a high-level forecast by just eyeballing previous quarterly totals, but I prefer not to do it that way.
/22

/23

/24
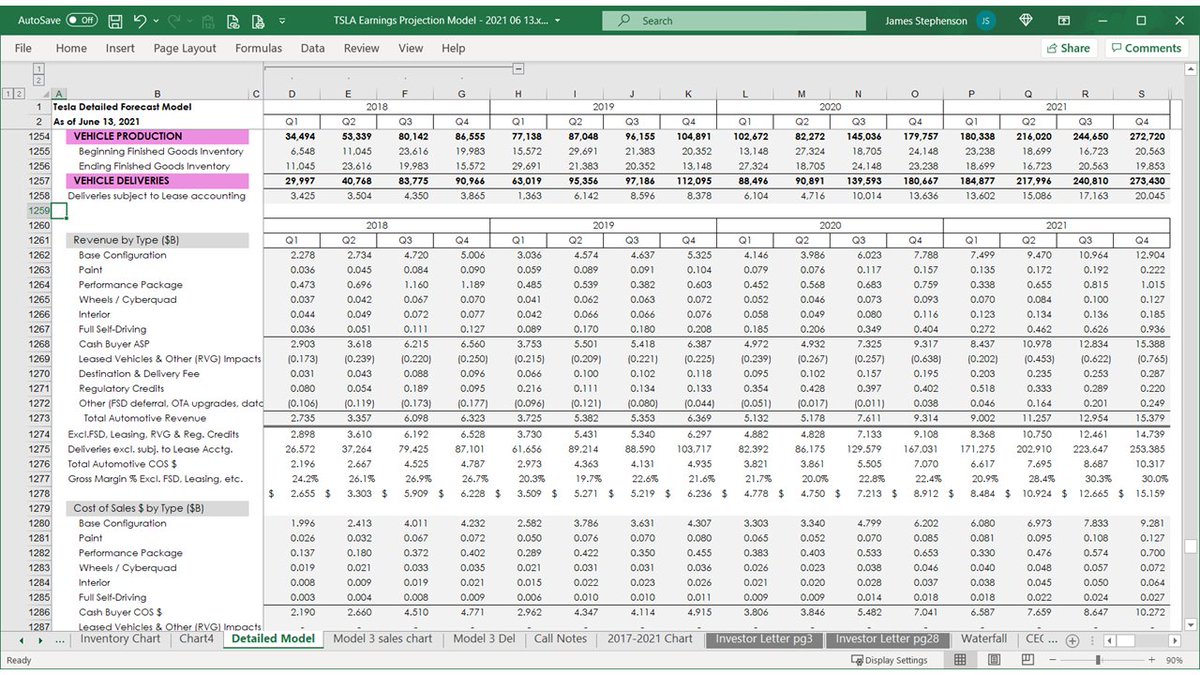
Here's where I total up the production, deliveries (to cash buyers vs. subject to lease accounting), beginning and ending inventory levels, and calculate days of sales in ending inventory.
/25
/25

Here are the subtotals by site.
/26
/26

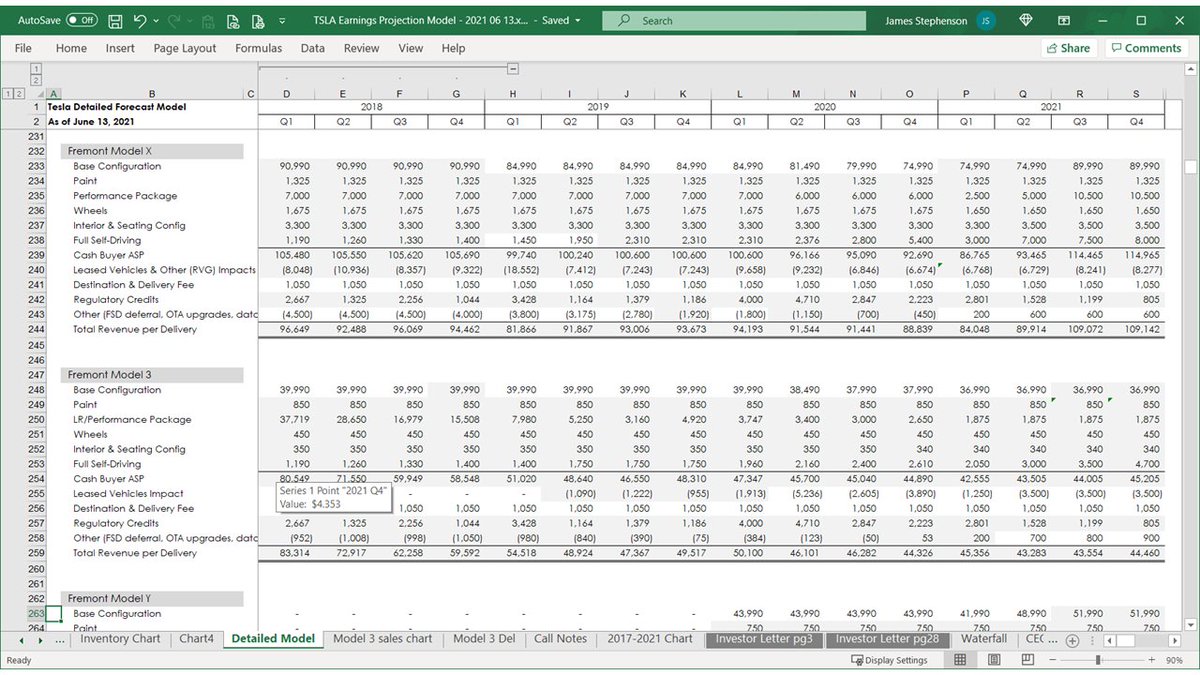
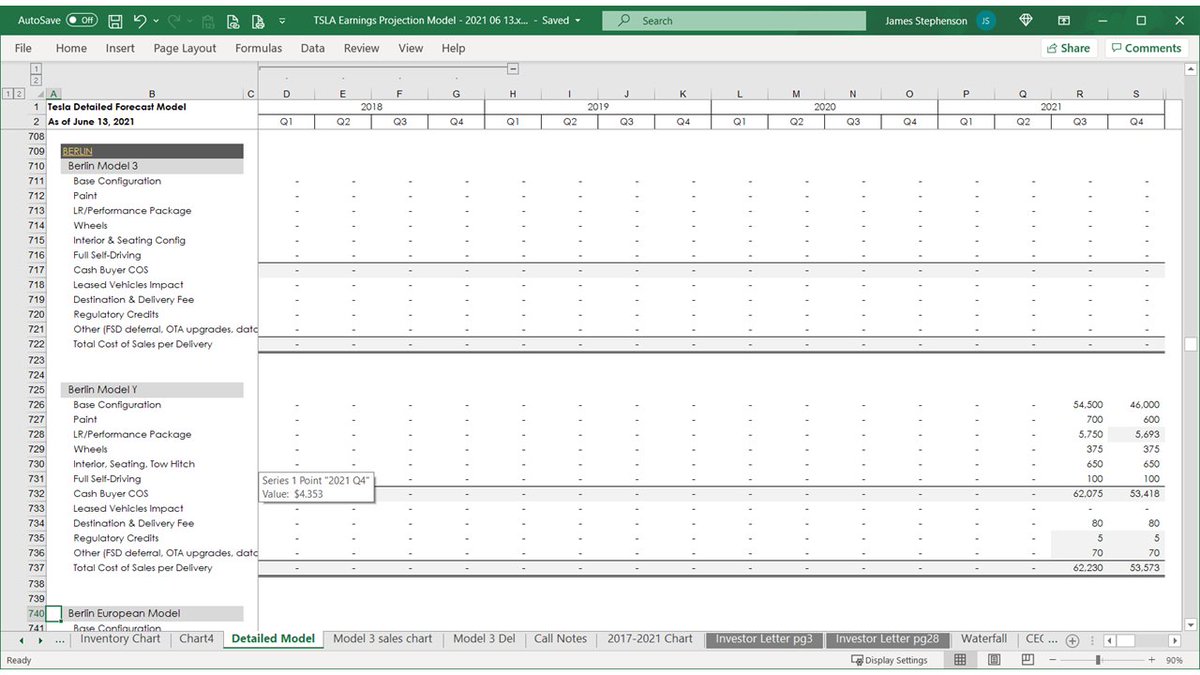
The second section is the buildup of Auotomotive Revenue by model, by site, by quarter, from base price to average revenue per vehicle by making assumptions about option take rates, pricing, FSD, Leasing, etc.
/27
/27

/28
/29

/30

/31

/32

/33

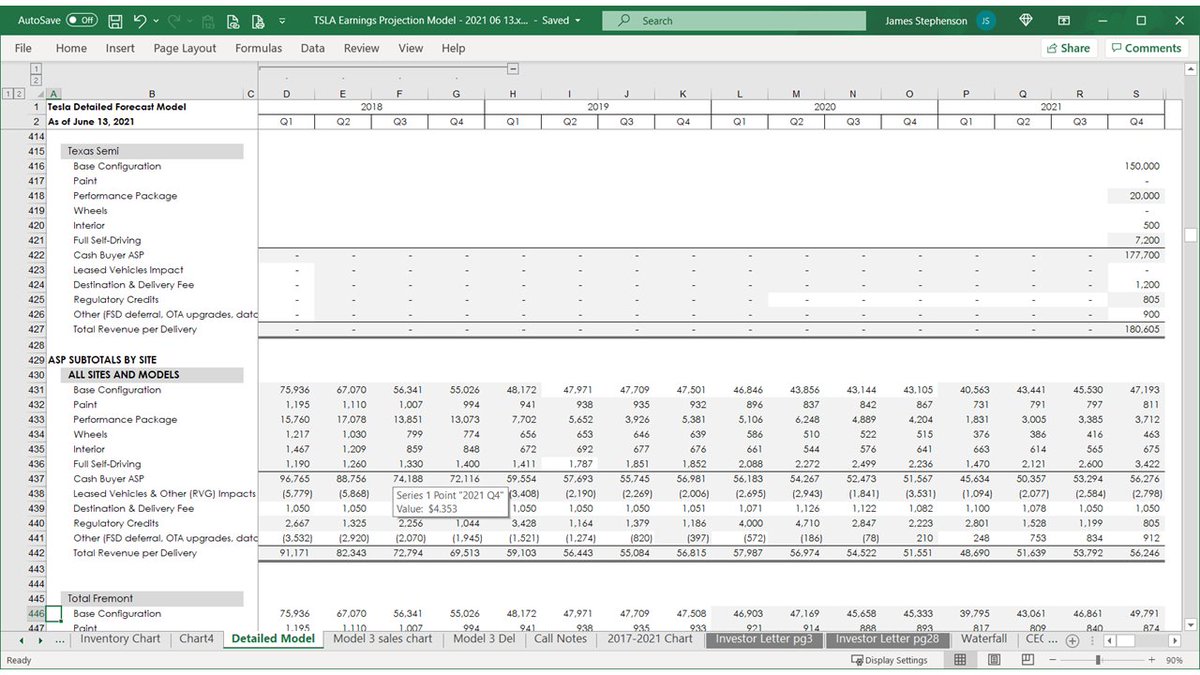
Here are the ASP subtotals by site:
/34
/34
Tweet 35! You're halfway to the end of the thread!
😂🤣
I guarantee it took you less time to read than it took me to make.
/35
😂🤣
I guarantee it took you less time to read than it took me to make.
/35

/36

These are the global total ASPs for all models, for cash buyers vs. deliveries subject to lease accounting and the combined total at the bottom.
/37
/37

Here's my Tesla Energy revenue forecast section by production vs. storage with metrics and forecast by product.
/38
/38

The end of the revenue section begins the Automotive Cost of Sales section, with detail in the same level of detail as the revenue section.
/39
/39

/40

/41

/42

/43
/44

/45

Here are the total global Automotive Cost of Sales dollars by model:
/46
/46

Here's the cost forecast for Tesla Energy and Services & Other and the beginning of the COS % section of my detailed forecast models.
The percentages are all just the detailed average costs in the third section divided by the detailed revenue averages in the second section:
/47
The percentages are all just the detailed average costs in the third section divided by the detailed revenue averages in the second section:
/47

/48

/49

/50

/51

/52

/53

Here are the total Cost of Sales %'s by model:
/54
/54

Here's a better look at the total Automotive COS %'s:
/55
/55
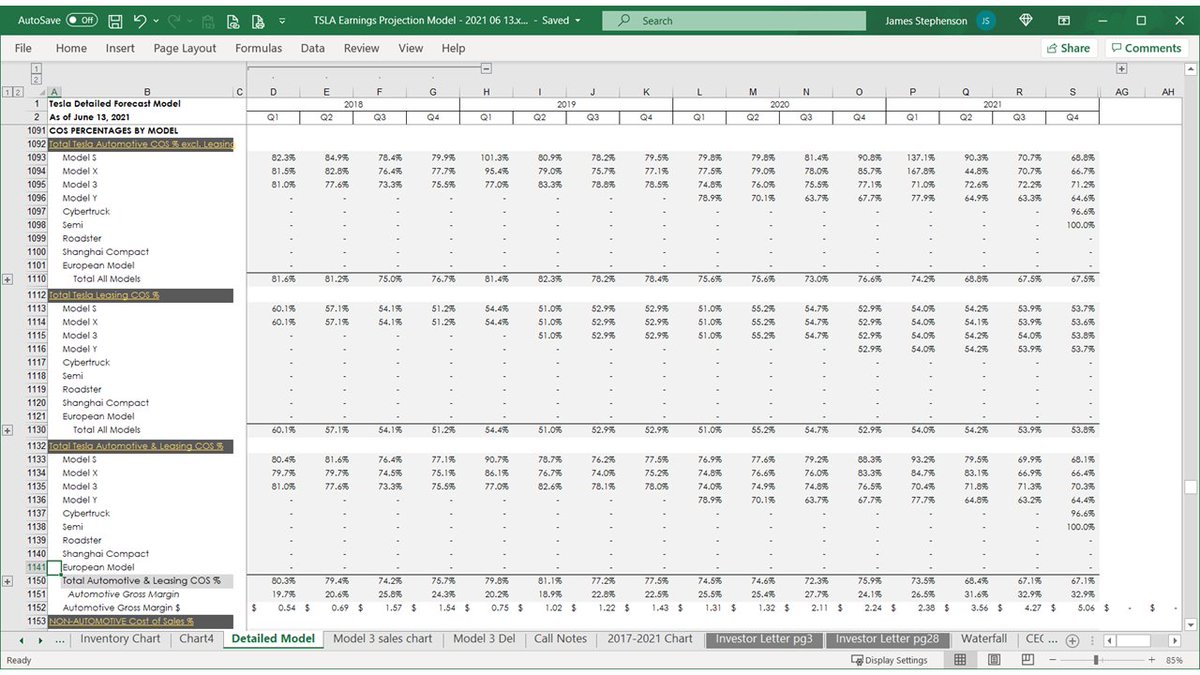
Here are the COS %'s for Tesla Energy and Services & Other, which ends the detailed forecast section and starts the Income Statement summary section.
Everything above was needed to forecast the dollars shown on rows 1,167 through 1,179:
/56
Everything above was needed to forecast the dollars shown on rows 1,167 through 1,179:
/56

This Income Statement is in the same format Tesla reports it, so the bottom line profit number shown here is Non-GAAP earnings.
/57
/57

This section includes:
GAAP to Non-GAAP Net Income reconciliation
Share count
Share price
Market cap
Earnings per share metrics
2018 CEO Performance Award milestone metrics
... and other items of interest.
/58
GAAP to Non-GAAP Net Income reconciliation
Share count
Share price
Market cap
Earnings per share metrics
2018 CEO Performance Award milestone metrics
... and other items of interest.
/58

This section includes additional detail on stock compensation vs. all other SG&A expense and a reconciliation of Non-GAAP Net Income to Adjusted EBITDA.
/59
/59

This section shows my total revenue and cost forecasts by option type:
/60
/60
Here's what I'm forecasting for COS %'s by option type, along with total automotive revenue and cost of sales per delivery, revenue per fully-diluted share, and the start of the next section...
/61
/61

... which shows deliveries by site by model, then just by model (irrespective of site).
/62
/62

This page shows:
Total Automotive Revenue per delivery
(first by model then by option type)
A row combining 2 types of FSD revenue:
declared upon delivery
FSD revenue deferred because FSD isn't feature-complete yet
TTM deliveries, revenue, and Adj. EBITDA
/63
Total Automotive Revenue per delivery
(first by model then by option type)
A row combining 2 types of FSD revenue:
declared upon delivery
FSD revenue deferred because FSD isn't feature-complete yet
TTM deliveries, revenue, and Adj. EBITDA
/63

Here are the data tables for tweets 11 & 12 of this thread, calculating "same size statements" of revenue and cost as a % of total revenue.
/64
/64

These are the twelve-trailing month calculations for the tables above, which remove seasonality, making the trends smoother visually.
/65
/65

The last 4 tweets are where I estimate how much stock-based compensation expense Tesla will record related to the 'CEO Bonus' plan.
The bonus plan involves 12 tranches that can be earned by achieving any of 8 revenue milestones or 8 Adjusted EBITDA goals.
/66
The bonus plan involves 12 tranches that can be earned by achieving any of 8 revenue milestones or 8 Adjusted EBITDA goals.
/66

The maximum lifetime expense of the plan was determined at inception (in March 2018) to be $2.283B.
Expense is recorded over time, relative to the portion of the plan expense deemed likely to be earned, proportionate to how much progress has been made toward vesting.
/67
Expense is recorded over time, relative to the portion of the plan expense deemed likely to be earned, proportionate to how much progress has been made toward vesting.
/67

This is a very challenging item to forecast, since so much judgment is involved in determining when a goal is deemed more likely than not to be achieved, which causes significant catch-up expense to be recorded.
/68
/68

The End. Thanks for reading.
🥂🥳🎉
/69
🥂🥳🎉
/69

• • •
Missing some Tweet in this thread? You can try to
force a refresh