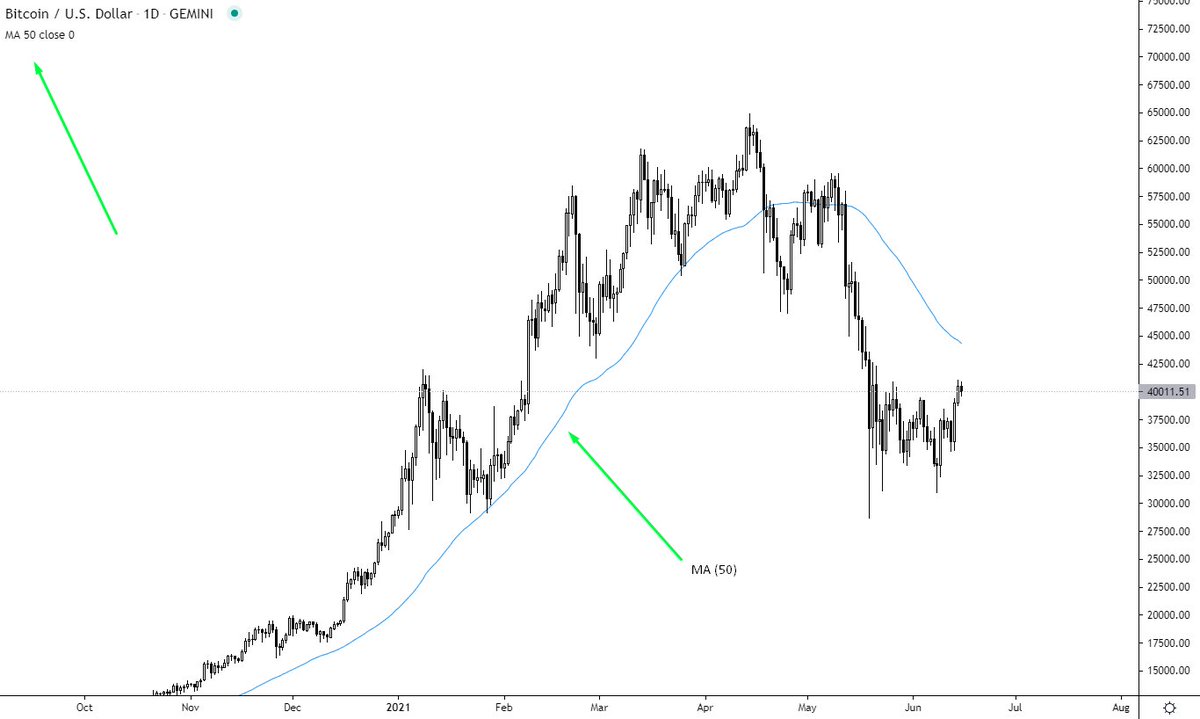
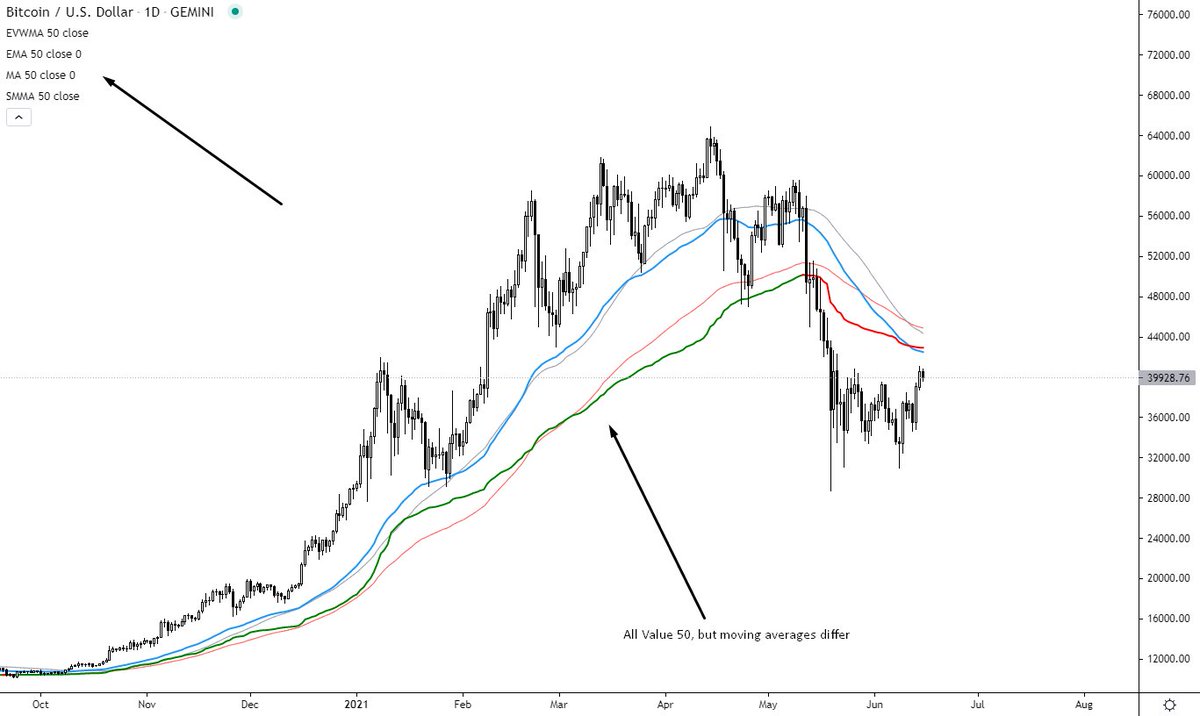
The almighty #deathcross has nicely marked two bottoms for #DXY

If you wanna know more about this lagging indicator follow to the thread below as it is not only the case in #Bitcoin 👇

It doesn't stop there the #deathcross also marked close to the bottom of the 08 financial crisis.
The last Weekly #deathcross to this day has also marked the bottom of the #Apple stock price in 01 followed by a 42000% rally
The last #deathcross of #Apple stock price on the Daily chart is on Dec 18. Marked the bottom followed by a 250% rally.
As you can see #deathcross doesn't hold much importance. There are times when price indeed follows more down and there are times it marks the bottom.

It's all about the context and the price itself and the cross more times than not works in the opposite way from my observation

• • •

Missing some Tweet in this thread? You can try to force a refresh
 

Keep Current with J A C K I S

J A C K I S Profile picture

Stay in touch and get notified when new unrolls are available from this author!

Read all threads

This Thread may be Removed Anytime!

PDF

Twitter may remove this content at anytime! Save it as PDF for later use!

Try unrolling a thread yourself!

how to unroll video
  1. Follow @ThreadReaderApp to mention us!

  2. From a Twitter thread mention us with a keyword "unroll"
@threadreaderapp unroll

Practice here first or read more on our help page!

More from @jackis_trader

21 Jun
Divergences 📚

A meme or a powerful tool? It depends on how you use it.

▪️ What it is?
▪️ What type of divergences are there?
▪️ Indicator Divergence
▪️ Intermarket Divergence
▪️ The best way to use them?

1/15 Image
▪️ What it is?

Divergence is when the price of an asset is moving in the opposite direction of a technical indicator or is moving contrary to other data

Divergence warns that the current price trend may be weakening & in some cases may lead to the price changing direction

2/15
▪️ What type of divergences are there?

There are two types:
1) Classic
2) Hidden

Classic bullish divergence usually occurs at the end of a bearish trend & vice versa

Hidden bullish divergence usually occurs in a bullish trending environment & vice versa

3/15 Image
Read 15 tweets
19 Jun
Death Cross 📚

The heavily discussed MA 50 vs MA 200 Death Cross and why it is not what they are trying to sell you

▪️ What is it supposed to be?
▪️ Is it really a sell signal?
▪️ What truly happens?
▪️ The takeaways from Death Cross?

THREAD

1/13
▪️ What is it supposed to be?

The death cross is a TA pattern indicating the potential for a major sell-off.

It appears on a chart when a simple short-term 50 moving average crosses below its long-term 200 moving average.

Indicating you should sell your position.

2/13
▪️ Is it really a sell signal?

Well, that's at least what the "puppeteer" want you to believe.

Truth be told moving averages are a powerful tool when used in the right way.

This is not one of those situations and I will show you exactly why.

3/13
Read 14 tweets
17 Jun
Fibonacci Retracement 📚

One of the most effective tools for profitable trading everyone must know.

▪️ What is it?
▪️ Why are they such a powerful tool?
▪️ How to properly use them?
▪️ Hot to define strong trends?
▪️ Advanced techniques?

1/16
▪️ What is it?

Fibonacci retracement levels are horizontal lines that indicate where Support & Resistance are likely to occur

They are based on Fibonacci numbers. Each level is associated with a percentage. The percentage is how much of a prior move the price has retraced

2/16
The most commonly used ratios include 23.6%, 38.2%, 50%, 61.8%, and 78.6%. Although you can modify them and put any number you find the most valuable for you.

In simple words, they are nothing more than a % retracement from two price points.

3/16
Read 16 tweets
15 Jun
Moving Averages 📚

💎SECRET INFO inside

🧠Great for both beginners & advanced traders

▪️ What are they?
▪️ Types of MAs
▪️ Why are they such a powerful tool?
▪️ How to properly use them?
▪️ My best SECRET EMA value?
▪️ Which Timeframe to use?
▪️ Advanced EMA technique?

1/20
▪️ What are they?

Moving average is nothing more than an average price of the last (value) of candles.

If we are gonna use an example of MA(50) it is gonna be the mean price of the last 50 candles

General rule:
Price above = Bullish 🐂
Price below = Bearish 🐻

2/20
▪️ Types of Moving Averages

1) Simple Moving Average - SMA
2) Exponential Moving Average - EMA
3) Smoothed Moving Average - SMMA
4) Volume Weighted Average Price - VWAP

There are a few more but these are the most important in my opinion.

3/20
Read 20 tweets
15 Jun
Finally, here is the new ALPHA THREAD!

1/13
A

2/13
L

3/13
Read 13 tweets
14 Jun
Inside Bar 📚

▪️ What it is?
▪️ Why is it so powerful?
▪️ How to use it?
▪️ Fakeouts?
▪️ Which Timeframe to use?

1/14
▪️ What it is

An Inside Bar is a simple 1 Bar candle that is hidden inside of the previous OHLC candle

There are two types:
▫️ Inside body & outside wicks
▫️ Inside body & inside wicks

If you are not familiar with what OHLC means read here:


2/14
▫️ Inside body & outside wicks

The body of the candle closes inside of the previous body candle but wicks below

- Weaker of the two

3/14
Read 14 tweets

Did Thread Reader help you today?

Support us! We are indie developers!


This site is made by just two indie developers on a laptop doing marketing, support and development! Read more about the story.

Become a Premium Member ($3/month or $30/year) and get exclusive features!

Become Premium

Too expensive? Make a small donation by buying us coffee ($5) or help with server cost ($10)

Donate via Paypal Become our Patreon

Thank you for your support!

Follow Us on Twitter!

:(