Jesse Bloom's preprint has, of course, caused quite a stir. I wanted to try to explain a bit about the "rooting issue" discussed in the manuscript and also provide some hopefully clarifying phylogenetic trees. 1/15
For this post, I've made a @nextstrain "build" targeted at SARS-CoV-2 genomes from Dec 2019 through Jan 2020, totaling 549 viruses. All code is here: github.com/blab/ncov-earl… and should be reproducible using a download of @GISAID data. 2/15
There is genetic diversity within these very early samples with much of it arising from a split in early transmission chains into lineage A and lineage B viruses (lineage B as in B.1.1.7). Lineage A and lineage B viruses are separated by mutations at sites 8782 and 28144. 3/15
There is uncertainty in exactly how to root the phylogeny, ie the virus that represents the common ancestor of all _sampled_ SARS-CoV-2 viruses. It could align with lineage A as shown here (nextstrain.org/groups/blab/nc…). 4/15
Or the root of the tree could align with lineage B as shown here (nextstrain.org/groups/blab/nc…). The root may not correspond exactly to the lineage A / lineage B split, but just examining A vs B will be sufficient for current purposes. 5/15
This rooting issue is really important as we can see that viruses from individuals with Huanan market exposure are predominantly lineage B viruses. If the root is at the base of lineage B, it fits with Huanan market as emergence location (nextstrain.org/groups/blab/nc…). 6/15
However, if the root is in lineage A then it supports (but does not necessitate) Huanan market as a secondary foci rather than the emergence location (nextstrain.org/groups/blab/nc…). 7/15
Although alternatively, one could hypothesize multiple zoonotic events of closely related viruses to explain this pattern as suggested by Bob Garry in this Virological post (virological.org/t/early-appear…), but this is in my eyes less parsimonious than a single spillover event. 8/15
Two primary methods of root placement give conflicting results. Placement by molecular clock prefers lineage B and placement by outgroup (via RaTG13 or other bat SARS-like viruses) prefers lineage A. This is detailed in @lpipes@ras_nielsen et al (academic.oup.com/mbe/article/38…). 9/15
Importantly, prior to Jesse's detective work, there were >77 genomes collected from Wuhan in Dec and Jan and shared publicly. These samples fall into both lineage A and lineage B (nextstrain.org/groups/blab/nc…). 10/15
As one might expect, the 13 sequences from BioProject SRR11313485 uncovered by @jbloom_lab also fall into both lineages A and B, with 8 out of 13 residing in lineage B (Table 1 of Bloom colored by identify at site 28144). 11/15
In this case, I completely agree that deletion of records from the SRA is alarming. However, I don't see what's to be gained from the deletion. Other Wuhan genomes clearly show both lineages circulating outside the market. 12/15
The samples in question are majority lineage B and are described in the Wang et al manuscript as from "early in the epidemic (January 2020)" and fit with general pattern of majority lineage B samples collected Jan 2020 from Wuhan. 13/15
I would view a comprehensive analysis of root placement with evidence from outgroups alongside genomic epi simulations ala @jepekar, Wertheim et al (science.sciencemag.org/content/372/65…) as fundamentally important to our assessment of COVID origins. 14/15
As I've said before, I believe both zoonosis and lab leak to be plausible hypotheses for COVID origins. I'm not pushing any narrative, just trying to figure out what's going on with this particular datapoint. 15/15
An update on genomic surveillance in the US and spread of the Delta variant (PANGO lineage B.1.617.2, Nextstrain clade 21A). At this point, 95% of viruses circulating in the US are "variant" viruses that have been designated as "Variant of Concern" or "Variant of Interest". 1/12
This update mirrors how I was looking at the rise of P.1 across the US in May. 2/12
Here, we can look at frequencies of different variant lineages through time and across states where it's clear that variant viruses and in particular B.1.617.2 viruses are continuing to increase in frequency. 3/12
With the publication of the Science letter, the Overton window for discussion of "lab leak" hypothesis has shifted dramatically. We now have mainstream scientific opinions that largely range between "lab leak can be dismissed" and "both zoonosis and lab leak are viable". 1/8
I am in the both are plausible camp. The data (as it exists) is consistent with zoonosis, but it's also consistent with lab leak. Parsing the relative probabilities of the two depends on multiple lines of evidence and is necessarily assumption ridden. 2/8
However, I think that there is a philosophical divide among scientists in how to assess hypotheses that perhaps explains some of the gap in opinion. Ie, is zoonosis the "null" hypothesis that we need significant evidence to reject or are we comparing two competing hypotheses? 3/8
#COVID19 cases in the US reported by @CDCGov have continued their week-after-week exponential decline that began in mid-April. This is exceptionally welcome news, although I'm now watching closely for variants driving sub-epidemics despite overall cases falling. 1/10
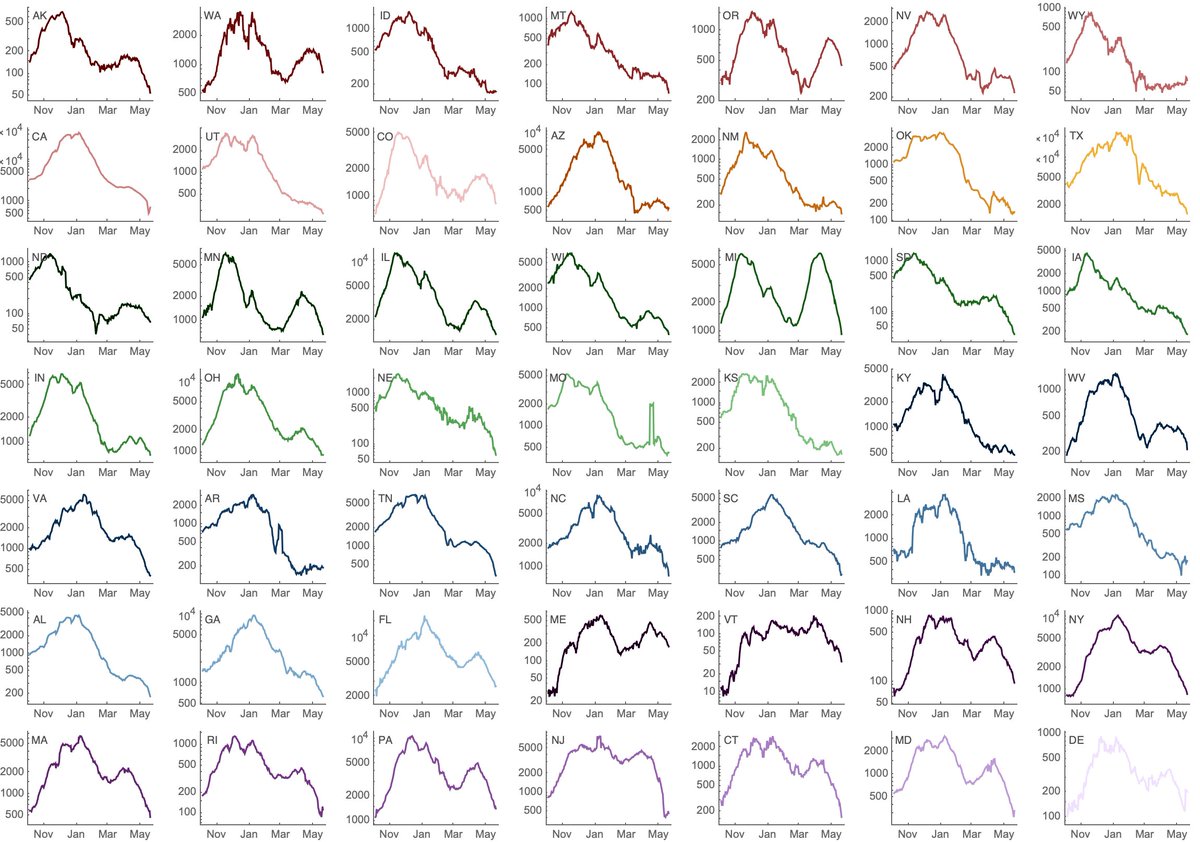
If we look at state-level cases with a log-axis we can see exponential growth and then exponential decline visible as straight lines on the log plot. Some states have had recent precipitous declines (NY, MA, MI), while others have been more stable (WA, CO, OR). 2/10
Using genomic data shared to @GISAID, we can plot frequency of different variant lineages through time and across states to get a sense of competitive dynamics. Here, I'm plotting lineage frequency on a logit axis, so that logistic growth is visible as a straight-line fit. 3/10
The drivers of the #COVID19 epidemic in India are certainly multifactorial, but we have now seen the viral lineage B.1.617 linked to this epidemic continue to increase in frequency in India and spread rapidly outside of the country. 1/10
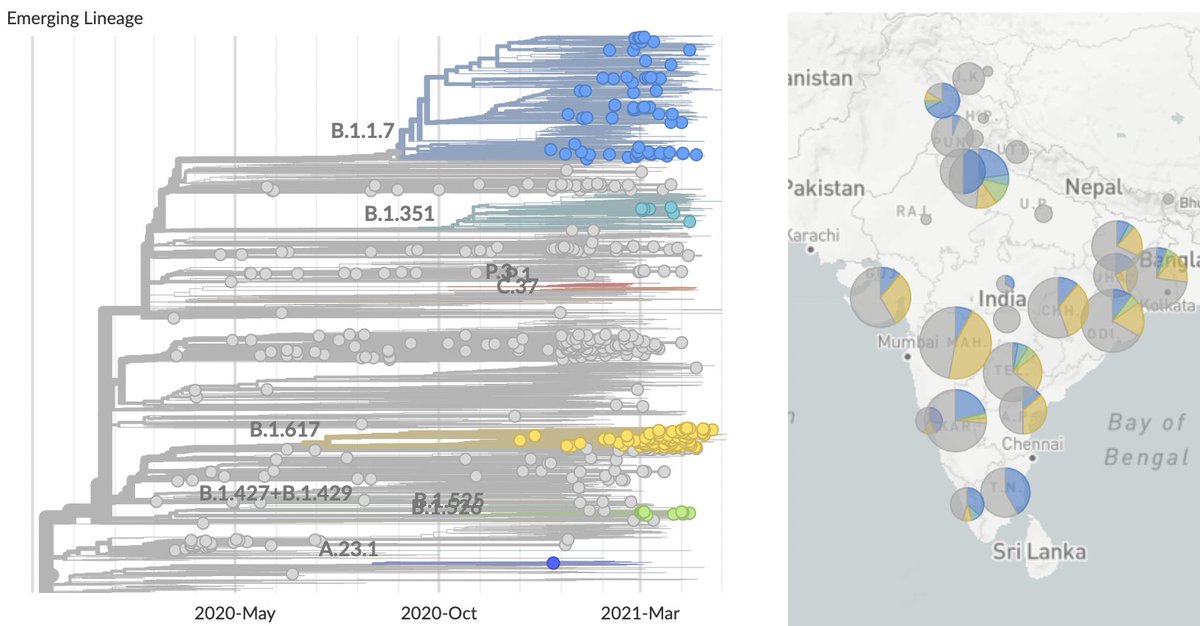
Looking within India there are three primary viral lineages of consequence: B.1.1.7 (in blue) and B.1.351 (in green) introduced into India repeatedly from outside the country and B.1.617 (in yellow) emerging endogenously from within India (nextstrain.org/ncov/asia?c=em…). 2/10
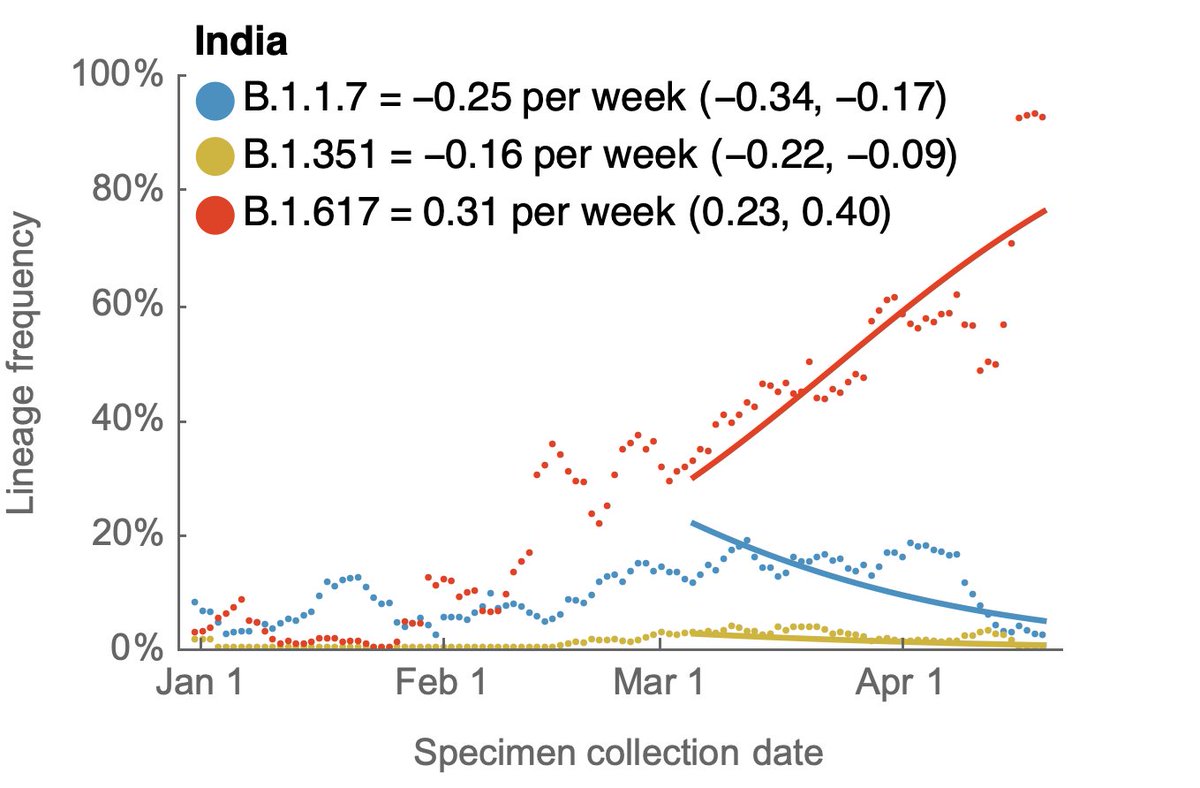
Tracking frequencies over time in sequence data shared to @gisaid shows a continued increase in B.1.617, while recent weeks have shown a decline in B.1.1.7. 3/10
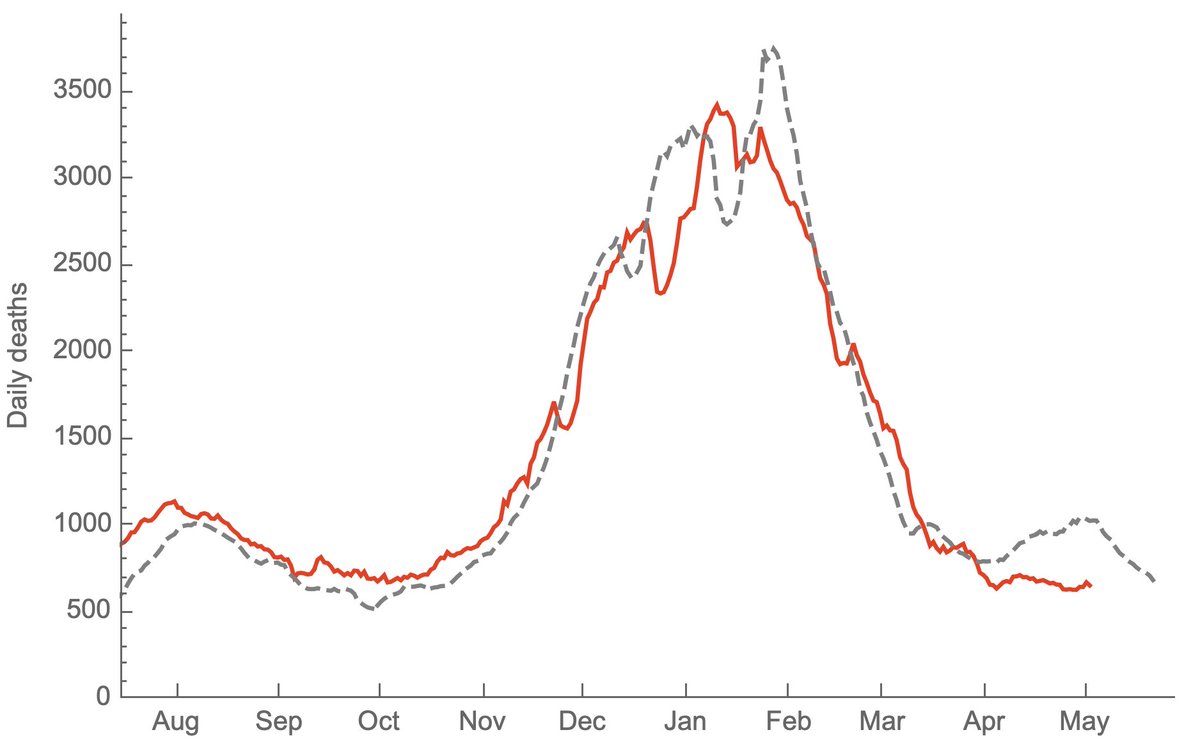
From Aug 2020 to Mar 2021, the lagged case fatality rate (CFR) of the US #COVID19 epidemic had remained largely constant at ~1.5% and provided a simple method to predict subsequent deaths from current cases. 1/6
I've rerun the previous analysis correlating state-level reported cases with state-level reported deaths with different lags. Using @CDCgov data since Aug 2020, I find that a 19 day lag of cases to deaths maximizes average state-level correlation coefficient. 2/6
This shows the resulting projection for deaths where the gray dashed line shows a lookahead projection where 1.5% of reported cases result in reported deaths 19 days later. This can be compared to the solid red line showing realized 7-day average of reported deaths. 3/6
Just as we can decompose the US #COVID19 epidemic into a B.1.1.7 epidemic and a non-B.1.1.7 epidemic, we can further partition by variants of concern B.1.1.7, B.1.351 and P.1, where it's clear that P.1 has been gaining ground. 1/13
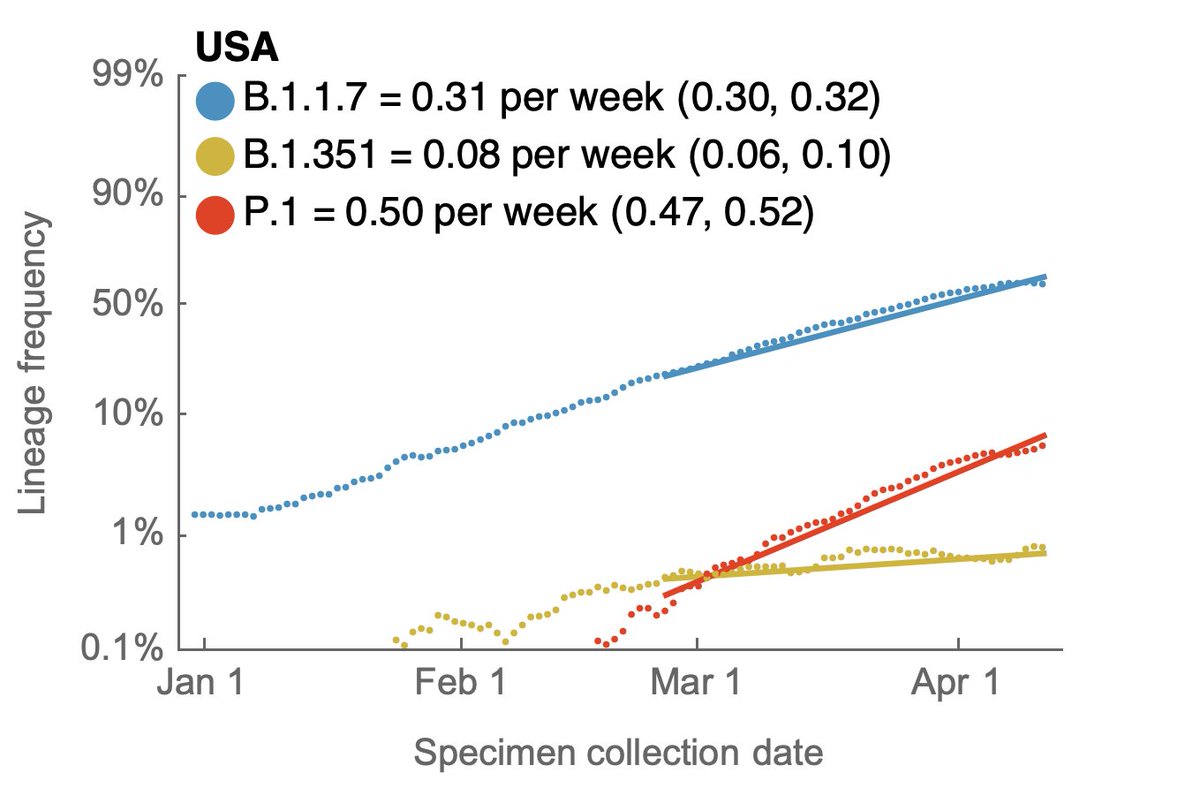
Here, using data from @GISAID, we see that in terms of frequencies across the US, P.1 has been undergoing more rapid logistic growth in frequency than B.1.1.7, while B.1.351 has been slower than B.1.1.7. 2/13
I'm plotting this with the unusual "logit" y-axis (with 1%, 10%, 50%, etc...) because a straight line in logit space is indicative of logistic growth. This sort of plot makes it easy to compare logistic growth rate of frequency between lineages with different frequencies. 3/13