From Aug 2020 to Mar 2021, the lagged case fatality rate (CFR) of the US #COVID19 epidemic had remained largely constant at ~1.5% and provided a simple method to predict subsequent deaths from current cases. 1/6
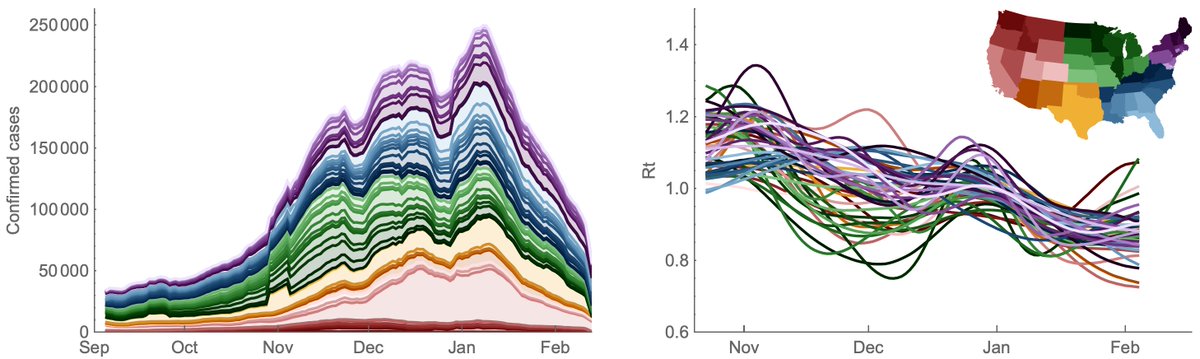
I've rerun the previous analysis correlating state-level reported cases with state-level reported deaths with different lags. Using @CDCgov data since Aug 2020, I find that a 19 day lag of cases to deaths maximizes average state-level correlation coefficient. 2/6
This shows the resulting projection for deaths where the gray dashed line shows a lookahead projection where 1.5% of reported cases result in reported deaths 19 days later. This can be compared to the solid red line showing realized 7-day average of reported deaths. 3/6
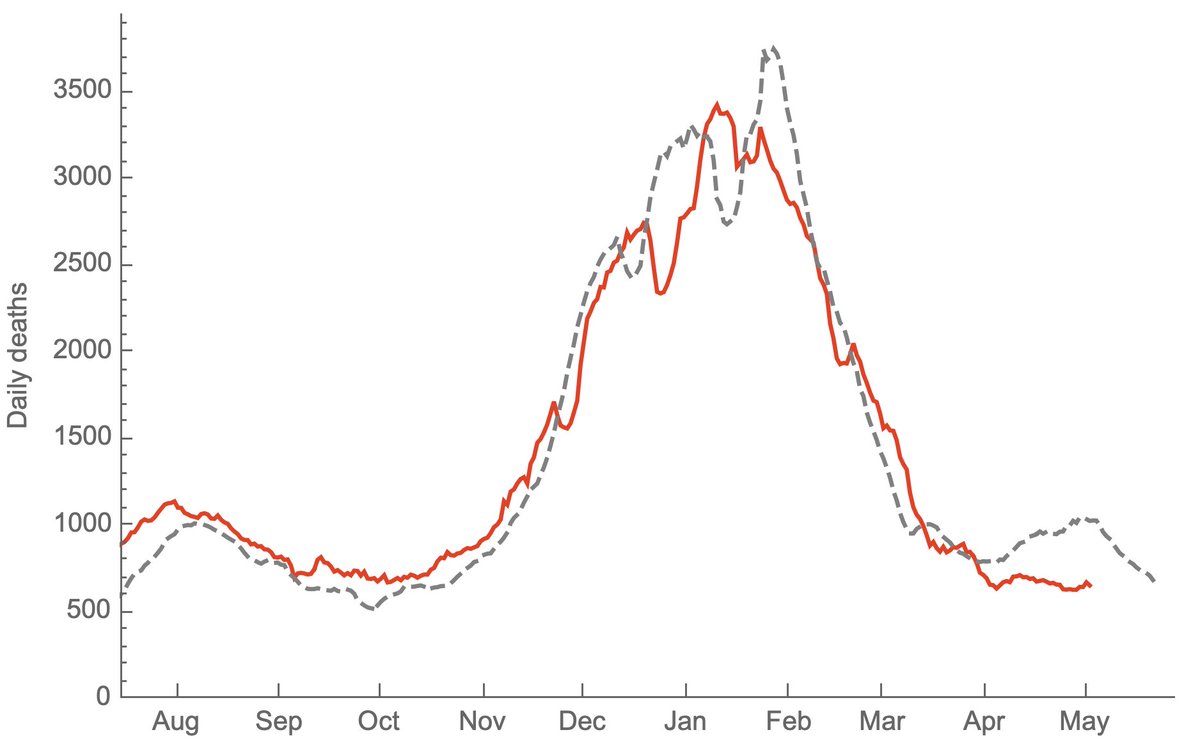
This simple lookahead projection predicted both the rise and the decline of deaths in the US fall/winter wave. However, this projection has not held from April onwards where you can see that projected deaths from cases (gray line) have exceeded realized deaths (red line). 4/6
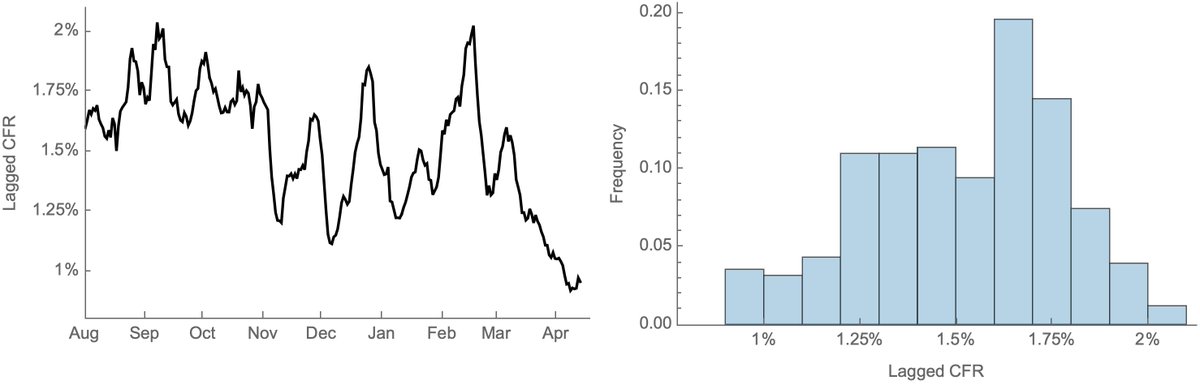
This separation of cases and deaths is visible in a timeseries of lagged CFR. Here, 19-day lagged CFR remains between 1.25% and 1.75% from Aug 2020 through Feb 2021, but declines from March onwards and falls below 1% for the first time in April. 5/6
I believe this recent drop in CFR can likely be explained by vaccination of older individuals partially shifting burden of cases to younger population, where risk of death is lower. A demographic shift in cases can be seen in this plot from covid.cdc.gov/covid-data-tra…. 6/6

• • •

Missing some Tweet in this thread? You can try to force a refresh
 

Keep Current with Trevor Bedford

Trevor Bedford Profile picture

Stay in touch and get notified when new unrolls are available from this author!

Read all threads

This Thread may be Removed Anytime!

PDF

Twitter may remove this content at anytime! Save it as PDF for later use!

Try unrolling a thread yourself!

how to unroll video
  1. Follow @ThreadReaderApp to mention us!

  2. From a Twitter thread mention us with a keyword "unroll"
@threadreaderapp unroll

Practice here first or read more on our help page!

More from @trvrb

3 May
Just as we can decompose the US #COVID19 epidemic into a B.1.1.7 epidemic and a non-B.1.1.7 epidemic, we can further partition by variants of concern B.1.1.7, B.1.351 and P.1, where it's clear that P.1 has been gaining ground. 1/13
Here, using data from @GISAID, we see that in terms of frequencies across the US, P.1 has been undergoing more rapid logistic growth in frequency than B.1.1.7, while B.1.351 has been slower than B.1.1.7. 2/13
I'm plotting this with the unusual "logit" y-axis (with 1%, 10%, 50%, etc...) because a straight line in logit space is indicative of logistic growth. This sort of plot makes it easy to compare logistic growth rate of frequency between lineages with different frequencies. 3/13
Read 13 tweets
26 Apr
There are effectively two #COVID19 epidemics in the US at this moment; one largely resolving epidemic comprised of non-variant viruses and one growing epidemic of B.1.1.7. Together they have resulted in a near-plateau of cases throughout much of the spring. 1/10
If we look at virus frequencies in the US using data in @GISAID, we can see that the 7-day weighted frequency of B.1.1.7 has been growing consistently since January and is now over 50% in the US. 2/10
This pattern is repeated across individual states. These six were chosen as states with plentiful genomic data and to provide geographic diversity. B.1.1.7 is dominating throughout the US, except for New York and surroundings where B.1.526 is co-circulating. 3/10
Read 10 tweets
23 Apr
It's hard for me to infer the degree to which new variants are driving the surge in cases in India, but we are seeing rapid growth in frequency of multiple viral variants. 1/5
Here is a @nextstrain view of @GISAID data that focuses on viruses from India and highlights emerging lineages B.1.1.7 (in blue), B.1.351 (in green) and B.1.617 (in orange). Interactive version at nextstrain.org/ncov/asia?c=em…. 2/5
We can fit a logistic growth model to the full genomic dataset from India for these three lineages, where we see logistic growth as "linear on a logit scale". Each of these lineages is estimated to have similar logistic growth rates of ~0.3 per week. 3/5
Read 5 tweets
23 Apr
When variants of concern were first identified in late Dec, the US was not where it needed to be in terms of genomic surveillance. However, with considerable ramp up by the CDC, state labs and academic groups, we now have a remarkable genomic surveillance system. 1/14
My favorite metric for genomic surveillance is the number of cases that have been sampled, sequenced and shared publicly to @GISAID in the previous 30 days. By incorporating both sequencing volume and turnaround time, it tells you how much is known about current circulation. 2/14
Throughout the fall, the US had just 100-300 genomes available that were sampled, sequenced and shared in the previous 30 days. 3/14
Read 14 tweets
14 Apr
Since their recognition in the UK, South Africa and Brazil in Dec 2020 and Jan 2021, the variant of concern lineages B.1.1.7, B.1.351 and P.1 have continued to spread throughout the world with B.1.1.7 so far the most successful of the three. 1/15
These lineages first received attention due to large numbers of mutations to the spike protein along with rapid increases in frequency in the UK, South Africa and Manaus, Brazil, but much subsequent attention has focused on key mutations E484K and N501Y. 2/15
This figure shows genotype at sites 484 and 501 mapped onto a reference phylogeny of ~4k viruses sampled from all over the world with 484K viruses in light orange, 501Y viruses in blue (including B.1.1.7) and 484K+501Y viruses in dark orange (including B.1.351 and P.1). 3/15
Read 16 tweets
18 Feb
After a ~2 month plateau from mid-Nov to mid-Jan, the US #COVID19 epidemic has undergone a steady week after week decline and is now back to daily case counts last seen in late October. A thread on what we might expect going forwards. 1/13
Working with case counts from @COVID19Tracking and Rt estimates from epiforecasts.io, I'm showing US confirmed cases broken out by state alongside transmission rate as measured by Rt through time. 2/13
Generally, Rt > 1 in Nov and Dec corresponding to rising cases and drops below 1 in Jan corresponding to falling cases. We've seen a steady decline in Rt from Nov to Feb. Thus, current decline is not a sudden shift in circumstance, but resulted from reaching Rt < 1. 3/13
Read 13 tweets

Did Thread Reader help you today?

Support us! We are indie developers!


This site is made by just two indie developers on a laptop doing marketing, support and development! Read more about the story.

Become a Premium Member ($3/month or $30/year) and get exclusive features!

Become Premium

Too expensive? Make a small donation by buying us coffee ($5) or help with server cost ($10)

Donate via Paypal Become our Patreon

Thank you for your support!

Follow Us on Twitter!

:(